TrustRadius: an HG Insights company

Save this comparison

Save this comparison

Add Product

Recommended Comparisons

    Overview
    ProductRatingMost Used ByProduct SummaryStarting Price

    Displayr

    Score9.5 out of 10
    N/ADisplayr is a survey data discovery and visualization tool, with free tools for publishing dashboards, reports and infographics (e.g. charts, and graphs) to the web or other repositories for sharing and demonstration, as well as support for analysis of large datasets (more than 1,000 rows and 100 column) on paid plans.N/A

    Genially

    Score7.6 out of 10
    N/AGenially is a provider of interactive visual communication and an online tool to create presentations, interactive images, infographics, dossiers, quizzes, resumes, etc. and enrich them with interactivity and animation effects. Without needing a team of designers and programmers, Genially is designed to allow enterprises to make an impact with striking, visual communication in a flash. It includes interactive and animated effects to distribute…

    $7.49

    per month (billed annually)

    Pricing
    DisplayrGenially
    Editions & Modules
    No answers on this topic
    Pro
    $7.49
    per month (billed annually)
    Master
    $20.82
    per month (billed annually) 5 members
    Team
    $70.79
    per month (billed annually)
    Offerings
    Pricing Offerings
    DisplayrGenially
    Free Trial
    NoNo
    Free/Freemium Version
    NoYes
    Premium Consulting/Integration Services
    NoYes
    Entry-level Setup FeeNo setup feeNo setup fee
    Additional Details——
    More Pricing Information
    Community Pulse
    DisplayrGenially
    Considered Both Products
    Displayr
    No answer on this topic
    Genially
    No answer on this topic
    Key User Insights
    Would buy again
    No answers on this topic
    80%
    Would buy again
    4 Answers
    Delivers good value for the price
    No answers on this topic
    No answers on this topic
    Happy with the feature set
    No answers on this topic
    100%
    Happy with the feature set
    5 Answers
    Lived up to sales and marketing promises
    No answers on this topic
    No answers on this topic
    Implementation went as expected
    No answers on this topic
    No answers on this topic
    Features
    DisplayrGenially
    Ad-hoc Reporting
    Comparison of Ad-hoc Reporting features of Displayr and Genially
    Feature
    Displayr
    8.8
    1 Ratings
    12% above category average
    Genially
    -
    Ratings
    Drill-down analysis9.01 Ratings00 Ratings
    Formatting capabilities8.01 Ratings00 Ratings
    Integration with R or other statistical packages10.01 Ratings00 Ratings
    Report sharing and collaboration8.01 Ratings00 Ratings
    Report Output and Scheduling
    Comparison of Report Output and Scheduling features of Displayr and Genially
    Feature
    Displayr
    10.0
    1 Ratings
    20% above category average
    Genially
    -
    Ratings
    Publish to Web10.01 Ratings00 Ratings
    Publish to PDF10.01 Ratings00 Ratings
    Report Versioning10.01 Ratings00 Ratings
    Data Discovery and Visualization
    Comparison of Data Discovery and Visualization features of Displayr and Genially
    Feature
    Displayr
    7.0
    1 Ratings
    10% below category average
    Genially
    -
    Ratings
    Pre-built visualization formats (heatmaps, scatter plots etc.)7.01 Ratings00 Ratings
    Best Alternatives
    DisplayrGenially
    Small Businesses
    Chartio (discontinued)
    Score7.5 out of 10
    GIMP
    Score8 out of 10
    Medium-sized Companies
    Jet Reports
    Score9.5 out of 10
    Adobe Illustrator
    Score9.4 out of 10
    Enterprises
    Kibana
    Score8.4 out of 10
    Adobe PhotoShop
    Score9.2 out of 10
    All AlternativesView all alternativesView all alternatives
    User Ratings
    DisplayrGenially
    Likelihood to Recommend
    8.0
    (1 ratings)
    7.3
    (5 ratings)
    Usability
    7.0
    (1 ratings)
    8.3
    (3 ratings)
    User Testimonials
    DisplayrGenially
    Likelihood to Recommend
    Displayr
    Displayr is perfectly suited for any insights or data people that understand the type of analysis they want to do, but don't know R code - or just want to get to results more quickly than coding themselves. It's probably not the best learning ground, if you've never done any quantitative analysis before, but then neither are traditional tools like SPSS or Q.
    Incentivized
    Read full review
    Genially
    The main use of Genially is the creation of interactive multimedia learning modules: we start from an online linear course consisting of PowerPoint Slides, usually poorly designed, and the audio recording of the lecturer commenting these slides. We reorganise these contents to make a truly interactive experience for the learner, using interactive windows to reveal contents. Interactive questions and branching structures are used to allow learners to navigate through our content according to their own pace
    Incentivized
    Read full review
    Pros
    Displayr
    • The intuitive interface and menus make it easy to quickly learn Displayr and find the types of data transformation or analysis that we're looking to do.
    • The support level from Displayr's team is FIRST CLASS. Where othe platforms force you to an FAQ or AI chat bot, Displayr's team will jump in first hand, into our data, or on a live call, and help us run a new type of analysis or troubleshoot a problem.
    • The ability to work collaboratively, asynchronously and remotely, on the same data set and report is a really huge plus for us.
    • The in-built options for multivariate analysis cover 99.9% of anything we have - or will - ever need to run.
    Incentivized
    Read full review
    Genially
    • Lets you build interactive presentations.
    • Helps you design good-looking presentations easily.
    • Lets you easily collaborate with teammates on projects.
    Incentivized
    Read full review
    Cons
    Displayr
    • The new "glow-up" on the interface has helped make it a bit easier on the eye, but there are some features of working in the "three pane" browser that are a bit frustrating: especially having to 'rearrange' when resizing the window to look at another app simultaneously.
    • Such a small point, but being able to drag and move multiple elements in a table (eg drag two rows to the top) SIMULTANEOUSLY would help a bunch.
    • I don't think we take advantage of all the visualisation capabilities in Displayr, and perhaps an AI 'recommendation' engine that sees the data I'm working with and prompts either a specific visualisation, or additional analysis option I might use, would be great.
    Incentivized
    Read full review
    Genially
    • It would be nice to be able to save images and have them available on Genially.
    • More free templates.
    • Figure out a way to make editing less time consuming.
    Incentivized
    Read full review
    Usability
    Displayr
    It's really quite intuitive, but the visual interface could be made a bit more easy to use (window/pane rescaling etc) and I think there could be more 'proactive prompts' to suggest features we're underutilising.
    Incentivized
    Read full review
    Genially
    It took a minute for me to understand how to use the product. Normally, I can just click around and figure things out. I had more questions on if the interactive element was accessible or not.
    Incentivized
    Read full review
    Alternatives Considered
    Displayr
    SPSS (the last version I looked at) still requires much more underlying knowledge and coding ability to get where we want to be. That's not where we add value, so the speed and simplicity with which Displayr allows us to get the data analysis done, and move onto developing insight and delivering value is why I chose Displayr.
    Incentivized
    Read full review
    Genially
    This web tool is designed to be broad and wide-reaching because it can be used in several ways such as attracting customers, circulating news, and teaching skills. You don't have to be a programmer to create stunning digital projects that are both unique and stunning.
    Incentivized
    Read full review
    Return on Investment
    Displayr
    • I think Displayr is quite expensive, but has the biggest impact on our P&L of any of our subscriptions, because it has unlocked our ability to deliver bigger, more complex analytic projects for clients - and hence grow our topline.
    • The ability to scale the license between years has also been a god-send as our team has gone up or down to deliver the level of quant work available to us.
    • There's also a bottom line efficiency driven by some of the speed of analysis that Displayr enables.
    Incentivized
    Read full review
    Genially
    • We unfortunately don't measure this.
    Incentivized
    Read full review
    ScreenShots

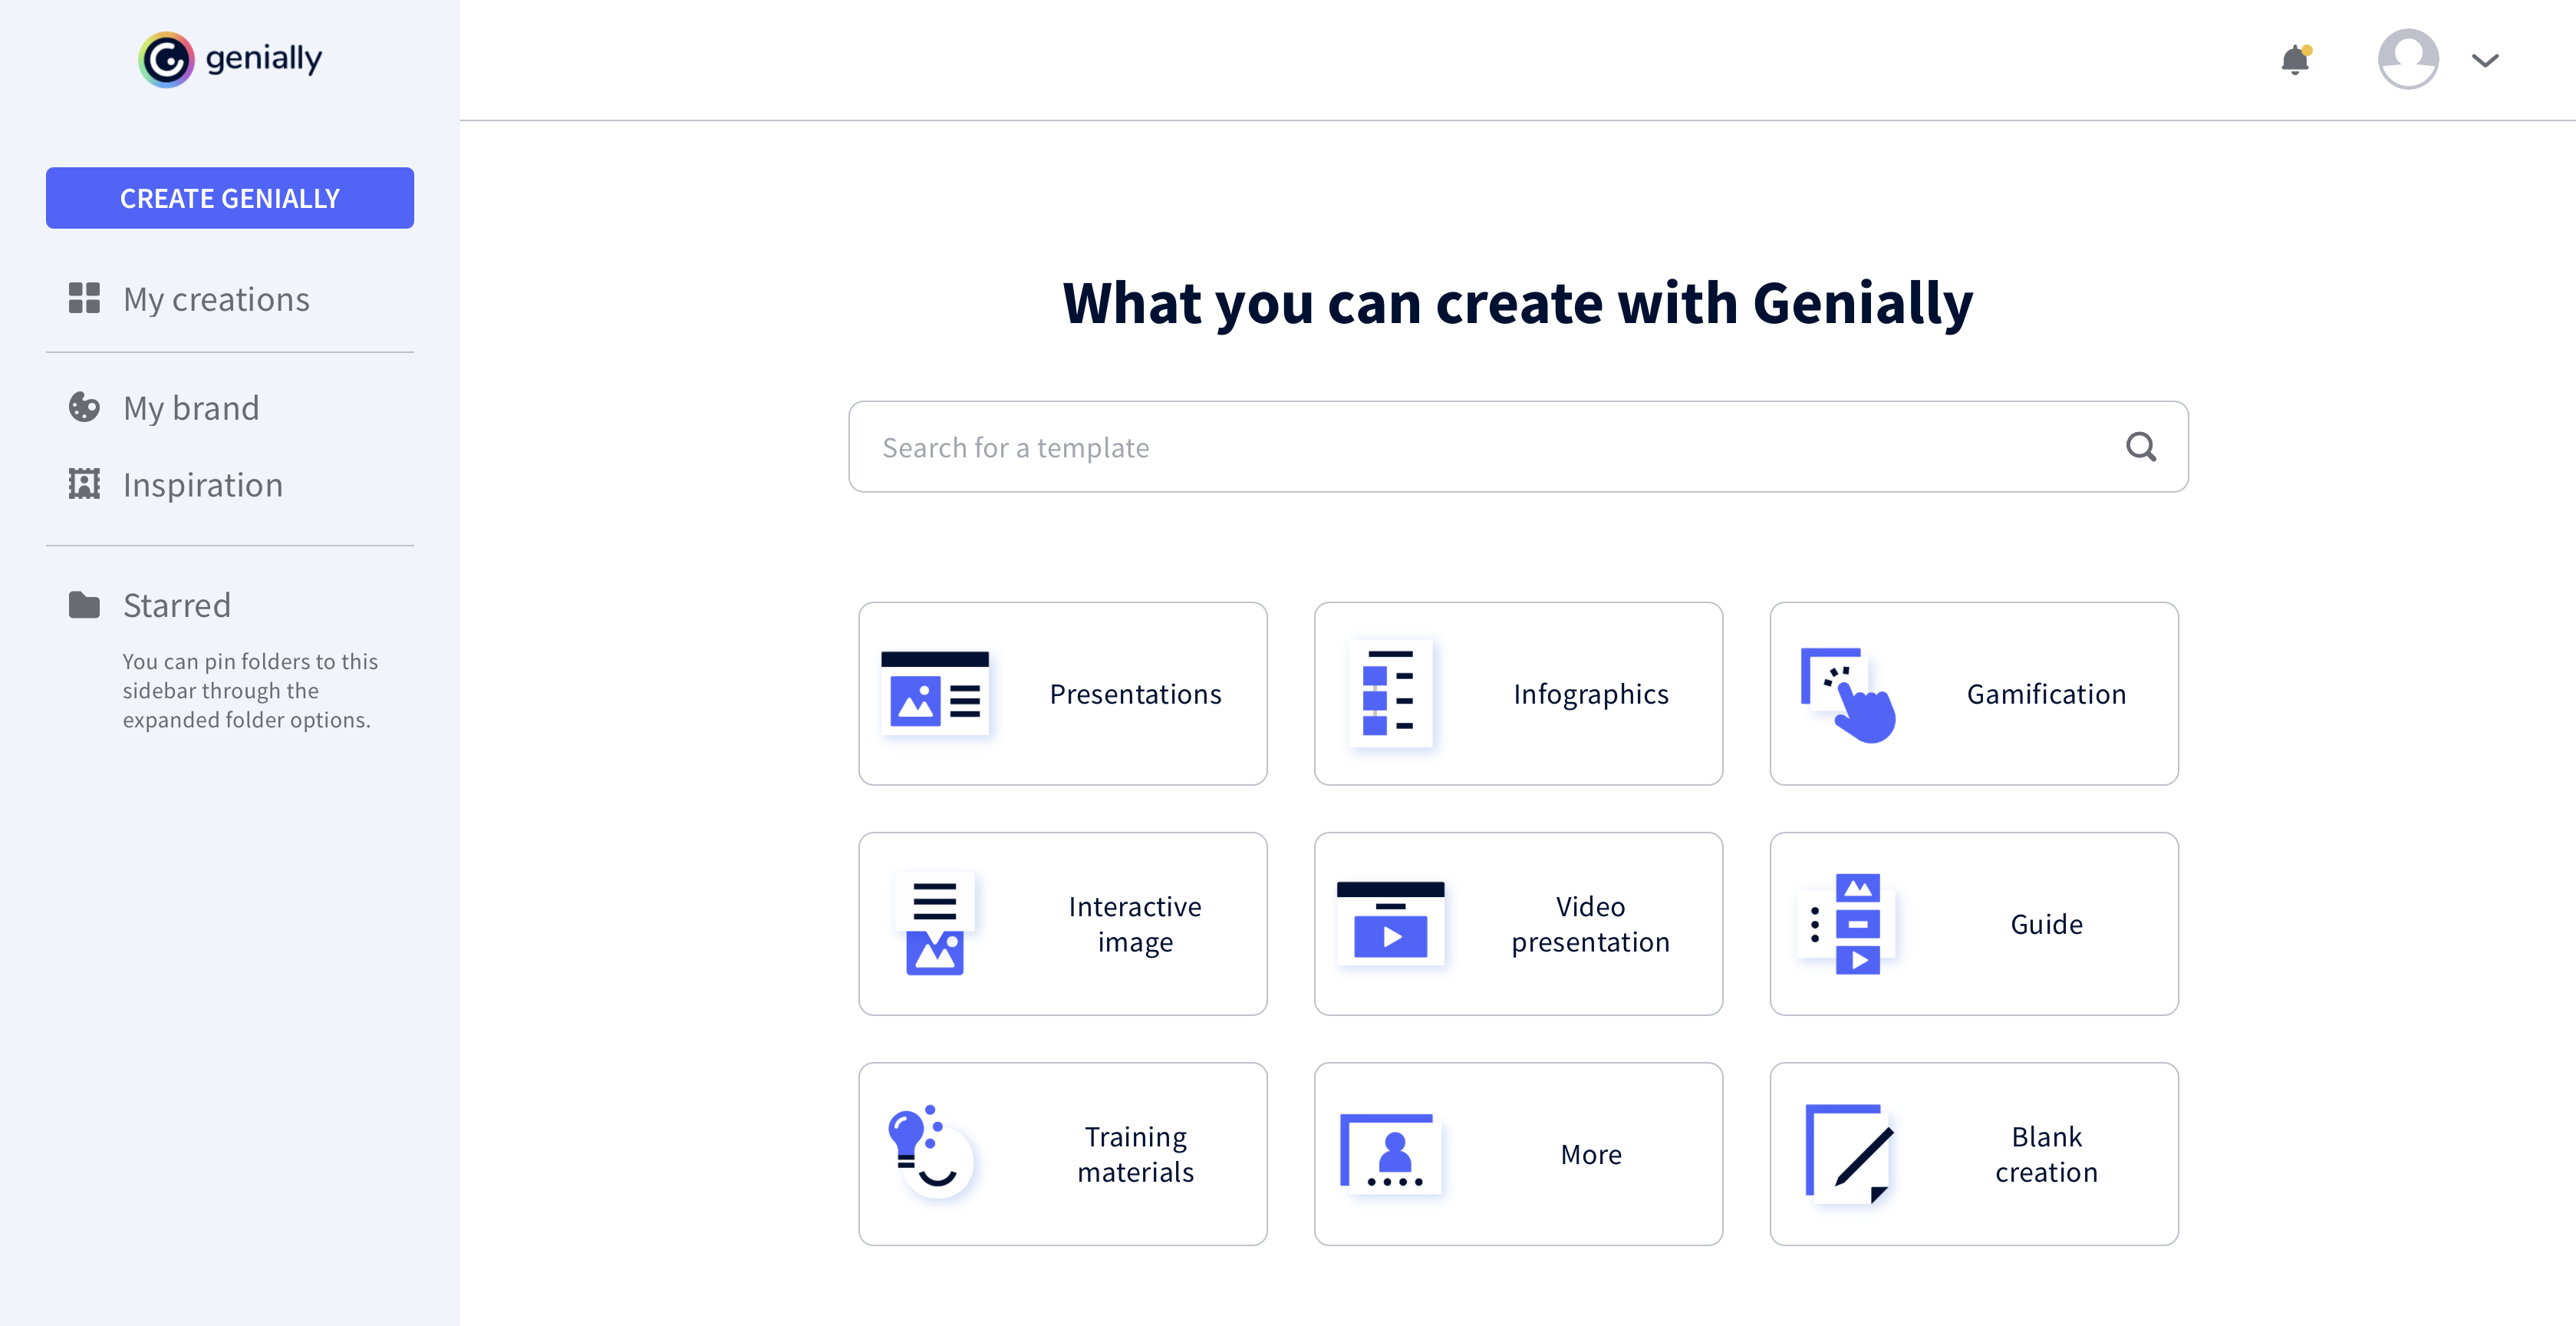
    Genially Screenshots

    Product screenshotProduct screenshotProduct screenshotProduct screenshot