Grafana vs. Rational BI
Grafana vs. Rational BI
| Product | Rating | Most Used By | Product Summary | Starting Price |
|---|---|---|---|---|
 Grafana | N/A | Grafana is a data visualization tool developed by Grafana Labs in New York. It is available open source, managed (Grafana Cloud), or via an enterprise edition with enhanced features. Grafana has pluggable data source model and comes bundled with support for popular time series databases like Graphite. It also has built-in support for cloud monitoring vendors like Amazon Cloudwatch, Microsoft Azure and SQL databases like MySQL. Grafana can combine data from many places into a single dashboard. | $0 | |
 Rational BI | Enterprise companies (1,001+ employees) | Rational BI provides analytics, data science and business intelligence in an analytical platform that connects to databases, data files and cloud drives including AWS and Azure data sources, enabling users to explore and visualize data. Users can build real-time notebook-style reports directly in a web browser with JavaScript and SQL with direct and live connections to data. Filter and query data with an SQL database embedded in the client, without network… | $0 single user |
| Grafana | Rational BI | |||||||||||||||
|---|---|---|---|---|---|---|---|---|---|---|---|---|---|---|---|---|
| Editions & Modules |
|
| ||||||||||||||
| Offerings |
| |||||||||||||||
| Entry-level Setup Fee | No setup fee | Optional | ||||||||||||||
| Additional Details | — | Additional cost per extra user (varies by edition) | ||||||||||||||
| More Pricing Information | ||||||||||||||||
| Grafana | Rational BI |
|---|
| Grafana | Rational BI | ||||||||||||||||||
|---|---|---|---|---|---|---|---|---|---|---|---|---|---|---|---|---|---|---|---|
| BI Standard Reporting |
| ||||||||||||||||||
| Ad-hoc Reporting |
| ||||||||||||||||||
| Report Output and Scheduling |
| ||||||||||||||||||
| Data Discovery and Visualization |
|
| Grafana | Rational BI | |
|---|---|---|
| Small Businesses |  Supermetrics Score 9.8 out of 10 | Supermetrics Score 9.8 out of 10 |
| Medium-sized Companies | Supermetrics Score 9.8 out of 10 | Supermetrics Score 9.8 out of 10 |
| Enterprises |  IBM Analytics Engine Score 7.2 out of 10 | IBM Analytics Engine Score 7.2 out of 10 |
| All Alternatives | View all alternatives | View all alternatives |
| Grafana | Rational BI | |
|---|---|---|
| Likelihood to Recommend | 9.3 (7 ratings) | 7.7 (4 ratings) |
| Usability | 9.6 (3 ratings) | 8.7 (4 ratings) |
| Support Rating | - (0 ratings) | 7.7 (4 ratings) |
| Grafana | Rational BI | |
|---|---|---|
| Likelihood to Recommend | Grafana Labs
| Rational BI
|
| Pros | Grafana Labs
| Rational BI
|
| Cons | Grafana Labs
 ANurag Tamrakar Software Engineer - DevOps | Rational BI
 Judy L. Berglund Solutions Architect - Infrastructure Solutions Group |
| Usability | Grafana Labs
| Rational BI
|
| Support Rating | Grafana Labs No answers on this topic | Rational BI
|
| Alternatives Considered | Grafana Labs
| Rational BI
|
| Return on Investment | Grafana Labs
| Rational BI
Judy L. Berglund Solutions Architect - Infrastructure Solutions Group |
| ScreenShots | Rational BI Screenshots  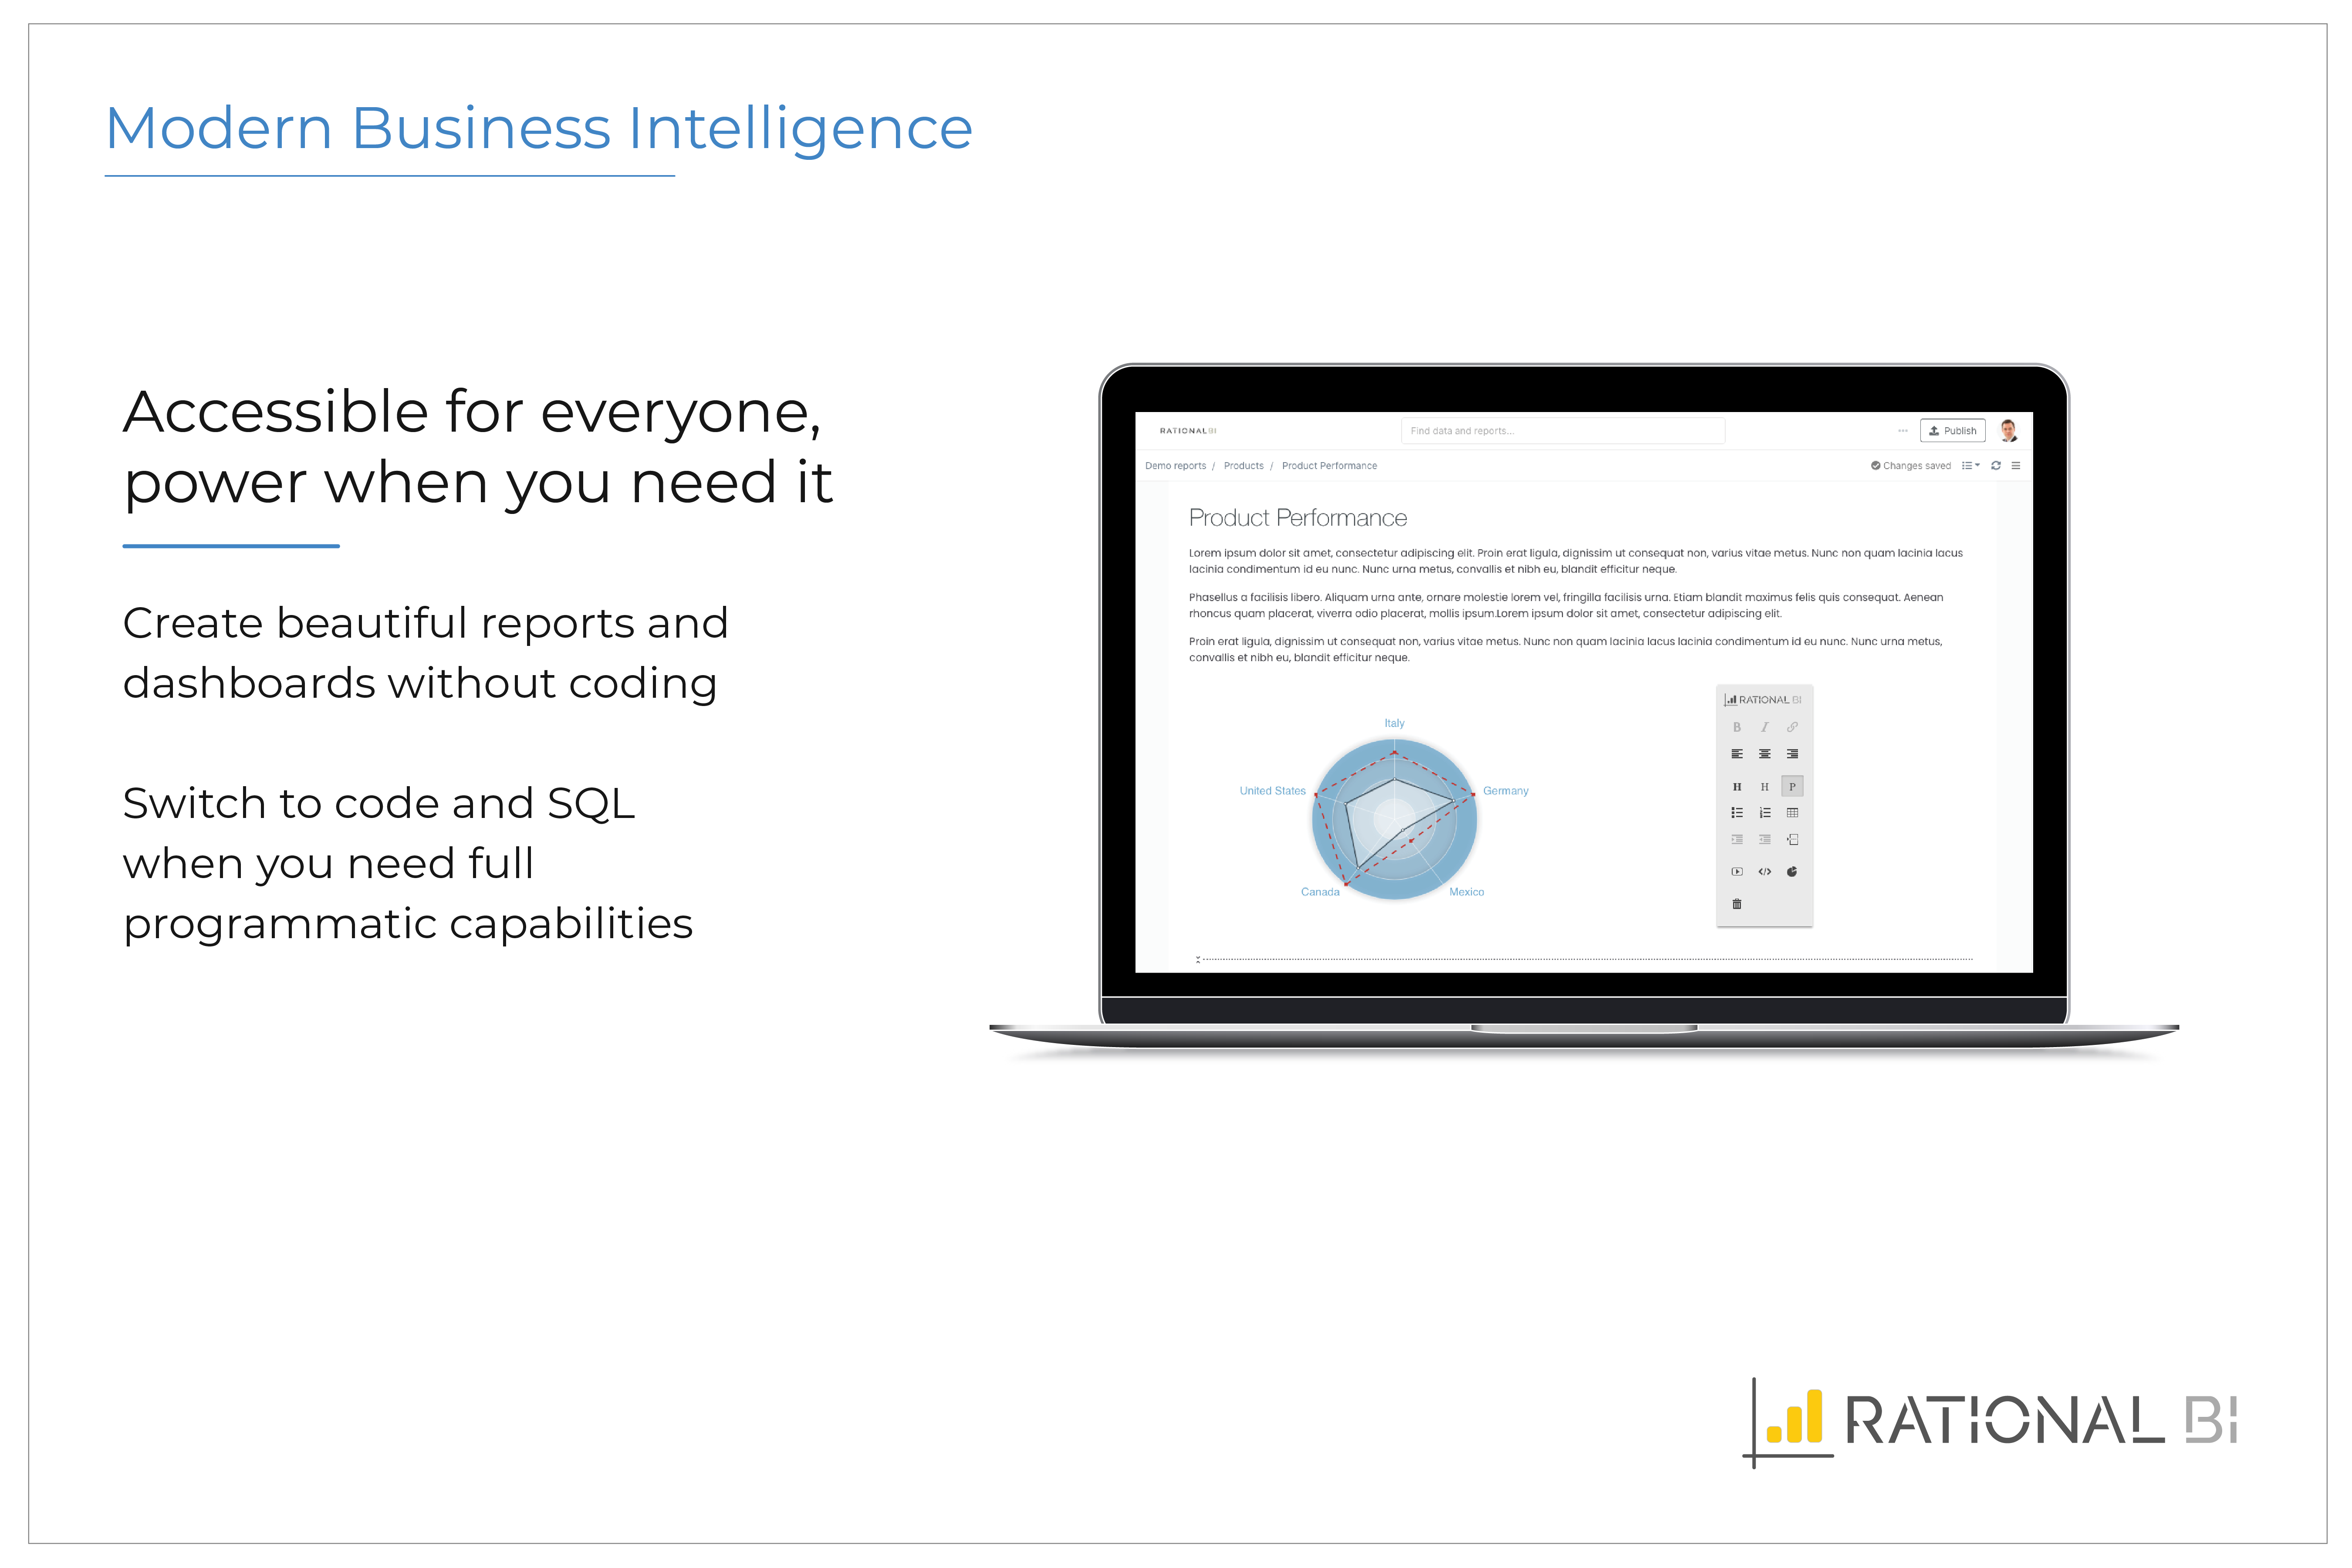  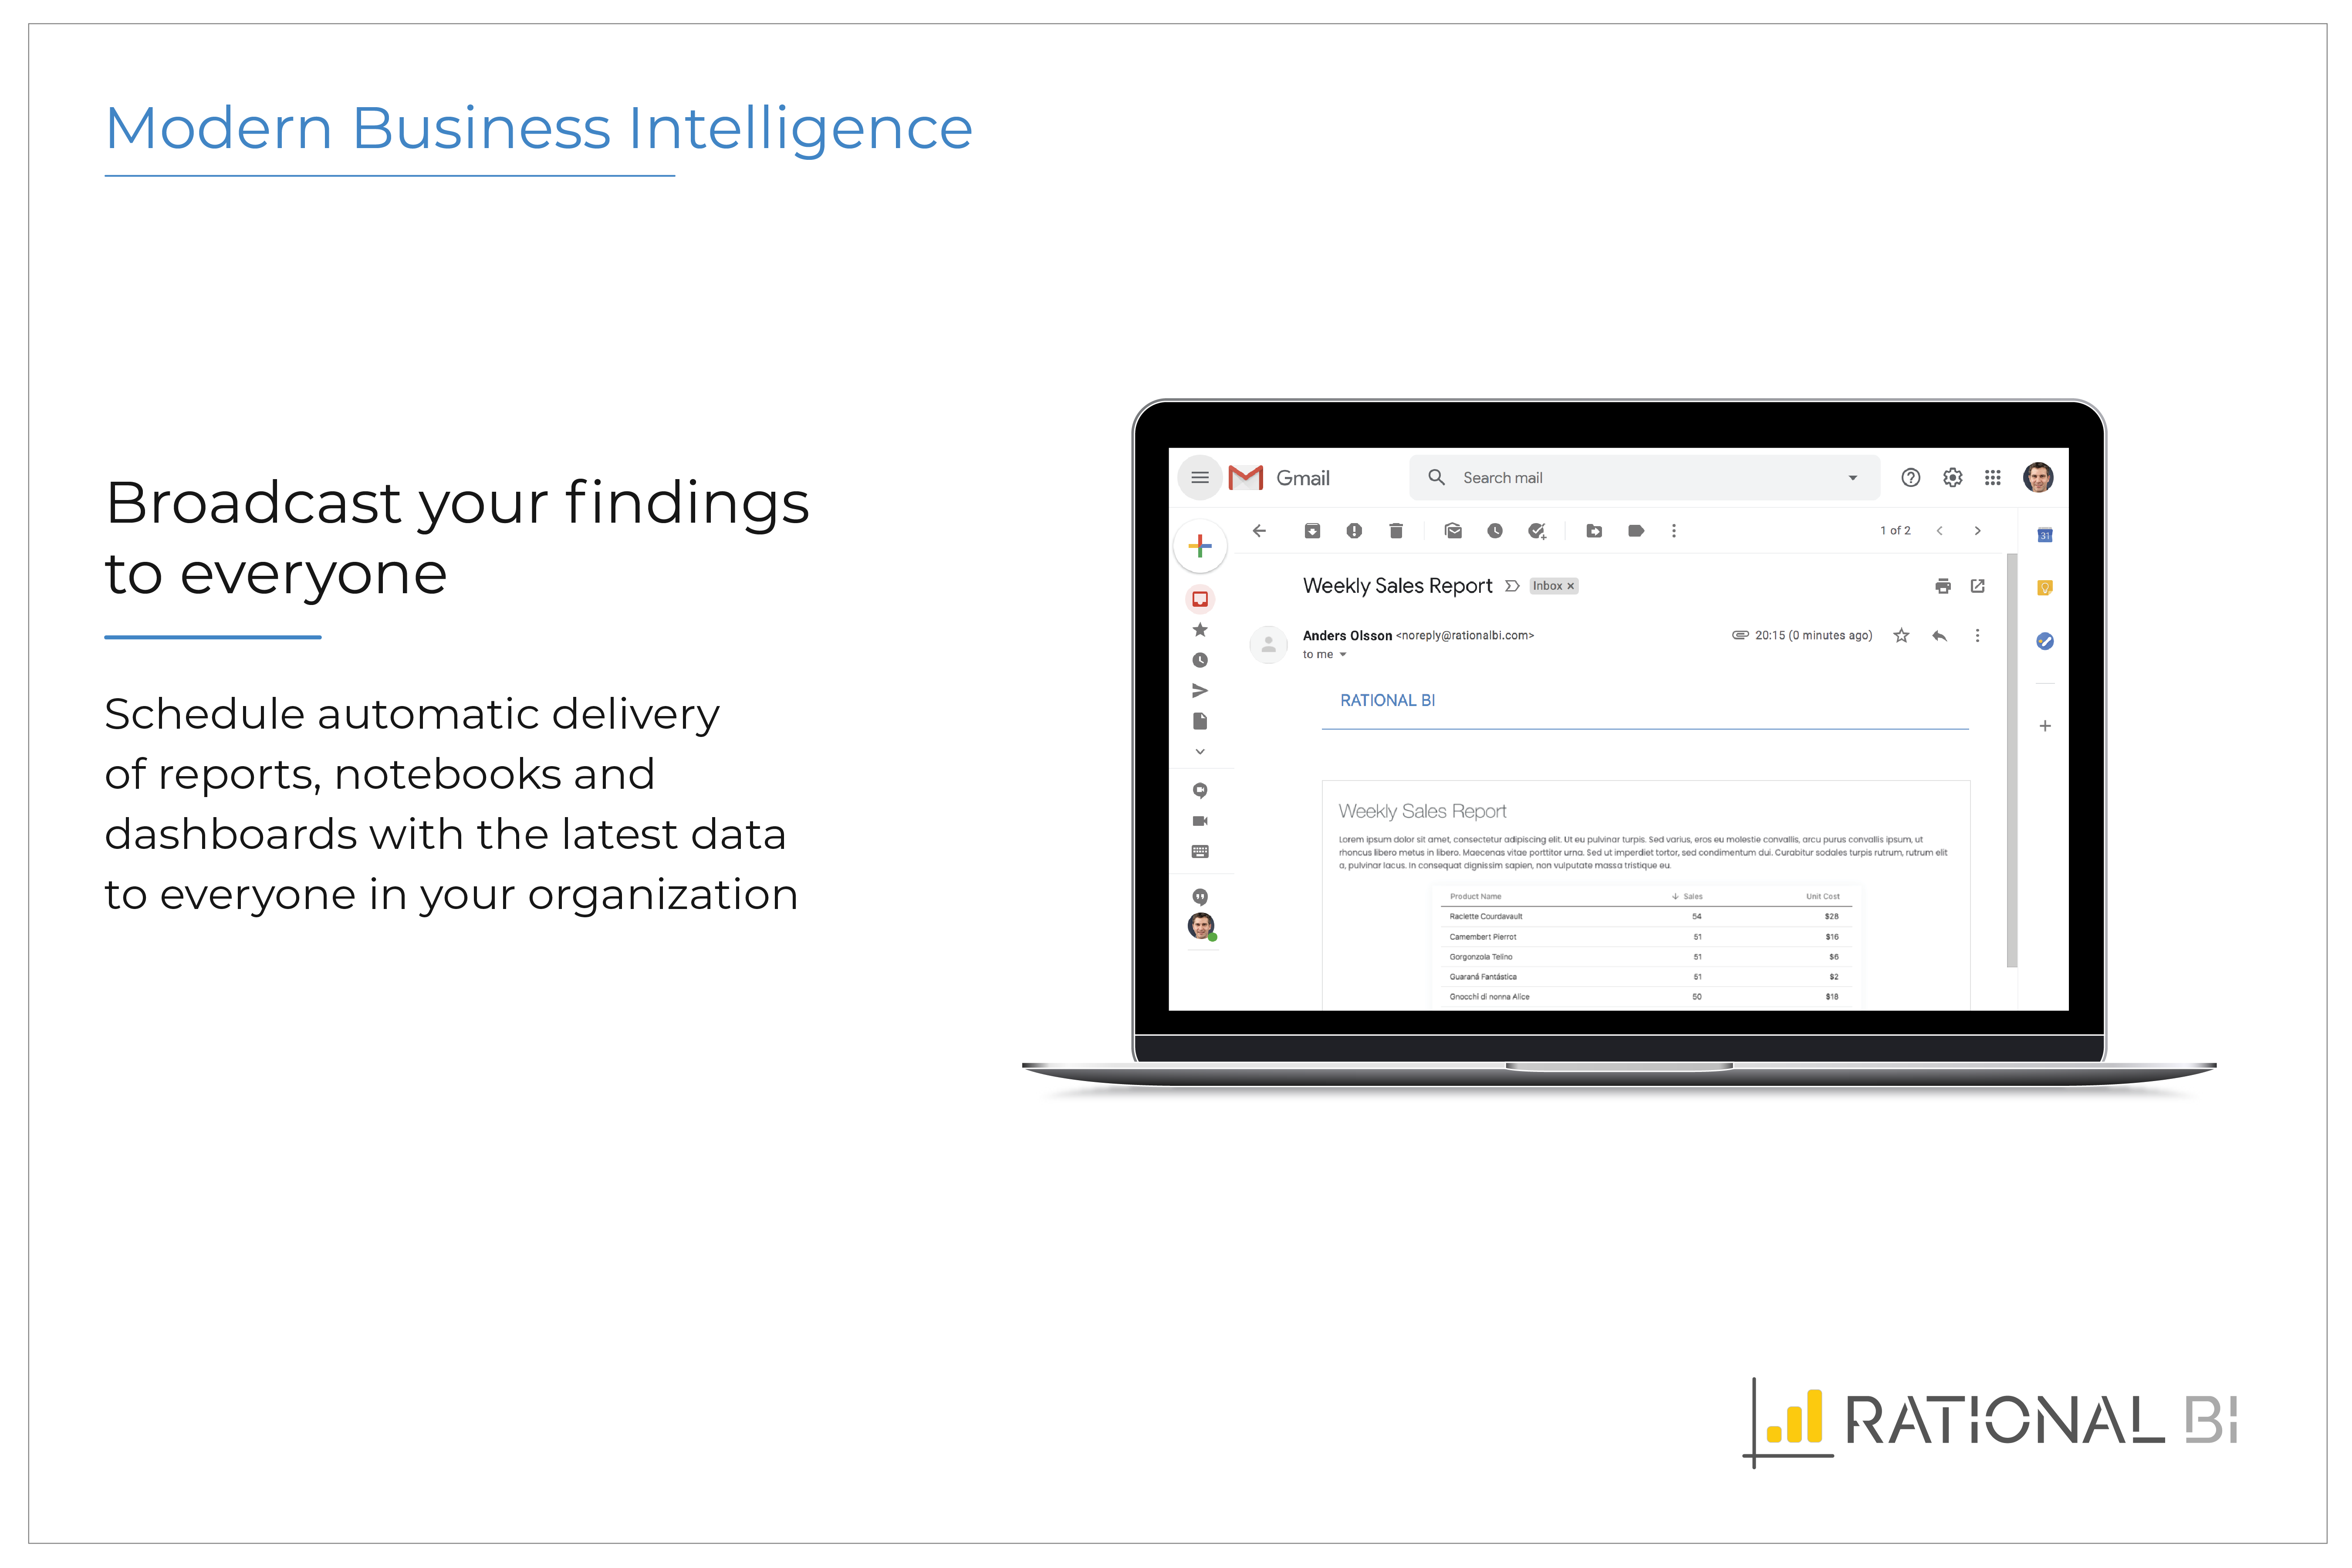 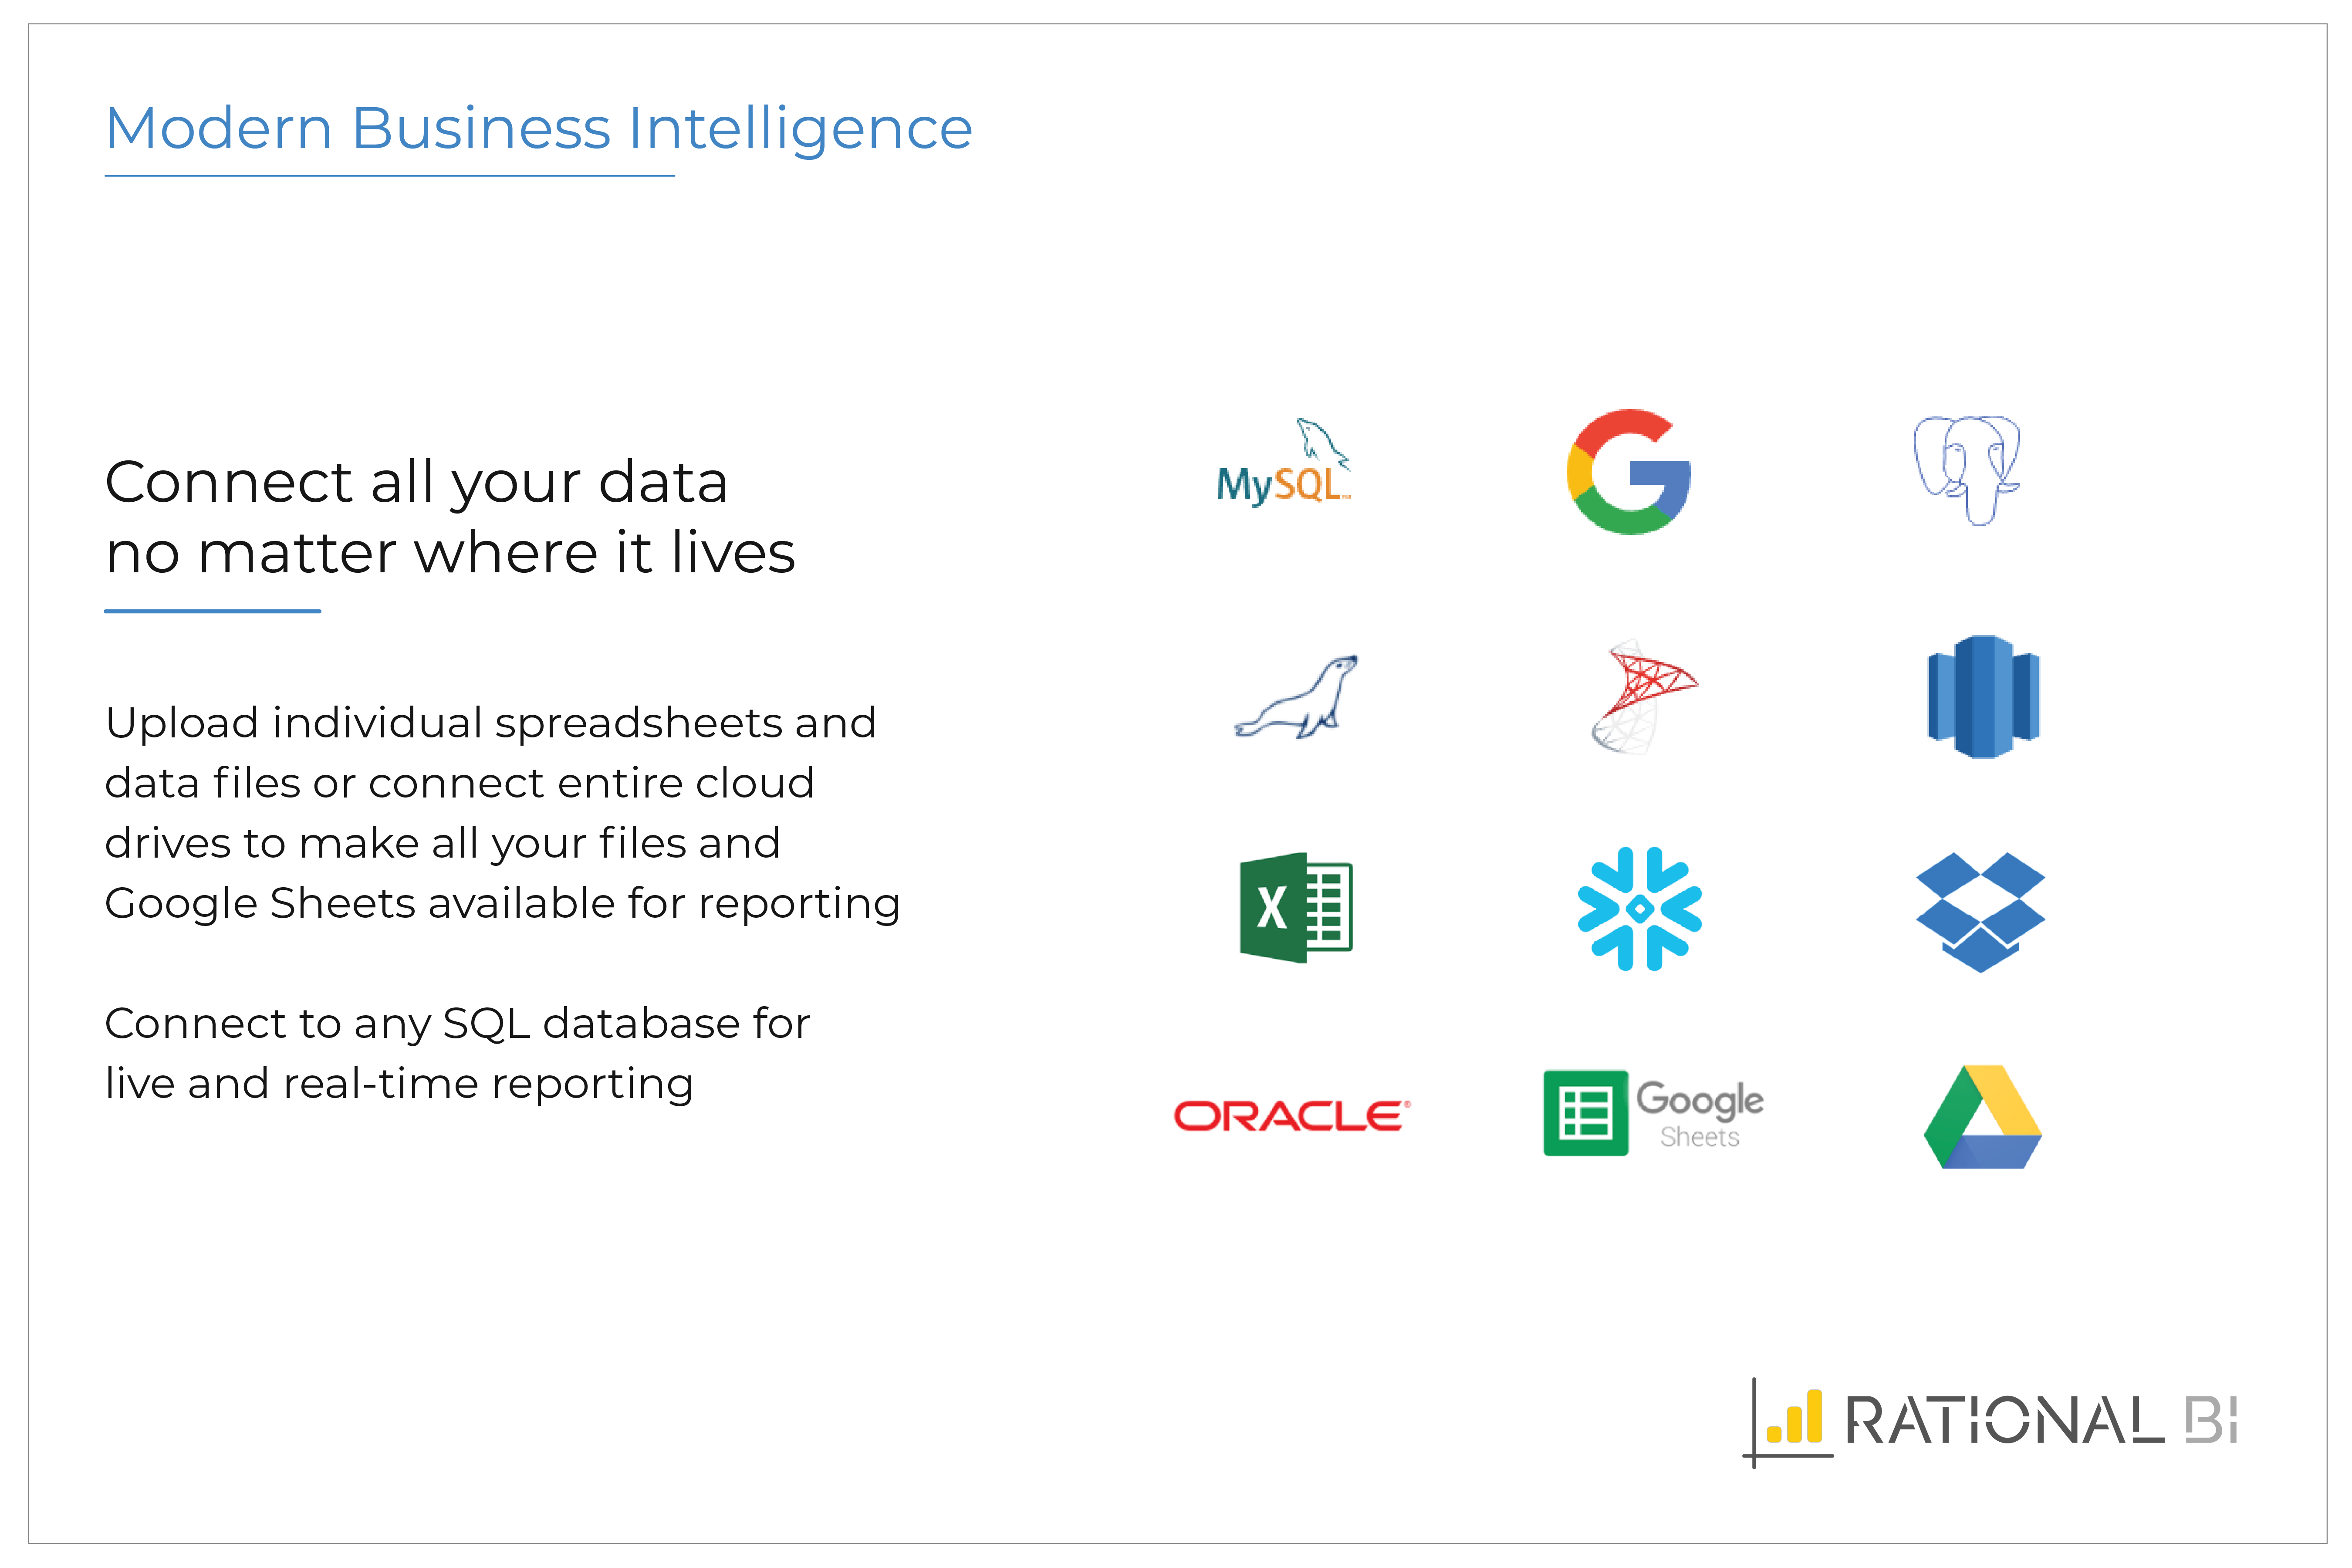 |