TrustRadius: an HG Insights company

Save this comparison

Save this comparison

Add Product

Recommended Comparisons

    Overview
    ProductRatingMost Used ByProduct SummaryStarting Price

    iCharts

    Score8 out of 10
    Mid-Size Companies (51-1,000 employees)
    iCharts is a Business Intelligence and Analytics solution for NetSuite. With this solution, users can transform their NetSuite data into interactive, real-time analytics without leaving their NetSuite dashboard. iCharts includes drag-and-drop chart creation and best-practice templates. The vendor’s value proposition is that iCharts accelerates an organization’s analytics strategy by empowering their team with the critical data-driven tools they need.

    $10,000

    per installation

    OpenText Magellan BI & Reporting

    Score7.3 out of 10
    N/AThe OpenText Magellan BI & Reporting (formerly OpenText Information Hub (iHub)) component of OpenText™ Magellan™ Analytics Suite is a scalable analytics and data visualization platform that enables IT leaders and their teams to design, deploy, and manage secure, interactive web applications, reports, and dashboards fed by multiple data sources. Magellan BI & Reporting supports high volumes of users, and its integration APIs enable embedded analytic content in any app, displayed on any…N/A
    Pricing
    iChartsOpenText Magellan BI & Reporting
    Editions & Modules
    Professional
    $10,000
    per installation
    Business
    15,000
    per installation
    Elite
    $25,000
    per installation
    No answers on this topic
    Offerings
    Pricing Offerings
    iChartsOpenText Magellan BI & Reporting
    Free Trial
    YesNo
    Free/Freemium Version
    NoNo
    Premium Consulting/Integration Services
    YesNo
    Entry-level Setup Fee$3,000 per installationNo setup fee
    Additional DetailsBased on number of NetSuite licenses—
    More Pricing Information
    Features
    iChartsOpenText Magellan BI & Reporting
    BI Standard Reporting
    Comparison of BI Standard Reporting features of iCharts and OpenText Magellan BI & Reporting
    Feature
    iCharts
    9.0
    2 Ratings
    10% above category average
    OpenText Magellan BI & Reporting
    5.0
    1 Ratings
    36% below category average
    Customizable dashboards10.02 Ratings2.01 Ratings
    Report Formatting Templates8.01 Ratings6.01 Ratings
    Pixel Perfect reports00 Ratings7.01 Ratings
    Ad-hoc Reporting
    Comparison of Ad-hoc Reporting features of iCharts and OpenText Magellan BI & Reporting
    Feature
    iCharts
    9.0
    2 Ratings
    12% above category average
    OpenText Magellan BI & Reporting
    7.7
    1 Ratings
    1% below category average
    Drill-down analysis9.02 Ratings6.01 Ratings
    Report sharing and collaboration9.02 Ratings8.01 Ratings
    Formatting capabilities00 Ratings9.01 Ratings
    Report Output and Scheduling
    Comparison of Report Output and Scheduling features of iCharts and OpenText Magellan BI & Reporting
    Feature
    iCharts
    10.0
    1 Ratings
    20% above category average
    OpenText Magellan BI & Reporting
    -
    Ratings
    Publish to Web10.01 Ratings00 Ratings
    Data Discovery and Visualization
    Comparison of Data Discovery and Visualization features of iCharts and OpenText Magellan BI & Reporting
    Feature
    iCharts
    8.0
    1 Ratings
    0% above category average
    OpenText Magellan BI & Reporting
    7.0
    1 Ratings
    10% below category average
    Pre-built visualization formats (heatmaps, scatter plots etc.)8.01 Ratings7.01 Ratings
    Location Analytics / Geographic Visualization00 Ratings7.01 Ratings
    Access Control and Security
    Comparison of Access Control and Security features of iCharts and OpenText Magellan BI & Reporting
    Feature
    iCharts
    8.7
    2 Ratings
    3% above category average
    OpenText Magellan BI & Reporting
    8.7
    1 Ratings
    13% above category average
    Multi-User Support (named login)9.02 Ratings10.01 Ratings
    Role-Based Security Model8.02 Ratings6.01 Ratings
    Multiple Access Permission Levels (Create, Read, Delete)9.02 Ratings10.01 Ratings
    Mobile Capabilities
    Comparison of Mobile Capabilities features of iCharts and OpenText Magellan BI & Reporting
    Feature
    iCharts
    10.0
    2 Ratings
    26% above category average
    OpenText Magellan BI & Reporting
    -
    Ratings
    Responsive Design for Web Access10.01 Ratings00 Ratings
    Dashboard / Report / Visualization Interactivity on Mobile10.02 Ratings00 Ratings
    Application Program Interfaces (APIs) / Embedding
    Comparison of Application Program Interfaces (APIs) / Embedding features of iCharts and OpenText Magellan BI & Reporting
    Feature
    iCharts
    -
    Ratings
    OpenText Magellan BI & Reporting
    7.0
    1 Ratings
    3% below category average
    REST API00 Ratings7.01 Ratings
    Javascript API00 Ratings9.01 Ratings
    Java API00 Ratings7.01 Ratings
    Best Alternatives
    iChartsOpenText Magellan BI & Reporting
    Small Businesses
    Cyfe
    Score4 out of 10
    GoodData.AI
    Score8.8 out of 10
    Medium-sized Companies
    Qlik Cloud Analytics (Qlik Sense)
    Score8.1 out of 10
    Reveal
    Score10 out of 10
    Enterprises
    Jaspersoft Community Edition
    Score7 out of 10
    Microsoft Power BI Embedded
    Score8 out of 10
    All AlternativesView all alternativesView all alternatives
    User Ratings
    iChartsOpenText Magellan BI & Reporting
    Likelihood to Recommend
    8.0
    (2 ratings)
    5.0
    (1 ratings)
    Data Sharing and Collaboration
    5.0
    (1 ratings)
    7.0
    (1 ratings)
    Data Sources
    4.0
    (1 ratings)
    8.0
    (1 ratings)
    User Testimonials
    iChartsOpenText Magellan BI & Reporting
    Likelihood to Recommend
    iCharts, Inc.
    The iCharts has suited our organization work as it has helped us a lot in our internal and external works. As we use iCharts for the internal team in representing the working reports and data of the business in an accurate manner. It helps in representing the presentation to the client to showcase our work and present him the data and work flow through the iCharts. As I don't found anything missing in this software.
    Read full review
    OpenText
    iHub is a decent enough environment that it serves our needs. We can have unlimited users and it can tie into AD although we do not use that feature currently. It is a decent place to store all of the reports in one location, even though for us it is not visually appealing to the end users. iHub is not a place where you want to create robust/interactive dashboards for end users to drill through and follow a "story".
    Incentivized
    Read full review
    Pros
    iCharts, Inc.
    • Their new platform is easy to navigate
    • We had a dedicated support person to help set up searches and train in the use of iCharts
    • Separate Dashboards for each group
    Incentivized
    Read full review
    OpenText
    • It is fairly easy to set the sharing rules for a report/dashboard.
    • They have a decent amount of time frame options for setting a schedule to generate a report.
    • The support is mostly helpful and timely if you have an issue.
    Incentivized
    Read full review
    Cons
    iCharts, Inc.
    • The new platform has limitations on colors and sizing
    • iCharts seem to have closed its doors without notification and now we have a product with no support
    Incentivized
    Read full review
    OpenText
    • Setting up a "dashboard" is extremely lacking in functionality. The different chart widgets you place on the page do not interact with each other. When you select an item from one do not expect it to highlight or filter another.
    • The speed and stability are not great, but maybe that is just our environment not being up to snuff...even though we are above the "recommended" settings.
    • The main GUI for a user is TERRIBLE. You log into a File Tree format where you have to navigate folders to reach the correct dashboard. There are ways around this, but it would either require an expensive payment to the Professional Services team to revamp to UI or another option they gave us was to create the "Default Dashboard" and provide that link to users and in that Dashboard, you use a new tab to include the navigation back to the main screen so that at least on the initial load the user is taken to a friendly looking dashboard instead of a file tree.
    Incentivized
    Read full review
    Alternatives Considered
    iCharts, Inc.
    I haven't experience any other alternative product of this.
    Read full review
    OpenText
    Our instance of iHub does not stack up against the other larger BI tools out today. It is a good place to store reports in a central location that allows users to run very specific reports on demand, but it is not a place I would want to store all of my "dashboards". As far as holding individual reports that are specific to an individual need, it is a great tool. If you want to create a report that will be used as a Template for a Form or a Label, iHub is a good choice to store and schedule the report or call it via API to generate it and return it to your calling app.
    Incentivized
    Read full review
    ScreenShots

    iCharts Screenshots

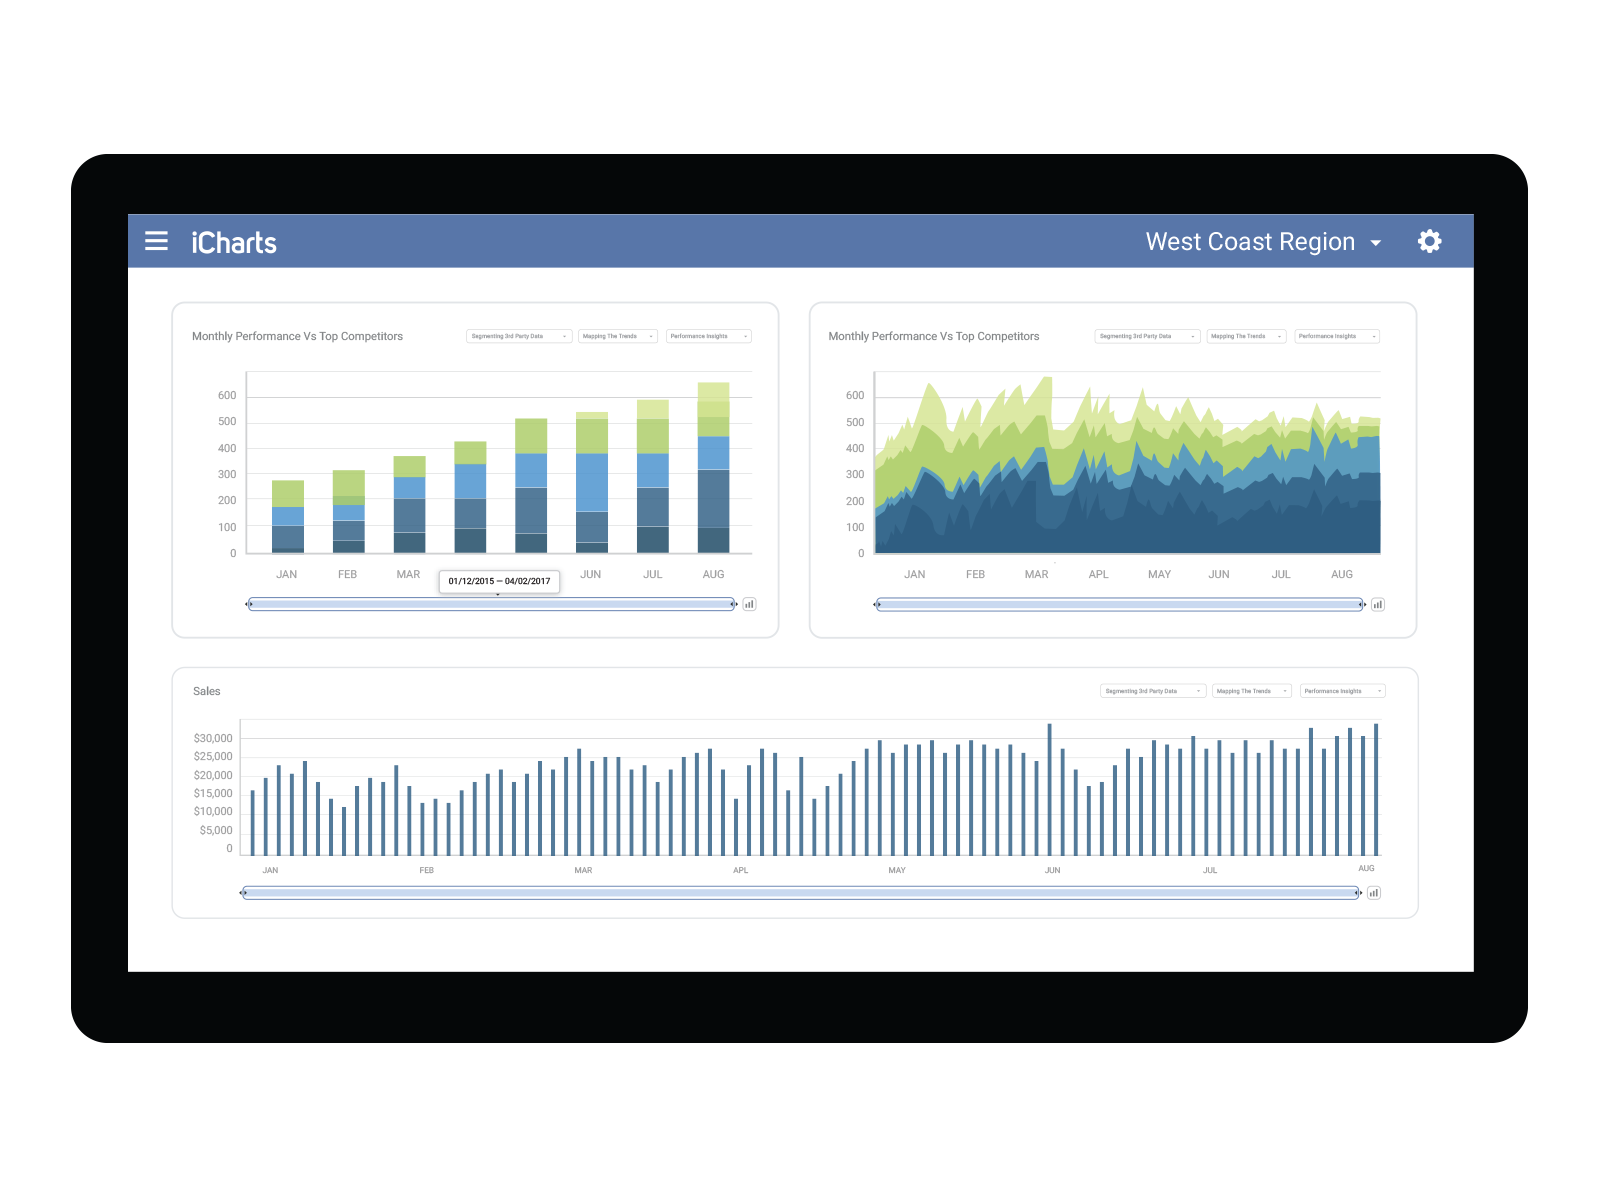
    Product screenshotProduct screenshot

    OpenText Magellan BI & Reporting Screenshots

    Screenshot of A Magellan dashboard that an individual can interact with and personalize to their needs, such as changing chart types or computations.Screenshot of An ad-hoc report being created through the Magellan Analytics Studio, a component of Magellan BI & Reporting.