The software will help you in growing your business and helps in achieving the business goal more faster through it.

Use Cases and Deployment Scope
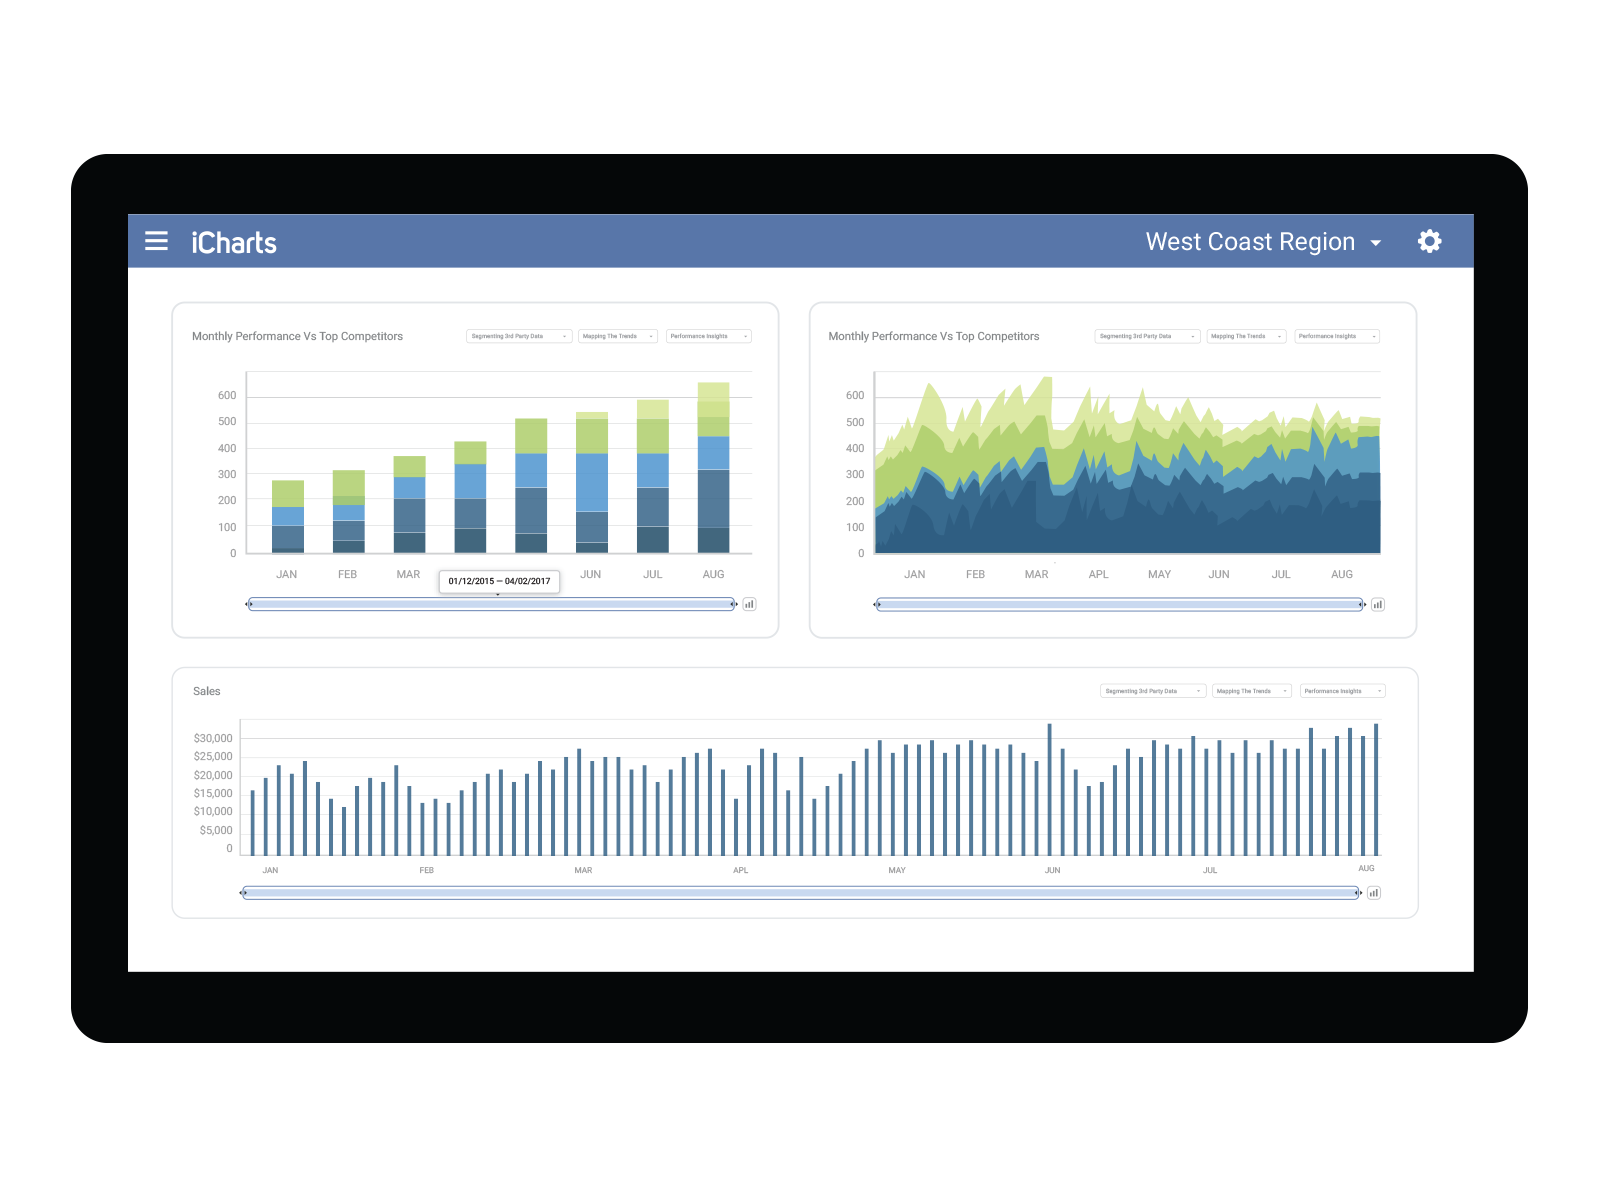
We use iCharts in our organization to represent the graph chart for our weekly, monthly, and annual reports and showcase the profit and loss of the business analytics. We didn't face any problems while using the product as it's feasible for us to represent the data through graphs and charts.
Pros
- It show Pie chart & Bar chart very clearly
- It represents the graph and chart in very clear process which is easily understandable.
- It represents the data in accurate manner
Cons
- You should add more chart option in it so that people would have more options
- There should be more color options so that each data can be classified separately
Return on Investment
- It has helped us in converting our clients into a conversion
- As it helped us in converting client easily by sharing the accurate data through charts.
- It has helped us in boostIng our ROI