JarviX vs. SAP Predictive Analytics
JarviX vs. SAP Predictive Analytics
| Product | Rating | Most Used By | Product Summary | Starting Price |
|---|---|---|---|---|
 JarviX | N/A | Synergies is a cognitive application service provider that combines business knowledge, artificial intelligence technology, and software development. Their mission is to help businesses through their digital transformation journey, become leaders and innovators in their industries by unlocking the power of data in the hands of business users and decision makers. Their product, JarviX, is an AnalyticOps Platform . JarviX uses NLP… | N/A | |
 SAP Predictive Analytics | N/A | SAP Predictive Analytics is, as the name would suggest, a statistical analysis and data mining platform that can be deployed with SAP HANA. | N/A |
| JarviX | SAP Predictive Analytics | |||||||||||||||
|---|---|---|---|---|---|---|---|---|---|---|---|---|---|---|---|---|
| Editions & Modules | No answers on this topic | No answers on this topic | ||||||||||||||
| Offerings |
| |||||||||||||||
| Entry-level Setup Fee | No setup fee | No setup fee | ||||||||||||||
| Additional Details | — | — | ||||||||||||||
| More Pricing Information | ||||||||||||||||
| JarviX | SAP Predictive Analytics |
|---|
| JarviX | SAP Predictive Analytics | ||||||||||||||||||
|---|---|---|---|---|---|---|---|---|---|---|---|---|---|---|---|---|---|---|---|
| BI Standard Reporting |
| ||||||||||||||||||
| Ad-hoc Reporting |
| ||||||||||||||||||
| Report Output and Scheduling |
| ||||||||||||||||||
| Data Discovery and Visualization |
| ||||||||||||||||||
| Access Control and Security |
| ||||||||||||||||||
| Mobile Capabilities |
|
| JarviX | SAP Predictive Analytics | |
|---|---|---|
| Small Businesses |  Yellowfin Score 8.7 out of 10 |  IBM SPSS Statistics Score 8.2 out of 10 |
| Medium-sized Companies |  Reveal Score 10.0 out of 10 |  Posit Score 10.0 out of 10 |
| Enterprises |  Kyvos Semantic Layer Score 9.5 out of 10 | Posit Score 10.0 out of 10 |
| All Alternatives | View all alternatives | View all alternatives |
| JarviX | SAP Predictive Analytics | |
|---|---|---|
| Likelihood to Recommend | 8.1 (2 ratings) | 9.0 (3 ratings) |
| Usability | 8.1 (2 ratings) | 6.0 (1 ratings) |
| Support Rating | 9.2 (2 ratings) | 7.0 (1 ratings) |
| JarviX | SAP Predictive Analytics | |
|---|---|---|
| Likelihood to Recommend | Synergies Intelligent Systems
| SAP
 Josh Anderson User Experience Manager |
| Pros | Synergies Intelligent Systems
| SAP
 Abdelhalim DADOUCHE Freelance Consultant |
| Cons | Synergies Intelligent Systems
| SAP
 Ali Kazempour Information Technology Adviser |
| Usability | Synergies Intelligent Systems
| SAP
Abdelhalim DADOUCHE Freelance Consultant |
| Support Rating | Synergies Intelligent Systems
| SAP
Abdelhalim DADOUCHE Freelance Consultant |
| Alternatives Considered | Synergies Intelligent Systems
| SAP
Josh Anderson User Experience Manager |
| Return on Investment | Synergies Intelligent Systems
| SAP
Ali Kazempour Information Technology Adviser |
| ScreenShots | JarviX Screenshots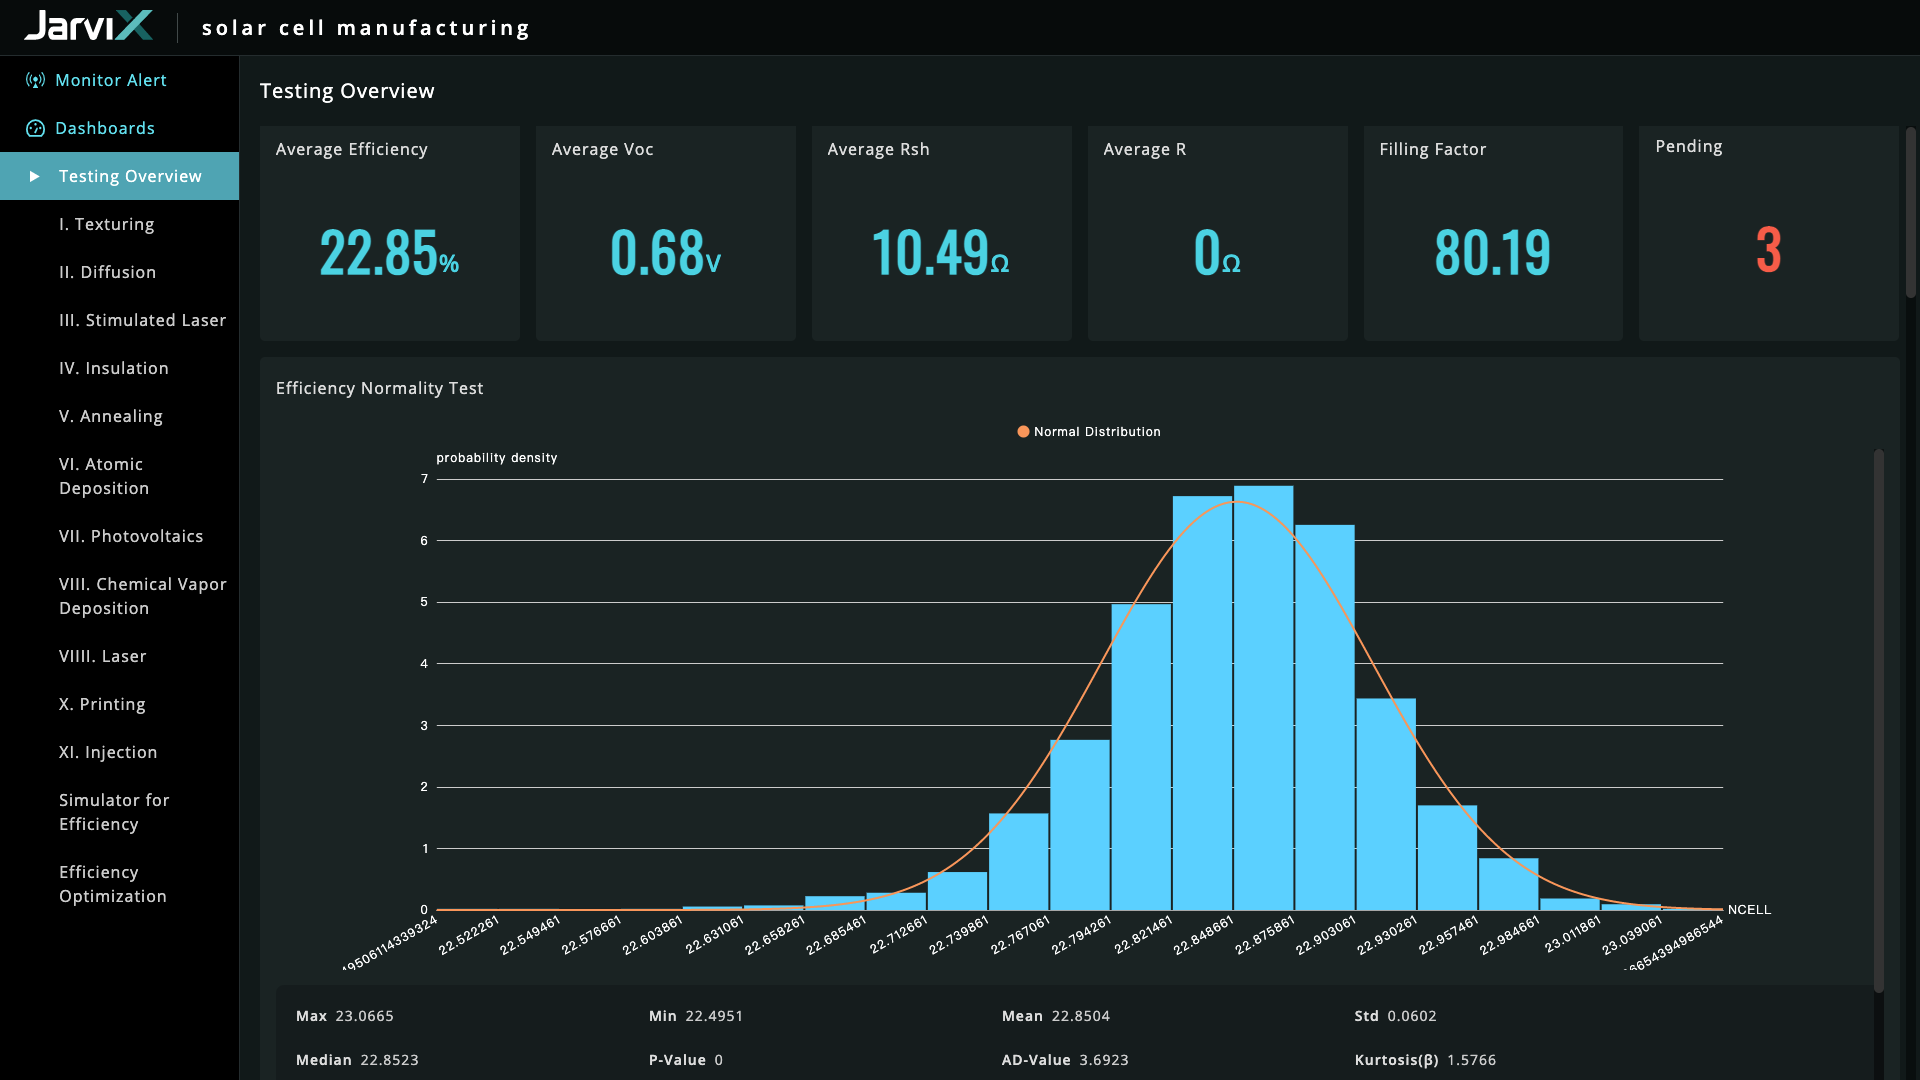   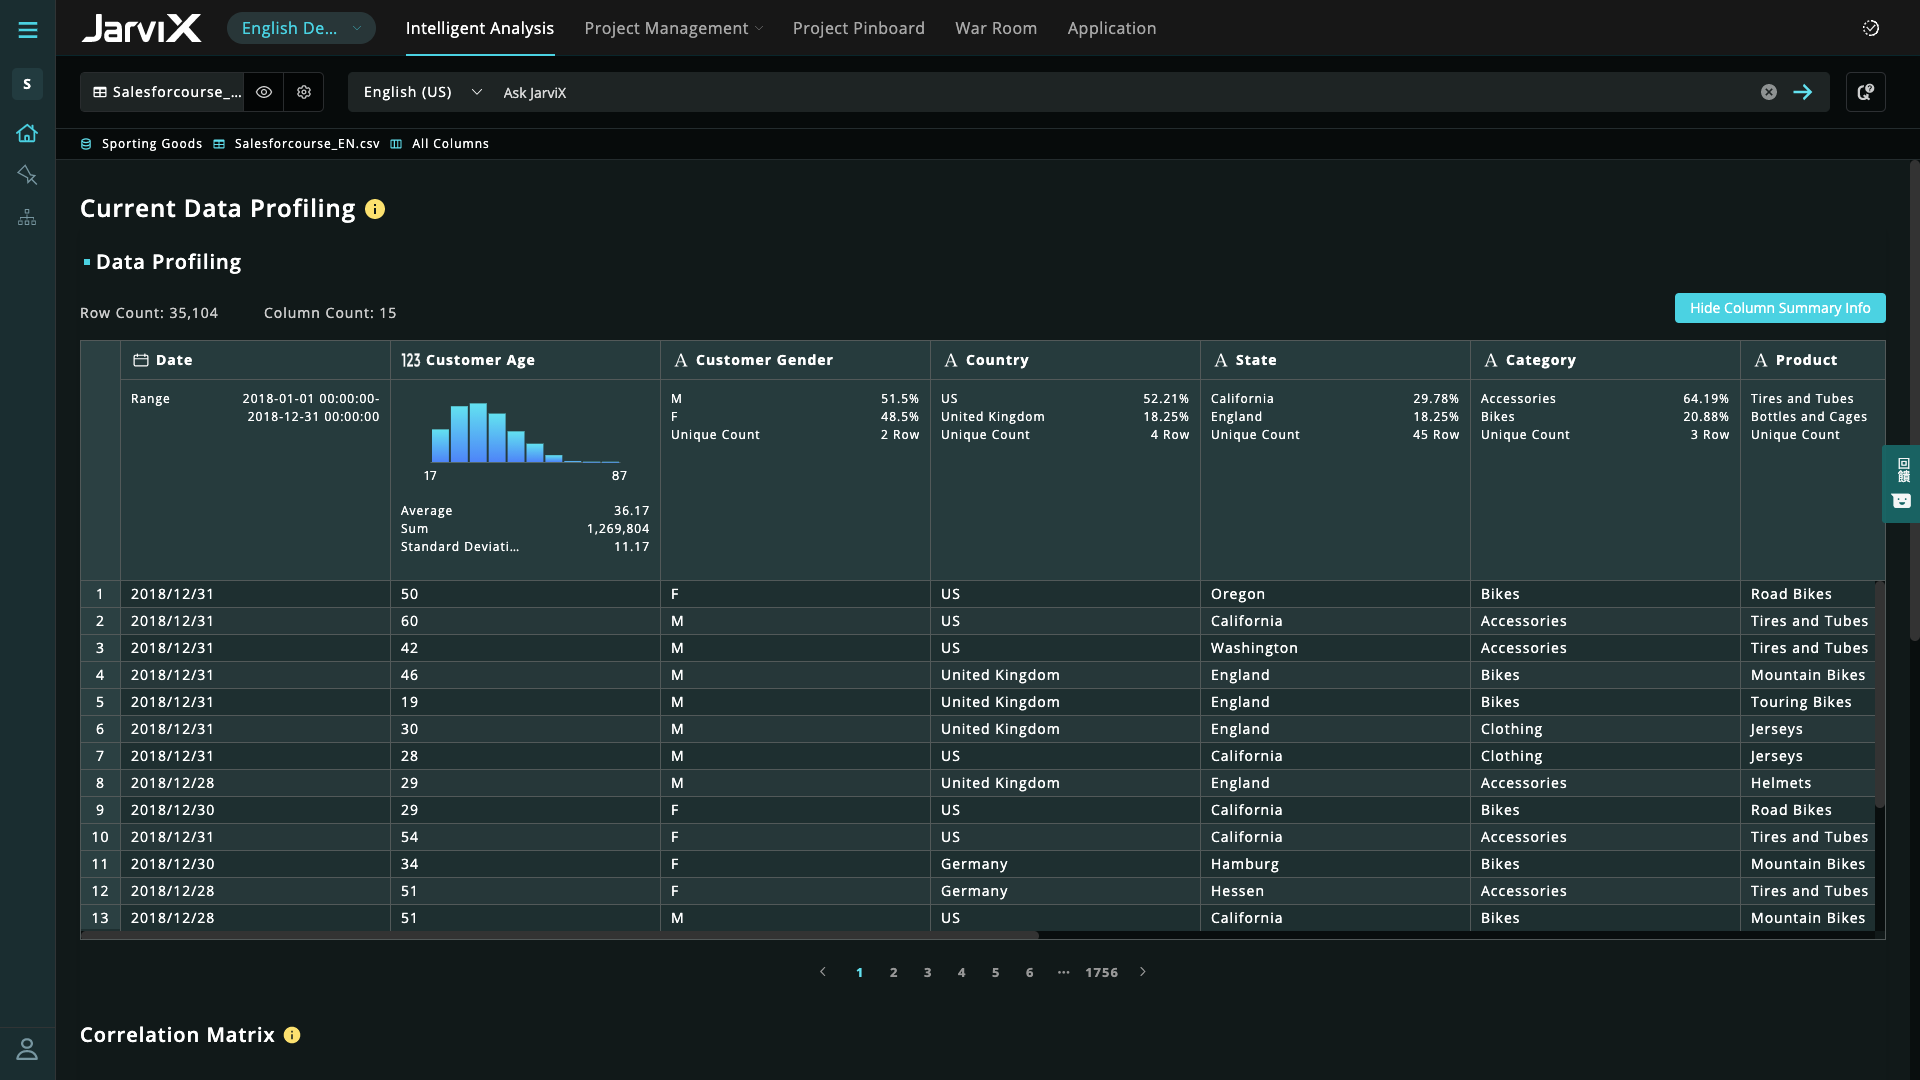   |