TrustRadius: an HG Insights company

JarviX

Score8.1 out of 10

2 Reviews and Ratings

What is JarviX?

Synergies is a cognitive application service provider that combines business knowledge, artificial intelligence technology, and software development.

Their mission is to help businesses through their digital transformation journey, become leaders and innovators in their industries by unlocking the power of data in the hands of business users and decision makers.

Their product, JarviX, is an AnalyticOps Platform .

JarviX uses NLP technology to simplify the input and output, so the user can ask data questions in a language and receive AI-generated answers. JarviX provides one unified experience from data management, AI data exploration, model management, visualization to no-code application builder, so users can save on integrating and operating costs.JarviX has been adopted and integrated into over 300 businesses such as Foxconn (global leader in smart manufacturing), Fuyao Glass (global leader in auto glass manufacturing), SF Express (leader of logistic service provider in China), Everlight (global leader in LED manufacturing), etc.

KEY FEATURES
Data Integration
  • No required training and don’t need programming background
  • Connectivity with Excel spreadsheets, text files (CSV), cloud services, on-premise databases(Microsoft SQL Server, Oracle, MySQL, PostgreSQL)
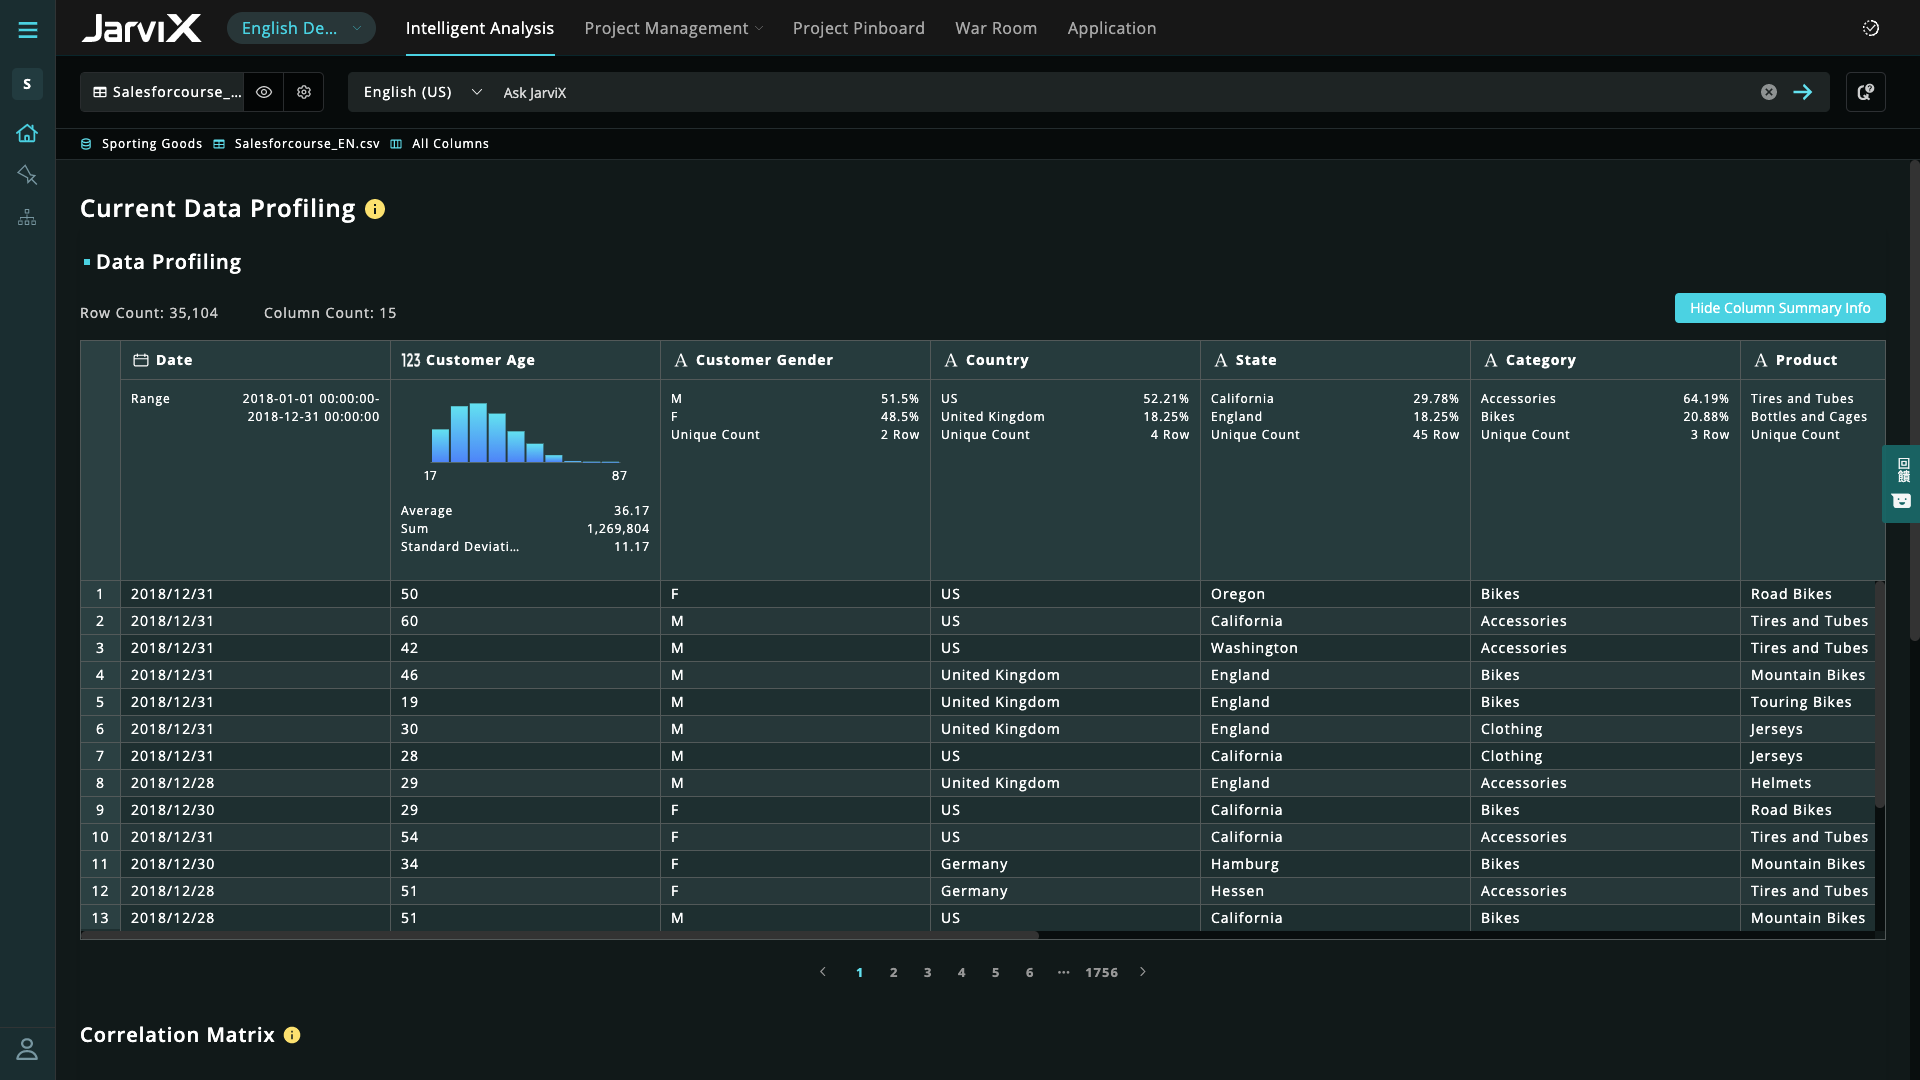
Data Preparation
  • Automated data type recognition
  • Custom column creation
  • Dataset relation function
  • Data type conversion without barrier, enable users to do different data analysis through JarviX

Data exploration and analysis
  • Natural language processing to support an intuitive data analysis experience
  • AI recommended charts and insights for faster and better results
  • Allow users to explore data through different visualizations of an answer with a range of supported charts(Bar chart, run chart, pie chart, etc)
Modeling
  • Automate model training through user questions for relation/difference analysis
  • Support Machine Learning through question for relation/difference analysis modeling
  • AutoML: A no-code way of building models by simply pull and click through recommendation of modeling factors and model performance interpretation
  • Support self-developed models using Python
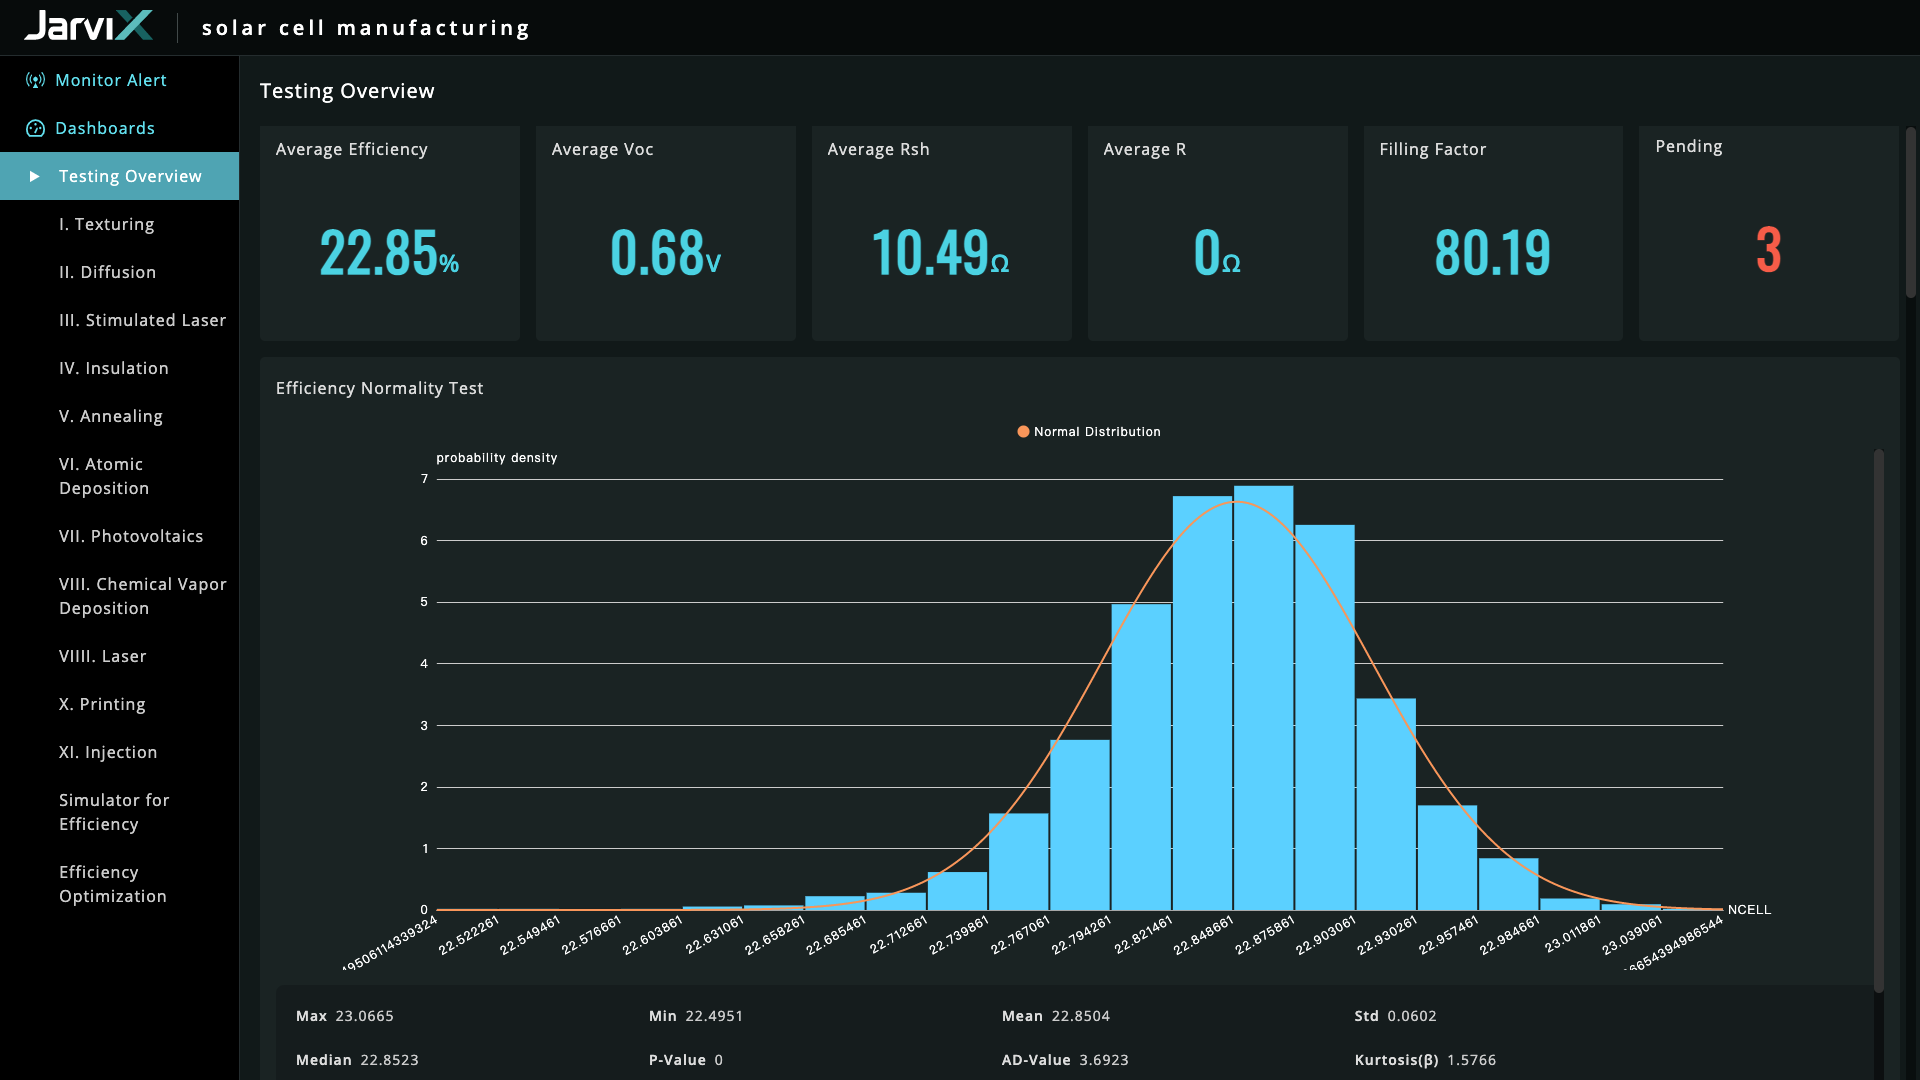
Visualization
  • Collaborative pinboard empowers better internal communication and management
  • Customizable dashboards allow users to monitor and receive alerts in real-time
  • Visualization of prediction results and verifications
  • AI generated alert history with incident details and recommended actions/solutions for faster management and optimization
  • Guided App Builder for non-technical business users. No coding background needed


Media

Screenshot of APPs
Screenshot of AutoML
Screenshot of Forecast
Screenshot of Home
Screenshot of Root Cause Analysis
Screenshot of War Room

1 / 6

Screenshot of APPs

Top Performing Features

  • Multi-User Support (named login)

    Named model access means that users have access based on name and password.

    Category average: 8.3

  • Integration with R or other statistical packages

    Integration with the open-source R predictive modeling environment.

    Category average: 7.3

  • Publish to Web

    Category average: 8

Areas for Improvement

  • Pre-built visualization formats (heatmaps, scatter plots etc.)

    Pre-built visualization formats are canned visualization types that can be selected to visualize different kinds of data.

    Category average: 7.9

  • Drill-down analysis

    Drill down analysis is the ability to get to a further level of detail by going deeper into the hierarchy.

    Category average: 8.2

  • Report Versioning

    Report versioning is the assignment of version numbers to each version of a report to help in tracking.

    Category average: 7.9

Excellent assistant to achieve digital transformation.

Pros

  • The algorithm platform is handy
  • Time-saving
  • Real-time data update
  • Database docking

Cons

  • There should be more flexibility in changing the data tables uploaded into JarviX. For example, it should enable users to edit the syntax of the table or change the data format of the columns without affecting the existing dashboard and charts already created using that data table.

Return on Investment

  • I think the best part of JarviX is that we can get the analysis results in several minutes. We spent lots of time making reports and managing our data in the past. All in all, it helps us save the time, cost, and labor of managing data.

Alternatives Considered

Microsoft Power BI

Usability

JarviX means empowerment for everyone

Pros

  • JarviX helps QC managers easily find out the significant factors when issues occur through data exploration. Based on these factors, they can build their own AI model by AutoML. They can resolve similar problems in the future quickly. This whole problem-solving process used to involve employees across IT, Data Science, and QC departments, now it can be done by the QC department themselves and much faster.

Cons

  • Most of our clients use BI tools, regardless of providers. We understand that eventually, tools that only display charts and graphs are going to be in the past. But for now, we still want to see how JarviX could be a great addition to BI, or how the two could work together to add value to companies’ analytics process.

Return on Investment

  • Better adoption rate. On the operation end, there used to be no one that is directly involved in the production end of analytics, now the adoption rate of data tool JarviX has raised to 40% of the employees across all departments.
  • 10X Faster data decision-making. One of our clients used to need up to 2 weeks to recalibrate their manufacturing planning when there’s a new order. Now, it takes only 10 minutes.

Usability