TrustRadius: an HG Insights company

Lightning Tools Data Viewer vs. Orbit Reporting and Analytics

Save this comparison

Save this comparison

Add Product

Recommended Comparisons

    Overview
    ProductRatingMost Used ByProduct SummaryStarting Price

    Lightning Tools Data Viewer

    Score9.1 out of 10
    Mid-Size Companies (51-1,000 employees)
    The Data Viewer provides data visualization in the form of reports or charts that can be created and customized to suit a business's needs. Silos of data exist in most organizations and yet contain valuable insights into how well the organization is performing and where action is needed. Those silos often include Microsoft Excel workbooks, Microsoft SQL Azure databases, On-Premises data sources accessible through OData or Business Connectivity Services and even SharePoint Lists. These data…

    $2,200

    per year per installation

    Orbit Reporting and Analytics

    Score6 out of 10
    N/AOrbit Reporting + Analytics is a self-service reporting and BI solution for all ERP, Custom and Cloud applications from the company of the same name in Alpharetta. Orbit integrates with ERP and key business applications, providing access to real-time data from all data sources -- empowering business users to build interactive reports, charts, and dashboards.N/A
    Pricing
    Lightning Tools Data ViewerOrbit Reporting and Analytics
    Editions & Modules
    Data Viewer OnPrem
    $1,000
    per year Per installation, 1 x WFE
    Data Viewer Online
    $2,200
    per year per installation
    Data Viewer OnPrem Enterprise Edition
    POA
    per year Per installation, 4+ WFE
    Data Viewer Online Enterprise Edition
    POA
    per year per installation
    No answers on this topic
    Offerings
    Pricing Offerings
    Lightning Tools Data ViewerOrbit Reporting and Analytics
    Free Trial
    YesNo
    Free/Freemium Version
    NoNo
    Premium Consulting/Integration Services
    YesNo
    Entry-level Setup FeeNo setup feeNo setup fee
    Additional DetailsPrices stated are minimum per installation for "stock" products. $2.20 per user / year on top of base price. Enterprise editions can be amended to suit business needs if deemed necessary, additional costs incurred and TBD. All packages include free technical support. Free upgrades available to latest versions of tool as they are released. (online version)—
    More Pricing Information
    Features
    Lightning Tools Data ViewerOrbit Reporting and Analytics
    BI Standard Reporting
    Comparison of BI Standard Reporting features of Lightning Tools Data Viewer and Orbit Reporting and Analytics
    Feature
    Lightning Tools Data Viewer
    9.1
    1 Ratings
    12% above category average
    Orbit Reporting and Analytics
    5.7
    2 Ratings
    36% below category average
    Customizable dashboards9.11 Ratings6.02 Ratings
    Report Formatting Templates9.11 Ratings5.02 Ratings
    Pixel Perfect reports00 Ratings6.02 Ratings
    Ad-hoc Reporting
    Comparison of Ad-hoc Reporting features of Lightning Tools Data Viewer and Orbit Reporting and Analytics
    Feature
    Lightning Tools Data Viewer
    8.2
    1 Ratings
    5% above category average
    Orbit Reporting and Analytics
    6.5
    2 Ratings
    21% below category average
    Drill-down analysis6.41 Ratings6.02 Ratings
    Formatting capabilities9.11 Ratings6.02 Ratings
    Report sharing and collaboration9.11 Ratings6.02 Ratings
    Integration with R or other statistical packages00 Ratings8.02 Ratings
    Data Discovery and Visualization
    Comparison of Data Discovery and Visualization features of Lightning Tools Data Viewer and Orbit Reporting and Analytics
    Feature
    Lightning Tools Data Viewer
    3.6
    1 Ratings
    73% below category average
    Orbit Reporting and Analytics
    6.7
    2 Ratings
    18% below category average
    Pre-built visualization formats (heatmaps, scatter plots etc.)3.61 Ratings7.02 Ratings
    Location Analytics / Geographic Visualization00 Ratings6.02 Ratings
    Predictive Analytics00 Ratings7.02 Ratings
    Report Output and Scheduling
    Comparison of Report Output and Scheduling features of Lightning Tools Data Viewer and Orbit Reporting and Analytics
    Feature
    Lightning Tools Data Viewer
    -
    Ratings
    Orbit Reporting and Analytics
    6.0
    2 Ratings
    31% below category average
    Publish to Web00 Ratings6.02 Ratings
    Publish to PDF00 Ratings6.02 Ratings
    Report Versioning00 Ratings6.02 Ratings
    Report Delivery Scheduling00 Ratings6.02 Ratings
    Delivery to Remote Servers00 Ratings6.02 Ratings
    Access Control and Security
    Comparison of Access Control and Security features of Lightning Tools Data Viewer and Orbit Reporting and Analytics
    Feature
    Lightning Tools Data Viewer
    -
    Ratings
    Orbit Reporting and Analytics
    5.8
    2 Ratings
    38% below category average
    Multi-User Support (named login)00 Ratings5.02 Ratings
    Role-Based Security Model00 Ratings6.02 Ratings
    Multiple Access Permission Levels (Create, Read, Delete)00 Ratings5.02 Ratings
    Single Sign-On (SSO)00 Ratings7.02 Ratings
    Mobile Capabilities
    Comparison of Mobile Capabilities features of Lightning Tools Data Viewer and Orbit Reporting and Analytics
    Feature
    Lightning Tools Data Viewer
    -
    Ratings
    Orbit Reporting and Analytics
    7.0
    2 Ratings
    10% below category average
    Responsive Design for Web Access00 Ratings6.02 Ratings
    Mobile Application00 Ratings5.02 Ratings
    Dashboard / Report / Visualization Interactivity on Mobile00 Ratings9.01 Ratings
    Application Program Interfaces (APIs) / Embedding
    Comparison of Application Program Interfaces (APIs) / Embedding features of Lightning Tools Data Viewer and Orbit Reporting and Analytics
    Feature
    Lightning Tools Data Viewer
    -
    Ratings
    Orbit Reporting and Analytics
    6.0
    2 Ratings
    26% below category average
    REST API00 Ratings6.02 Ratings
    Javascript API00 Ratings6.02 Ratings
    iFrames00 Ratings6.02 Ratings
    Java API00 Ratings6.02 Ratings
    Themeable User Interface (UI)00 Ratings6.02 Ratings
    Customizable Platform (Open Source)00 Ratings6.02 Ratings
    Best Alternatives
    Lightning Tools Data ViewerOrbit Reporting and Analytics
    Small Businesses
    Chartio (discontinued)
    Score7.5 out of 10
    Cyfe
    Score4 out of 10
    Medium-sized Companies
    Jet Reports
    Score9.5 out of 10
    Qlik Cloud Analytics (Qlik Sense)
    Score8.1 out of 10
    Enterprises
    Kibana
    Score8.4 out of 10
    Sisense
    Score6.9 out of 10
    All AlternativesView all alternativesView all alternatives
    User Ratings
    Lightning Tools Data ViewerOrbit Reporting and Analytics
    Likelihood to Recommend
    9.1
    (1 ratings)
    6.0
    (2 ratings)
    Usability
    -
    (0 ratings)
    7.0
    (2 ratings)
    Support Rating
    -
    (0 ratings)
    3.0
    (1 ratings)
    Data Sharing and Collaboration
    -
    (0 ratings)
    9.0
    (1 ratings)
    Data Sources
    -
    (0 ratings)
    8.0
    (1 ratings)
    User Testimonials
    Lightning Tools Data ViewerOrbit Reporting and Analytics
    Likelihood to Recommend
    Lightning Tools
    Lightning Tools Data Viewer is well suited for re-surfacing data and customizing its look and feel.
    Read full review
    Orbit Reporting + Analytics
    It is very good for analytics and performs precisely well under the feature of data reporting. The gigantic amount of data that can be fed into the system and can be read and understood well, and also analytics can be performed well under the tools that the platform presents. Overall it is a decent product.
    Incentivized
    Read full review
    Pros
    Lightning Tools
    • Shows Lists created on different sites to be seen and controlled on another site in a Tenant
    • Allows selection of layouts and coloring way beyond what other programs do.
    • Easy to learn and very functional.
    Read full review
    Orbit Reporting + Analytics
    • User-Friendly
    • Results-Driven
    • Aesthetically Pleasing
    Incentivized
    Read full review
    Cons
    Lightning Tools
    • Data Viewer has a graph feature that is old school flat design. We loved the In House real 3D graph Lightning Tools program.
    Read full review
    Orbit Reporting + Analytics
    • Sometimes it becomes difficult as to how to go about a particular function
    • Lagging
    • Unclear User Interface
    Incentivized
    Read full review
    Usability
    Lightning Tools
    No answers on this topic
    Orbit Reporting + Analytics
    ORBIT is so incredibly user-friendly. It makes things so much easier and it makes them go so much quicker.
    Incentivized
    Read full review
    Support Rating
    Lightning Tools
    No answers on this topic
    Orbit Reporting + Analytics
    I never had a chance to work with the support team for Orbit Reporting and Analytics, hence cannot really comment here.
    Incentivized
    Read full review
    Alternatives Considered
    Lightning Tools
    Lightning Tools Data Viewer is much easier and more powerful than Infowise similar viewer in their lineup. In this case, we use Data Viewer over the one offered by Infowise.
    Read full review
    Orbit Reporting + Analytics
    It provides a wide range of functionalities that are absent in the other platform. There are a large number of customizable services offered. It is very user-friendly and output-driven which makes it easier to interpret. It also supports ad-hoc reporting and data stories in an easier manner and format which makes it easier to use for users who are just beginners.
    Incentivized
    Read full review
    Return on Investment
    Lightning Tools
    • It allows us to do things that would take a great deal more time to duplicate in SharePoint
    • It cuts down on ugly looking built in SP list layouts
    • Users find it easy to access, thus this product is more productive
    Read full review
    Orbit Reporting + Analytics
    • Good reporting
    • Better Analytics
    • Enhanced decision making abilities
    Incentivized
    Read full review
    ScreenShots

    Lightning Tools Data Viewer Screenshots
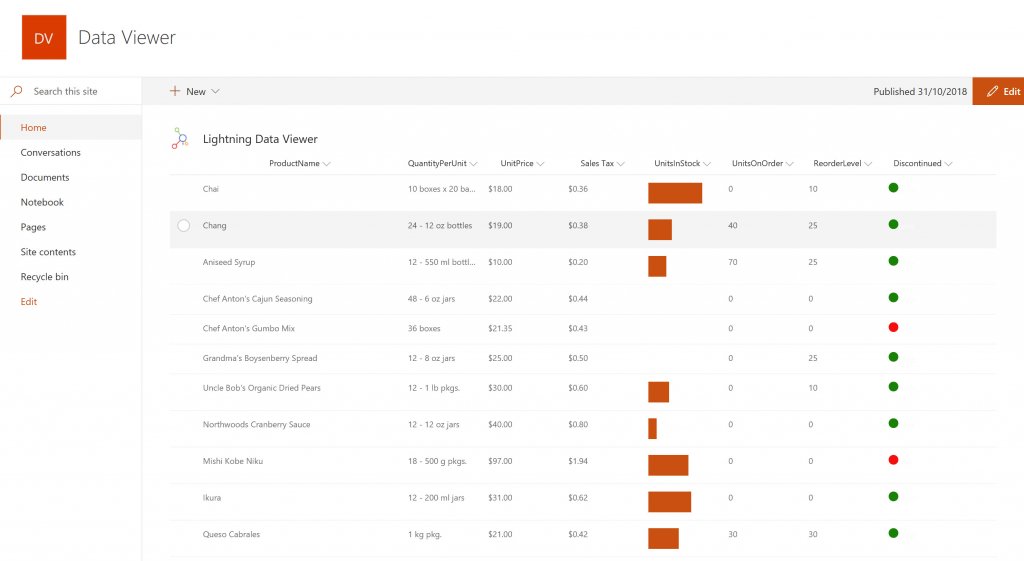
    Screenshot of DISPLAYING EXTERNAL DATA WITHIN SHAREPOINT OR MICROSOFT TEAMS
The Data Viewer Client Side Web Part can be configured by Business Users within a few minutes to display Line of Business Data from Data Sources such as Excel,  SQL Azure, Business Connectivity Services, OData and SharePoint Lists.  Connections to an organizations data such as Customer Relationship Management Systems, Accounting Systems, or Custom Databases can be connected, giving business users a live up-to-date view of business information within the context of their SharePoint Team Sites or Microsoft Teams Tabs.Screenshot of HIGHLIGHTING KEY BUSINESS DATA (NO CODE)
Conditional formatting can be used to highlight key business data. Overdue Tasks, Low Stock, Currency Exchange Rates, Sales Revenue are examples of data to highlight visually allowing for a quick reaction time. Key Financial Indicators and Key Performance Indicators can be configured with a simple dialog and no need to write any code. Choose colours, icons or data bars to highlight key data.Screenshot of SELECTING AND STYLING ICONS
Icons can be chosen as part of the conditional formatting to make data stand out. The Office 365 Fabric icons can be selected and styled and applied to cell values. Pepper pots, Smileys, Envelopes and more icons are available. There are hundreds of options to choose from to highlight data that needs to be acted upon.Screenshot of DATA VIEWER CAN BE A GRID OF DATA OR A CHART IN SHAREPOINT OR MICROSOFT TEAMS
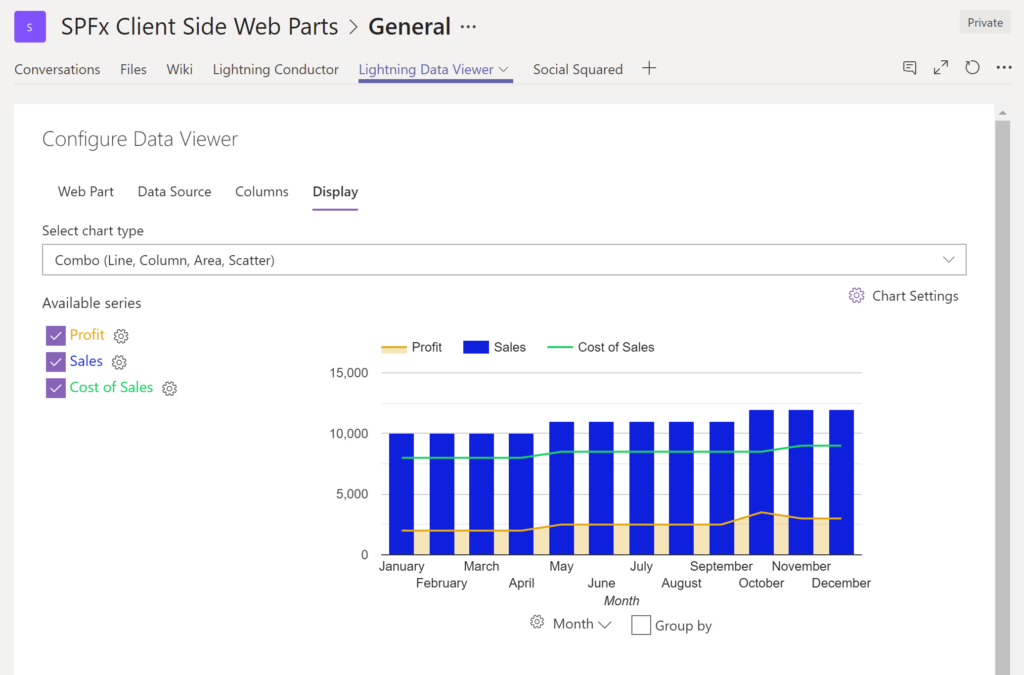
The Data Viewer can be used within Microsoft SharePoint Modern Sites or Microsoft Teams Tabs as a Grid of Data with styling or as a Chart which can be configured. The Charting Feature allows for Pie, Donut, Column, Line, Area, and Scatter Charts which can all be configured and displayed in 2D or 3D.Screenshot of TREEMAPS
summary information can be displayed within a TreeMap next to the detail. Users will be able to see trends, and how the business is performing  using the TreeMap view of data.Screenshot of CHARTS AND GAUGES
The Data Viewer is used to represent data in multiple ways using Gauges, TreeMaps, Multiple Series Charts, and Pie Charts.