ActiveReports vs. Webix UI

Overview
ProductRatingMost Used ByProduct SummaryStarting Price
ActiveReports
Score 0.0 out of 10
N/A
ActiveReports line of products is a complete developer reporting solution for both .NET and JavaScript. Users can deliver interactive reports with its designers and rich controls.
$899
per year
Webix UI
Score 8.7 out of 10
N/A
Webix is a multi-widget JavaScript UI library for developing HTML5 and CSS3 compatible mobile and desktop web apps. It provides over 90 feature rich UI widgets for data management, visualization, uploading, building layouts and editing. The components enable users to build web apps that will run properly not only on personal computers but also on iOS, Android and Windows touch devices. Webix offers simple JQuery, Angular and Vue.js integration and can work with any server-side platform,…
$848
Pricing
ActiveReportsWebix UI
Editions & Modules
ActiveReports.NET Standard
$899
per year per developer
ActiveReports.NET Professional
$1399
per year per developer
Custom License
$848
Company Pack
$2499.00
one project, unlimited developers
DevTeam Pack
$3999.00
unlimited projects, 5+ developers
Unlim Pack
$9499.00
unlimited projects unlimited developers
Offerings
Pricing Offerings
ActiveReportsWebix UI
Free Trial
YesYes
Free/Freemium Version
NoYes
Premium Consulting/Integration Services
NoYes
Entry-level Setup FeeNo setup feeNo setup fee
Additional Details
More Pricing Information
Community Pulse
ActiveReportsWebix UI
Best Alternatives
ActiveReportsWebix UI
Small Businesses
Syncfusion Essential Studio
Score 6.6 out of 10
Syncfusion Essential Studio
Score 6.6 out of 10
Medium-sized Companies
React (React.js)
React (React.js)
Score 8.8 out of 10
React (React.js)
React (React.js)
Score 8.8 out of 10
Enterprises
React (React.js)
React (React.js)
Score 8.8 out of 10
React (React.js)
React (React.js)
Score 8.8 out of 10
All AlternativesView all alternativesView all alternatives
User Ratings
ActiveReportsWebix UI
Likelihood to Recommend
-
(0 ratings)
9.0
(3 ratings)
Support Rating
-
(0 ratings)
8.0
(1 ratings)
User Testimonials
ActiveReportsWebix UI
Likelihood to Recommend
MESCIUS
No answers on this topic
XB Software Ltd.
If you need to create an interactive data report, optimize a workflow, handle hierarchical data or make calculations in a powerful spreadsheet, you will find a proper widget for your needs in the Webix UI library. If we want to display data in various forms Webix UI layouts and widget help to organize a web page and define its overall look-and-feel.
Read full review
Pros
MESCIUS
No answers on this topic
XB Software Ltd.
  • The Kanban Control allowed to implement a compelling task management system with little effort.
  • The Chart Control made it easy to create our dashboard and it was a lot easier than using D3js as we did before. D3 allows a lot more flexibility but it takes often 10 times longer to get a chart done than using Webix.
  • Support at Webix is very helpful and responsive.
Read full review
Cons
MESCIUS
No answers on this topic
XB Software Ltd.
  • None at the moment
Read full review
Support Rating
MESCIUS
No answers on this topic
XB Software Ltd.
Webix UI is a cross-browser, cross-device JavaScript framework which makes it easy to build a complex Web UI. Most features work as expected. While working with large datasets, you can load data dynamically to reduce complexity and improve performance. It provides a set of integration extensions that allow you to add third-party tools into an application.
Read full review
Alternatives Considered
MESCIUS
No answers on this topic
XB Software Ltd.
React was too time consuming. Kendo was another good one, but more expensive and seemed less responsive. [Sencha's] demo didn't seem to justify the price.
Read full review
Return on Investment
MESCIUS
No answers on this topic
XB Software Ltd.
  • It saved us 1000s of USD for just using the Kanban Board instead of developing it from scratch.
Read full review
ScreenShots

ActiveReports Screenshots

Screenshot of a C# .NET reporting tool, which is a software component used for data consolidation and visualization within the Visual Studio IDE.Screenshot of a JavaScript reporting tool, which is a set of web components used for data consolidation and visualization.Screenshot of an example interactive report that allows a reader to navigate back and forth between the main report and a sequence of subreports by clicking parametrized links.Screenshot of a full-featured report viewer that can be integrated into a Blazor application. It is customizable with its API.

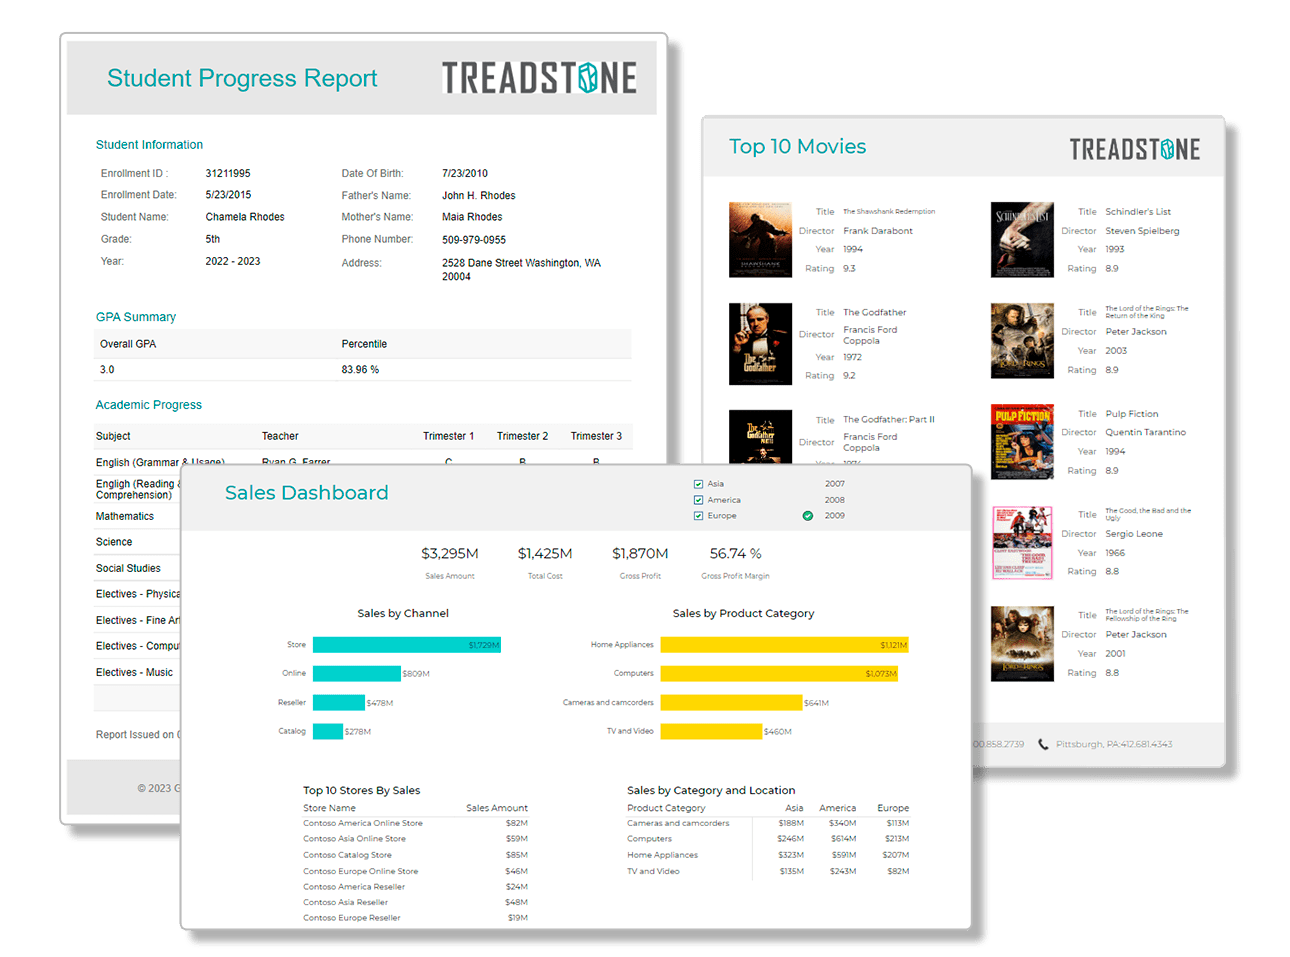
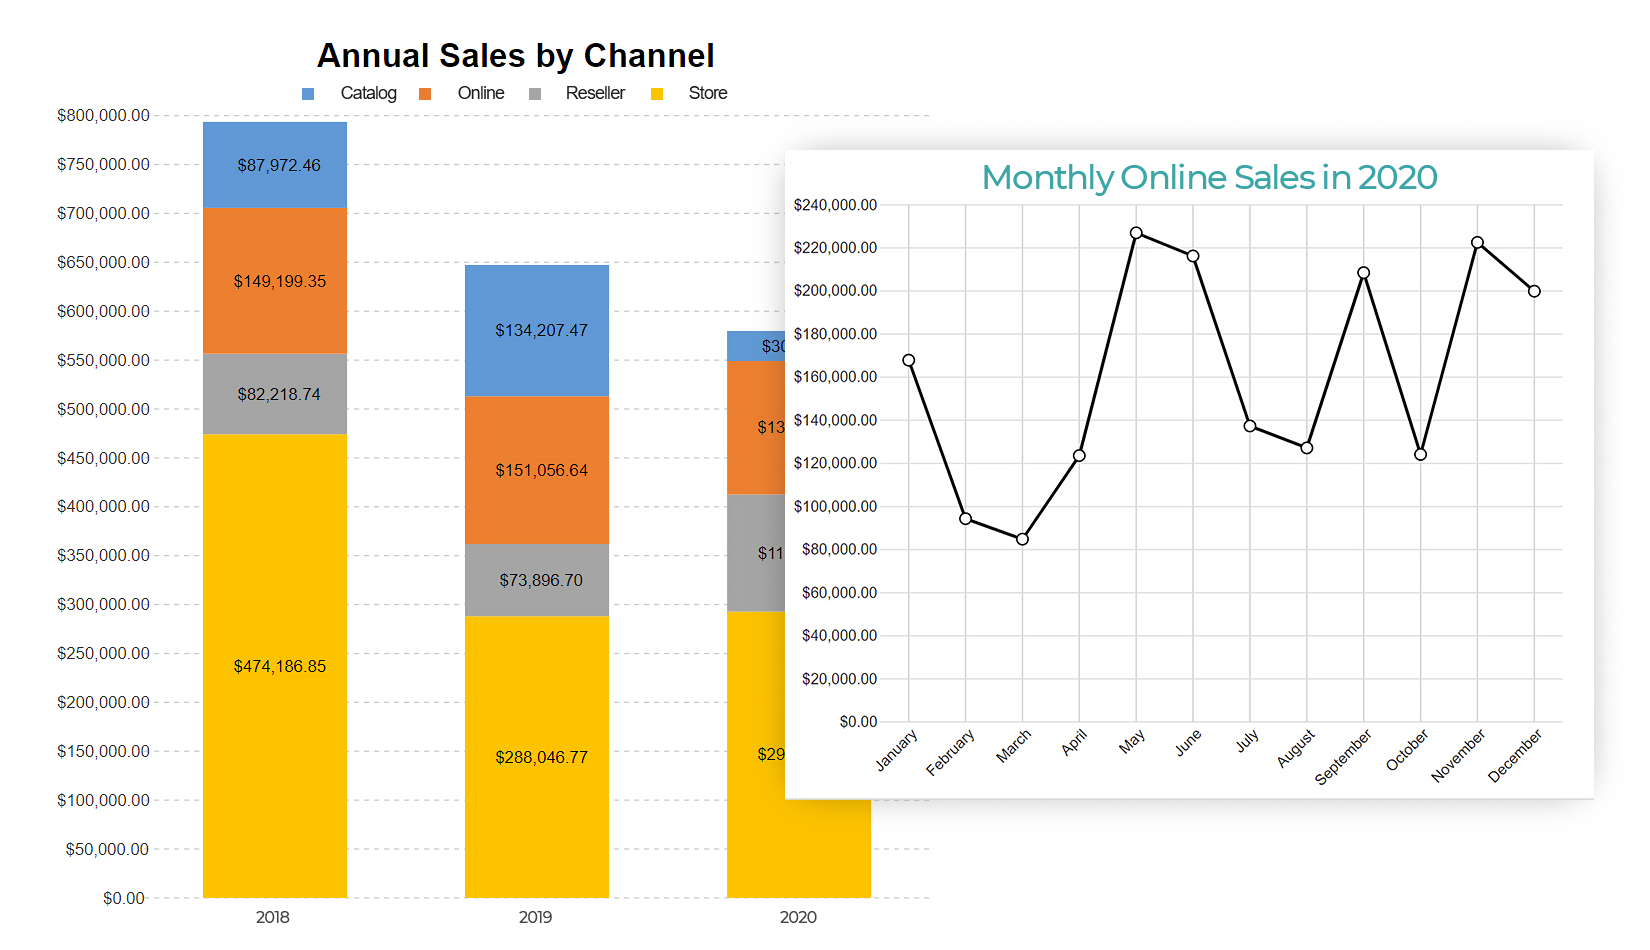
Webix UI Screenshots
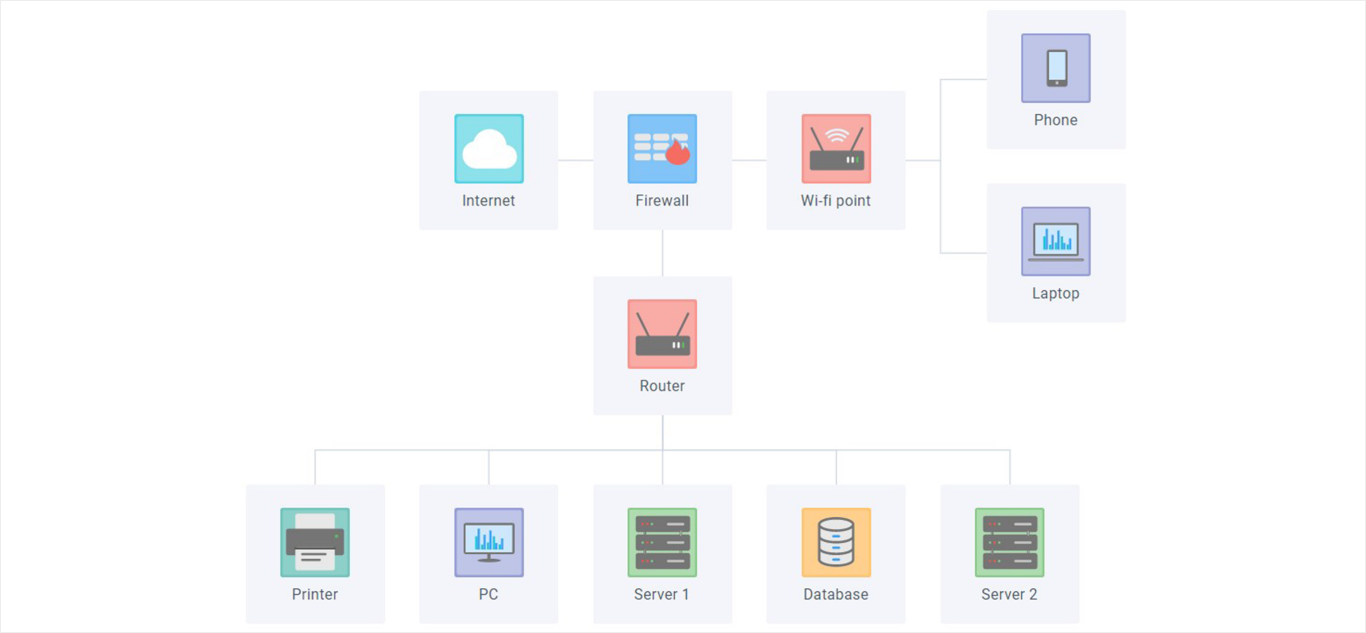
Screenshot of Chat / Messenger - JavaScript widget for web communicationScreenshot of Javascript Diagram LibraryScreenshot of JavaScript Document Manager widget for web developmentScreenshot of JavaScript File Manager, HTML5 UI web widgetScreenshot of Gantt Chart: JavaScript online project management applicationScreenshot of Kanban JavaScript UI widget or Tasks Management Board