BlueOptima vs. minware
BlueOptima vs. minware
| Product | Rating | Most Used By | Product Summary | Starting Price |
|---|---|---|---|---|
 BlueOptima | N/A | BlueOptima's analytics platform is designed to empower software developers and their companies to create better software in the most time- and cost-efficient way. BlueOptima provides insight based on objective software developer productivity metrics: Actual Coding Effort. | N/A | |
 minware | N/A | minware's software development observability platform is a fully managed system that ingests, enriches, and integrates development data so users can generate virtually any report they envision in minutes. The service provides automated insights to enhance software process maturity, productivity, predictability, and quality. With minware’s template library, the user can view and customize reports used by other leaders to manage their teams, or create custom reports using the indata… | $0 core features for 1-5 contributors |
| BlueOptima | minware | |||||||||||||||
|---|---|---|---|---|---|---|---|---|---|---|---|---|---|---|---|---|
| Editions & Modules | No answers on this topic |
| ||||||||||||||
| Offerings |
| |||||||||||||||
| Entry-level Setup Fee | No setup fee | No setup fee | ||||||||||||||
| Additional Details | — | — | ||||||||||||||
| More Pricing Information | ||||||||||||||||
| BlueOptima | minware | |
|---|---|---|
| Small Businesses |  PyCharm Score 9.2 out of 10 |  InfluxDB Score 8.8 out of 10 |
| Medium-sized Companies | PyCharm Score 9.2 out of 10 |  Sumo Logic Score 8.8 out of 10 |
| Enterprises | PyCharm Score 9.2 out of 10 |  NetBrain Technologies Score 8.8 out of 10 |
| All Alternatives | View all alternatives | View all alternatives |
| BlueOptima | minware | |
|---|---|---|
| ScreenShots | minware Screenshots  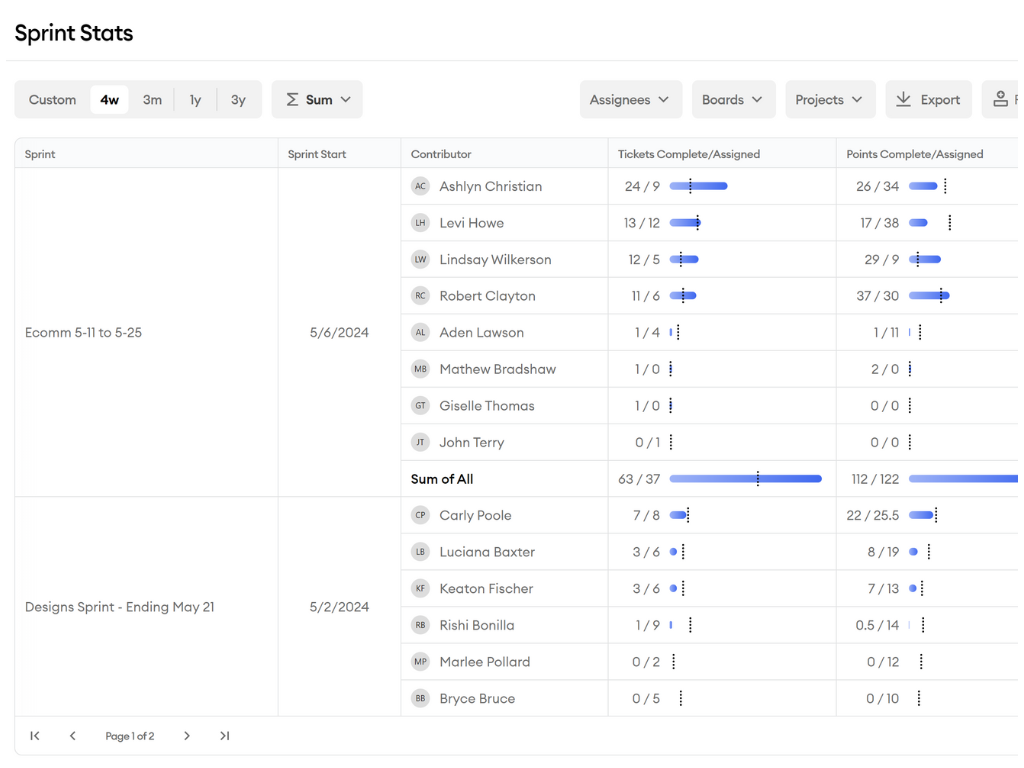   |