
What is Zebra BI?
Zebra BI offers a way to create reports and dashboards with visualization tools. Its out-of-the-box tools for reports enables users to deliver real insights from their data, with reports set up in minutes by importing Zebra BI into Power BI or Excel.
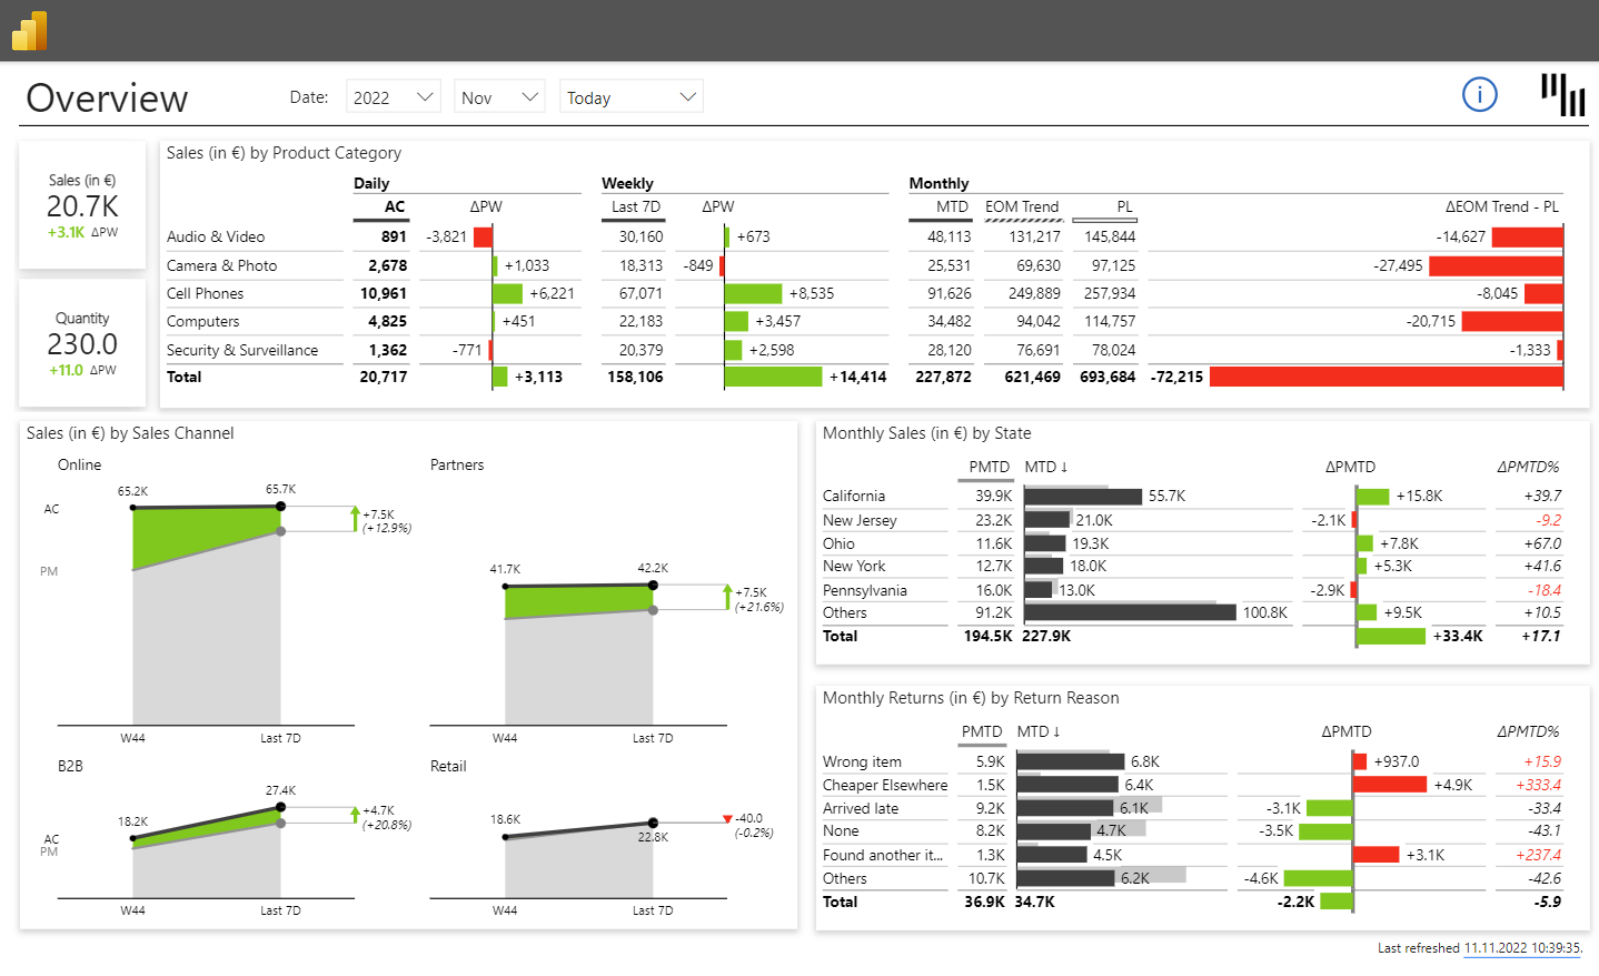
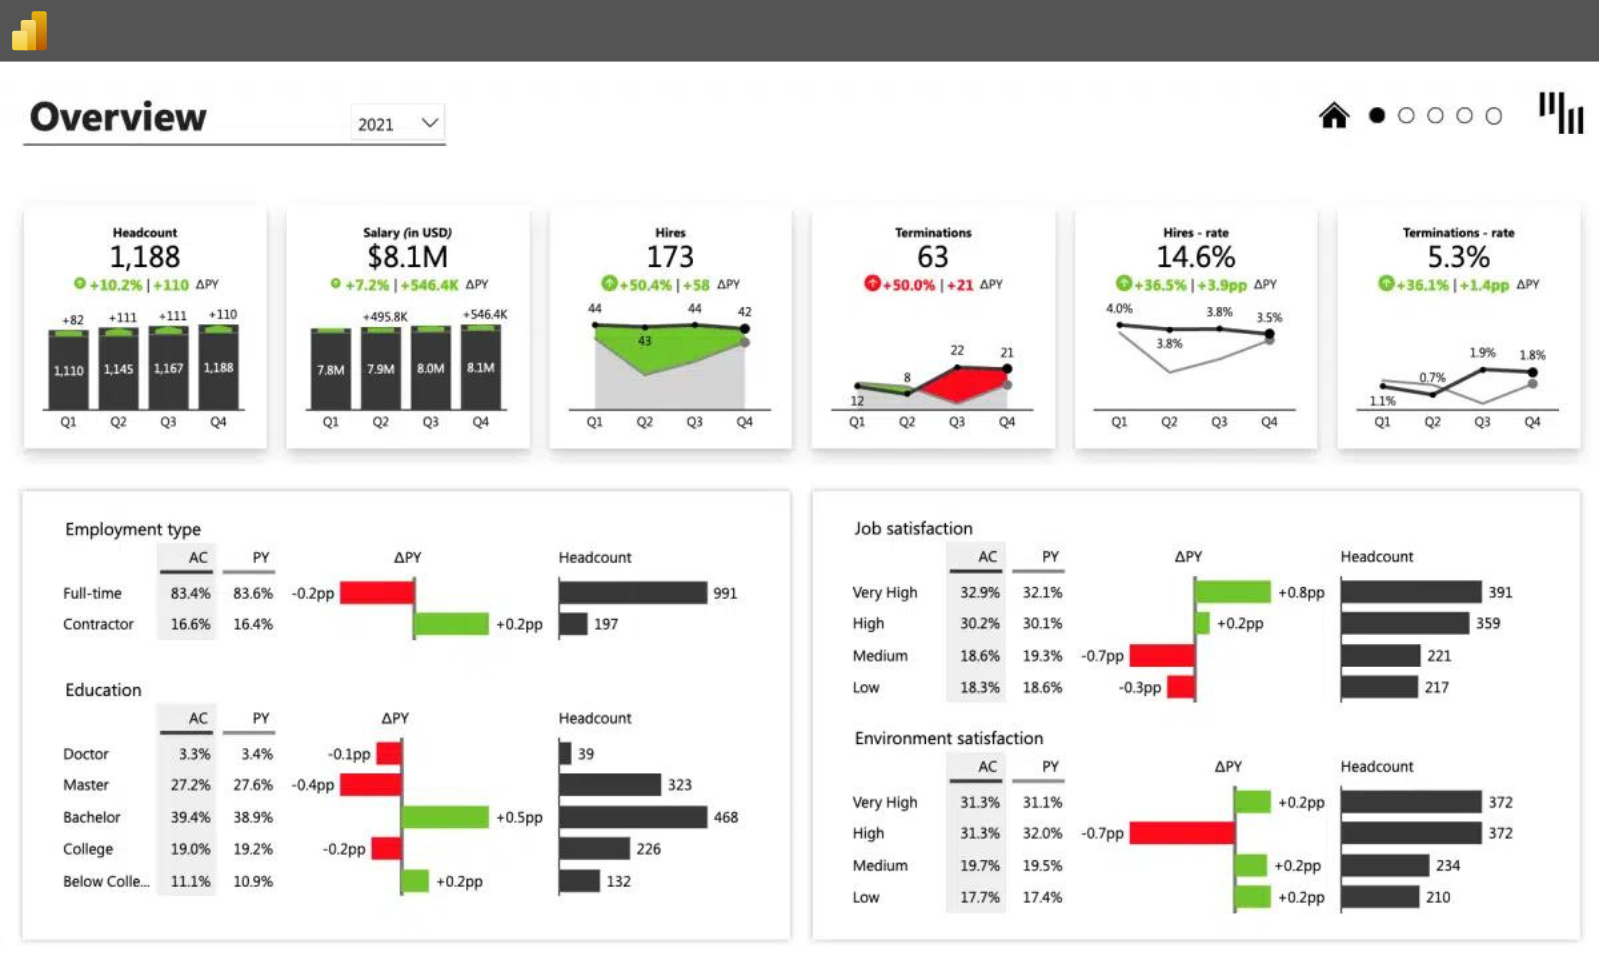
It is used to create understandable and actionable business reports and dashboards. Zebra BI visuals will provide an overview of how a business is performing but also put the data into perspective. By using advanced functionalities like dynamic comments, focus mode, scaling groups, or drill-through, users can see numbers in context and thus get a better insight into overall performance.
Zebra BI is used to visualize data in seconds and get a complete overview of business performance with YoY growth rates, comparisons to PL, PY, or FC, variances, and more, out of the box. Zebra BI ultimately helps to simplify data models and shorten report development cycles.
It is available via a free trial.
Categories & Use Cases
Media
1 / 2