Amazon CloudWatch is a native AWS monitoring tool for AWS programs. It provides data collection and resource monitoring capabilities.
$0
per canary run
SonarQube
Score 8.1 out of 10
N/A
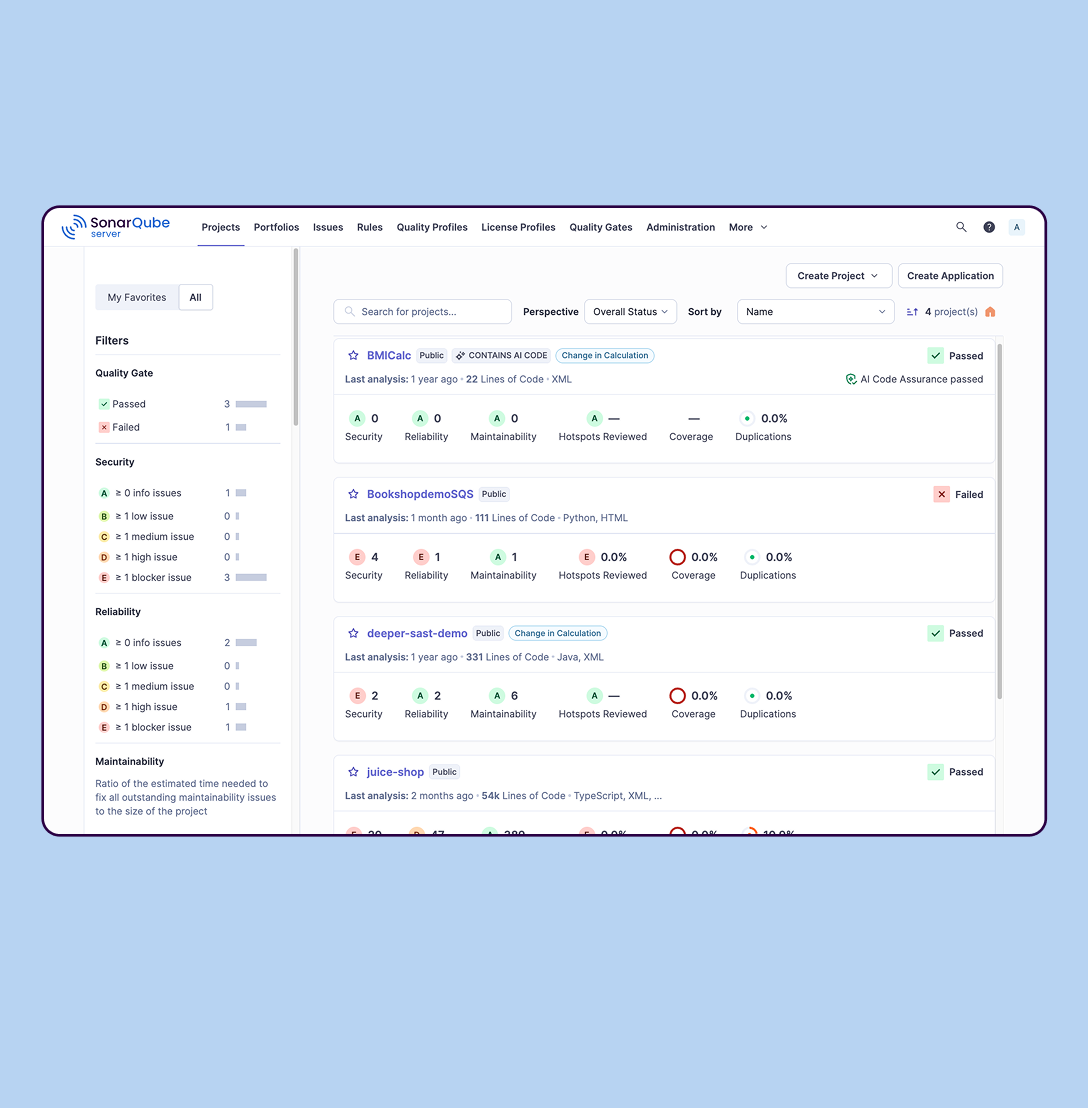
SonarQube is an automated code review solution, serving as the verification layer for code quality and SDLC security. SonarQube is used to ensure that code is secure, reliable, and maintainable. It is available through SaaS or self-managed deployment.
$0
Pricing
Amazon CloudWatch
SonarQube
Editions & Modules
Canaries
$0.0012
per canary run
Logs - Analyze (Logs Insights queries)
$0.005
per GB of data scanned
Over 1,000,000 Metrics
$0.02
per month
Contributor Insights - Matched Log Events
$0.02
per month per one million log events that match the rule
Logs - Store (Archival)
$0.03
per GB
Next 750,000 Metrics
$0.05
per month
Next 240,000 Metrics
$0.10
per month
Alarm - Standard Resolution (60 Sec)
$0.10
per month per alarm metric
First 10,000 Metrics
$0.30
per month
Alarm - High Resolution (10 Sec)
$0.30
per month per alarm metric
Alarm - Composite
$0.50
per month per alarm
Logs - Collect (Data Ingestion)
$0.50
per GB
Contributor Insights
$0.50
per month per rule
Events - Custom
$1.00
per million events
Events - Cross-account
$1.00
per million events
CloudWatch RUM
$1
per 100k events
Dashboard
$3.00
per month per dashboard
CloudWatch Evidently - Events
$5
per 1 million events
CloudWatch Evidently - Analysis Units
$7.50
per 1 million analysis units
Cloud-based: Free
$0
Self-managed: Developer
Starting at $720 annually
per year per installation
Self-managed: Enterprise
Contact sales for pricing
per year per installation
Cloud-based: Enterprise
Contact sales for pricing
per year per installation
Cloud-based: Teams
Starting at $32 per month
per month per installation
Self-managed: Data Center
Contact sales for pricing
per year per installation
Offerings
Pricing Offerings
Amazon CloudWatch
SonarQube
Free Trial
Yes
Yes
Free/Freemium Version
Yes
Yes
Premium Consulting/Integration Services
Yes
No
Entry-level Setup Fee
No setup fee
No setup fee
Additional Details
With Amazon CloudWatch, there is no up-front commitment or minimum fee; you simply pay for what you use. You will be charged at the end of the month for your usage.
For out business we find that AWS Cloudwatch is good at providing real-time metrics for monitoring and analysing the performance and usage of our platform by customers. It is possible to create custom metrics from log events, such people adding items to a basket, checking out or abandoning their orders.
SonarQube is excellent if you start using it at the beginning when developing a new system, in this situation you will be able to fix things before they become spread and expensive to correct. It’s a bit less suitable to use on existing code with bad design as it’s usually too expensive to fix everything and only allows you to ensure the situation doesn’t get worse.
It provides lot many out of the box dashboard to observe the health and usage of your cloud deployments. Few examples are CPU usage, Disk read/write, Network in/out etc.
It is possible to stream CloudWatch log data to Amazon Elasticsearch to process them almost real time.
If you have setup your code pipeline and wants to see the status, CloudWatch really helps. It can trigger lambda function when certain cloudWatch event happens and lambda can store the data to S3 or Athena which Quicksight can represent.
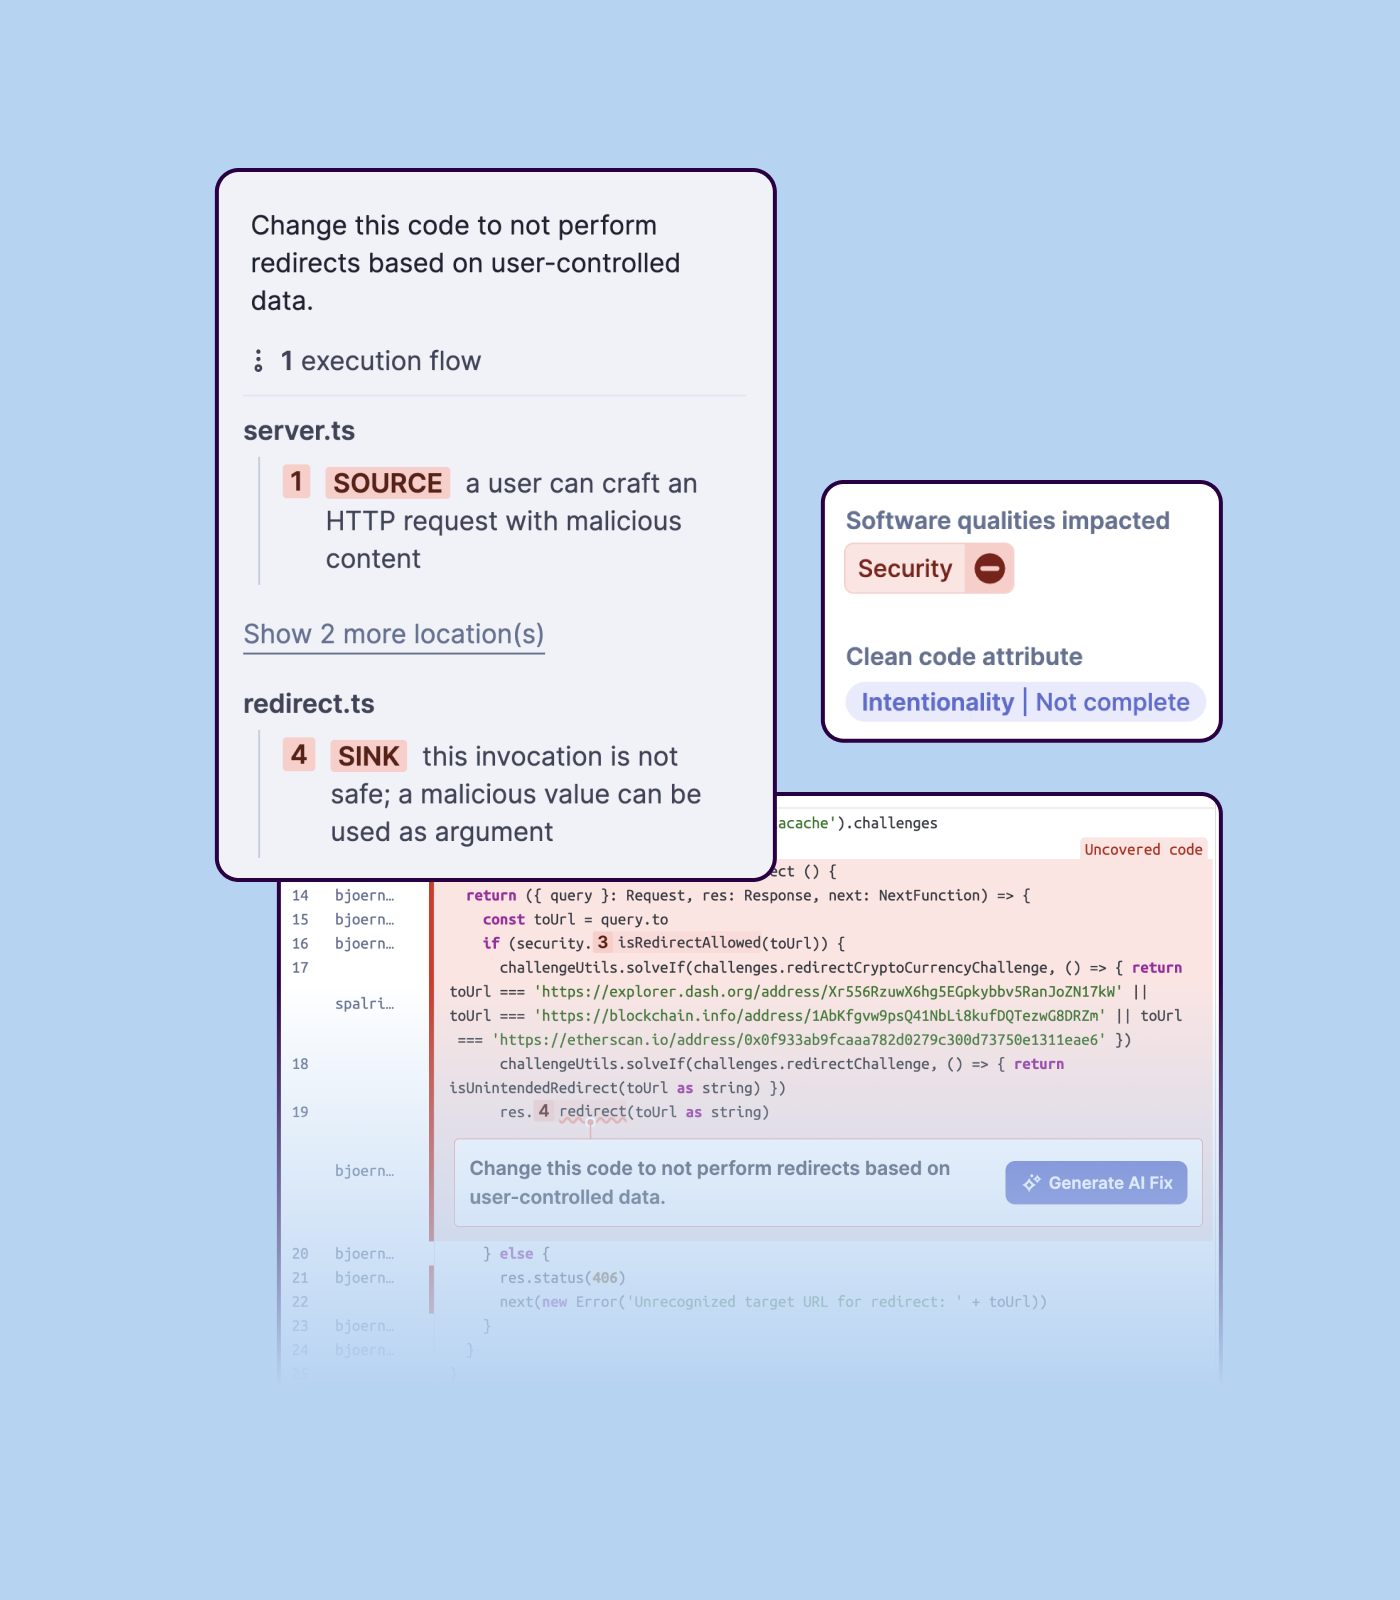
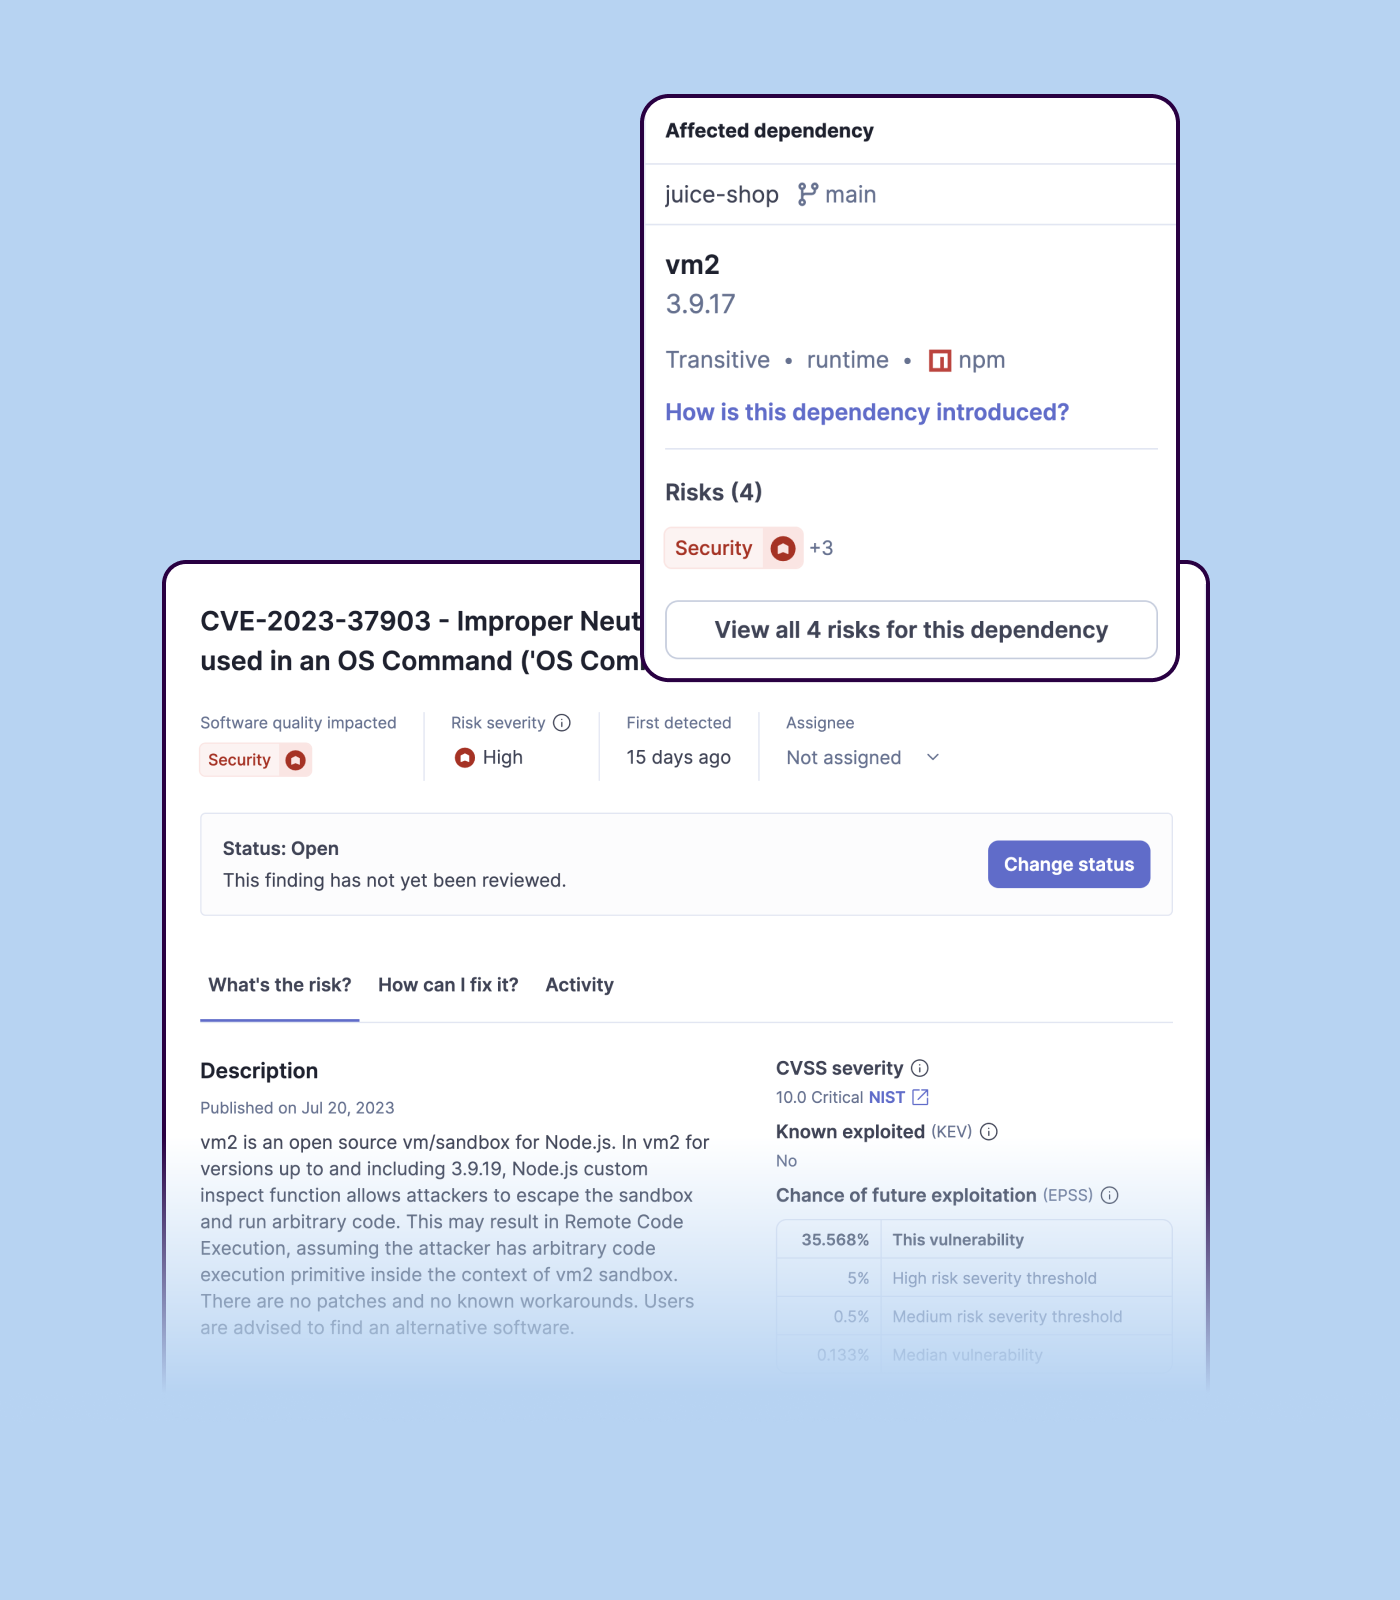
Detecting bugs and vulnerabilities: SonarQube can identify a wide range of bugs and vulnerabilities in code, such as null pointer exceptions, SQL injection, and cross-site scripting (XSS) attacks. It uses static analysis to analyze the code and identify potential issues, and it can also integrate with dynamic analysis tools to provide even more detailed analysis.
Measuring code quality: SonarQube can measure a wide range of code quality metrics, such as cyclomatic complexity, duplicated code, and code coverage. This can help teams understand the quality of their code and identify areas that need improvement.
Providing actionable insights: SonarQube provides detailed information about issues in the code, including the file and line number where the issue occurs and the severity of the issue. This makes it easy for developers to understand and address issues in the code.
Integrating with other tools: SonarQube can be integrated with a wide range of development tools and programming languages, such as Git, Maven, and Java. This allows teams to use SonarQube in their existing development workflow and take advantage of its powerful code analysis capabilities.
Managing technical debt: SonarQube provides metrics and insights on the technical debt on the codebase, enabling teams to better prioritize issues to improve the quality of the code.
Compliance with coding standards: SonarQube can check the code against industry standards like OWASP, CWE and more, making sure the code is compliant with security and coding standards.
Memory metrics on EC2 are not available on CloudWatch. Depending on workloads if we need visibility on memory metrics we use Solarwinds Orion with the agent installed. For scalable workloads, this involves customization of images being used.
Visualization out of the box. But this can easily be addressed with other solutions such as Grafana.
By design, this is only used for AWS workloads so depending on your environment cannot be used as an all in one solution for your monitoring.
Importing a new custom quality profile on SonarQube is a bit tricky, it can be made easier
Every second time when we want to rerun the server, we have to restart the whole system, otherwise, the server stops and closes automatically
When we generate a new report a second time and try to access the report, it shows details of the old report only and takes a lot of time to get updated with the details of the new and fresh report generated
It's excellent at collecting logs. It's easy to set up. The viewing & querying part could be much better, though. The query syntax takes some time to get used to, & the examples are not helpful. Also, while being great, Log Insights requires manual picking of log streams to query across every time.
Support is effective, and we were able to get any problems that we couldn't get solved through community discussion forums solved for us by the AWS support team. For example, we were assisted in one instance where we were not sure about the best metrics to use in order to optimize an auto-scaling group on EC2. The support team was able to look at our metrics and give a useful recommendation on which metrics to use.
We we easily able to integrate the SonarQube steps into our TFS process via the Microsoft Marektplace, we didn't have the need to call SonarQube support. We've used their online documentation and community forum if we ran into any issues.
Grafana is definitely a lot better and flexible in comparison with Amazon CloudWatch for visualisation, as it offers much more options and is versatile. VictoriaMetrics and Prometheus are time-series databases which can do almost everything cloudwatch can do in a better and cheaper way. Integrating Grafana with them will make it more capable Elasticsearch for log retention and querying will surpass cloudwatch log monitoring in both performance and speed
SonarQube is an open-source. It's a scalable product. The costs for this application, for the kind of job it does, are pretty descent. Pipeline scan is more secured in SonarQube. Its a very good tool and its support multiple languages. Its main core competency is of static code analysis and that is why SonarQube exists and it does it exceedingly well. The quality of scan on code convention, best practices, coding standards, unit test coverage etc makes them one of the best competent tool in the market
Positive ROI from the standpoint of flagging several issues that would have otherwise likely been unaddressed and caused more time to be spent closer to launch
Slightly positive ROI from time-saving perspective (it's an automated check which is nice, but depending on the issues it finds, can take developers time to investigate and resolve)