JMeter, from Apache, is a load and performance testing tool.
$0
SonarQube
Score 7.8 out of 10
N/A
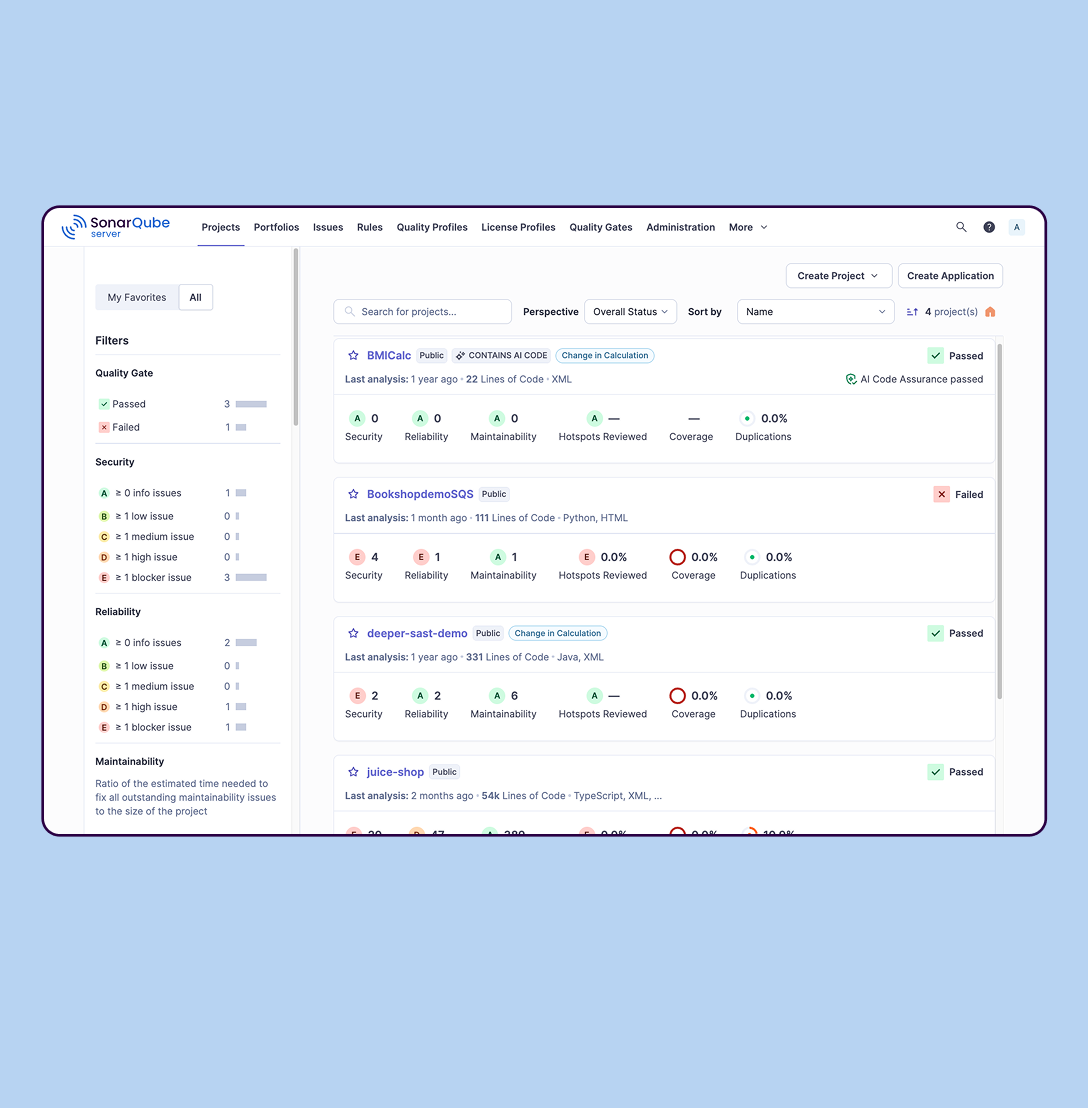
SonarQube is an automated code review solution, serving as the verification layer for code quality and SDLC security. SonarQube is used to ensure that code is secure, reliable, and maintainable. It is available through SaaS or self-managed deployment.
$0
Pricing
Apache JMeter
SonarQube
Editions & Modules
No answers on this topic
Cloud-based: Free
$0
Self-managed: Developer
Starting at $720 annually
per year per installation
Self-managed: Enterprise
Contact sales for pricing
per year per installation
Cloud-based: Enterprise
Contact sales for pricing
per year per installation
Cloud-based: Teams
Starting at $32 per month
per month per installation
Self-managed: Data Center
Contact sales for pricing
per year per installation
Offerings
Pricing Offerings
JMeter
SonarQube
Free Trial
No
Yes
Free/Freemium Version
Yes
Yes
Premium Consulting/Integration Services
No
No
Entry-level Setup Fee
No setup fee
No setup fee
Additional Details
—
—
More Pricing Information
Community Pulse
Apache JMeter
SonarQube
Features
Apache JMeter
SonarQube
Load Testing
Comparison of Load Testing features of Product A and Product B
JMeter is well suited for Java applications where the user can script the scenario once and make changes to accommodate for as many numbers of users for load test execution. The image and selection of any files or exporting files scenario is handled well.
It is less appropriate to test Ajax applications where it is required to script click per use.
SonarQube is excellent if you start using it at the beginning when developing a new system, in this situation you will be able to fix things before they become spread and expensive to correct. It’s a bit less suitable to use on existing code with bad design as it’s usually too expensive to fix everything and only allows you to ensure the situation doesn’t get worse.
Easy of use - in generate load like HTTP requests, and processing/analyzing the responses. No coding is necessary at the basic level, just need to understand load testing and the infrastructure being tested.
Automatic management of things like cookies to help with session state support - so you don't specifically have to worry about it or handle it
Lots of testing/configuration options to suit your needs in making the right load generation (sampling requests), and analyzing the results, including any pre and post processing of the results first. Things like the Beanshell/BSF pre/post processors, response assertion, regular expression extractor, XPath extractor, CSV data set config
There is a JMeter cloud service called BlazeMeter that I think would be useful for those that need to scale up high load without provisioning their own systems. I've not personally tried it though, but I recently attended a meetup presentation that highlighted nice useful features that BlazeMeter provides. One should evaluate the service if they are considering JMeter and need to expand beyond existing hardware resources.
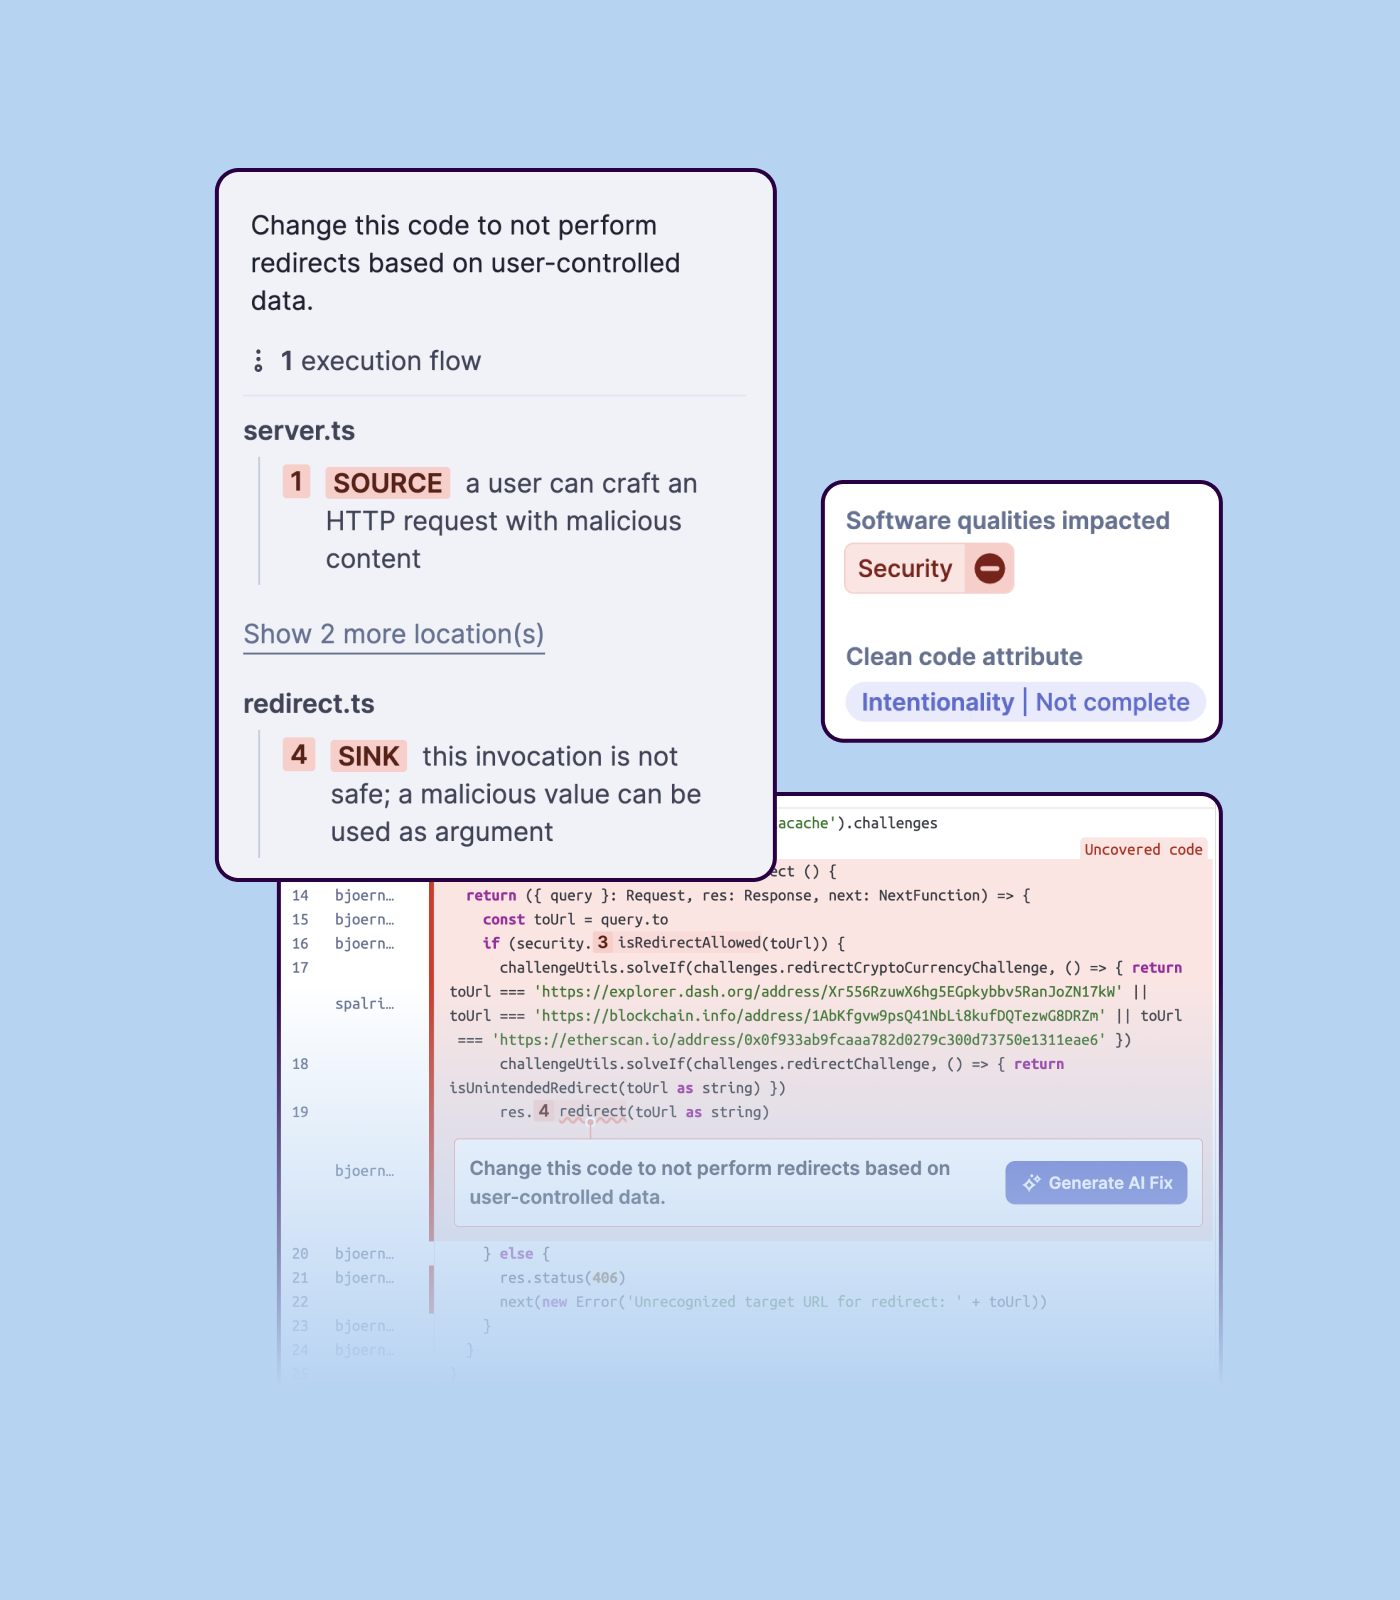
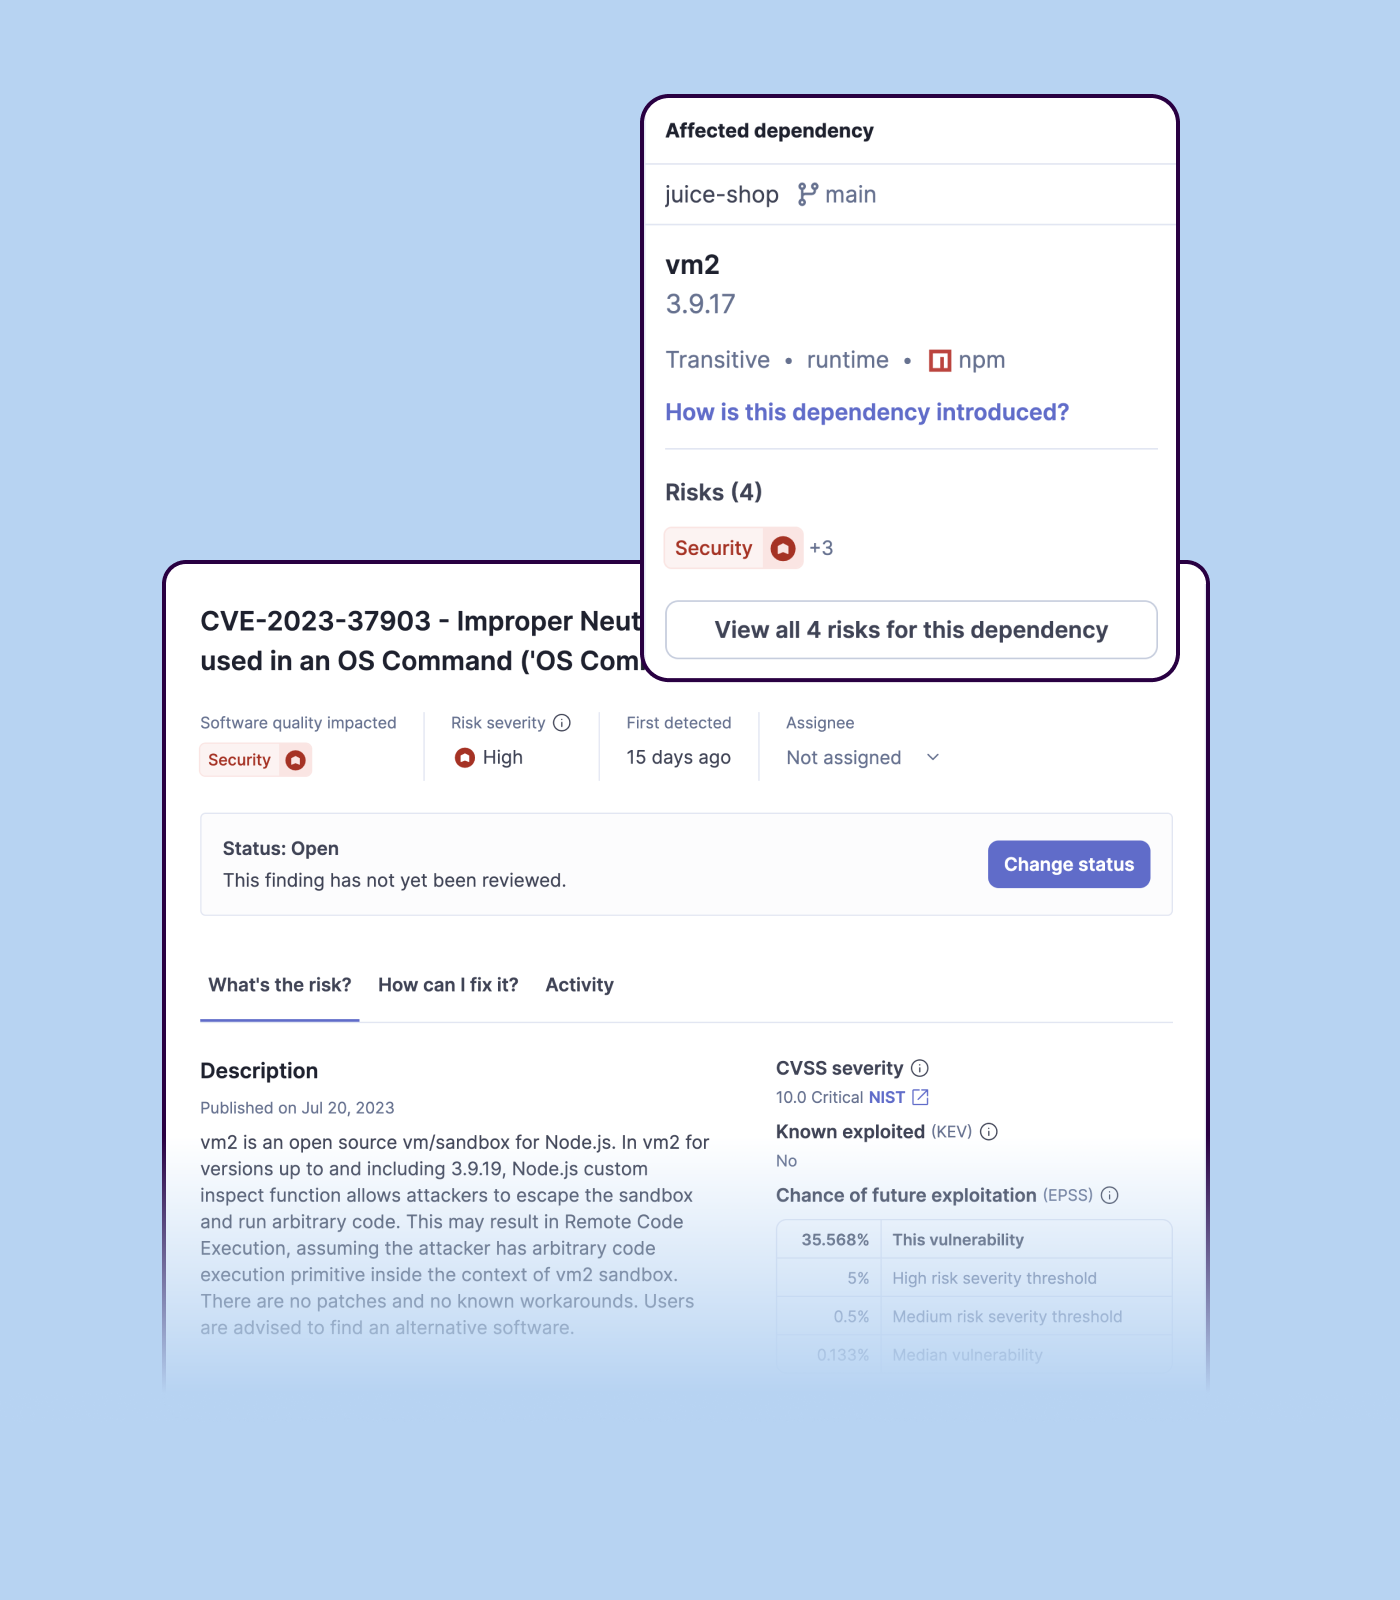
Detecting bugs and vulnerabilities: SonarQube can identify a wide range of bugs and vulnerabilities in code, such as null pointer exceptions, SQL injection, and cross-site scripting (XSS) attacks. It uses static analysis to analyze the code and identify potential issues, and it can also integrate with dynamic analysis tools to provide even more detailed analysis.
Measuring code quality: SonarQube can measure a wide range of code quality metrics, such as cyclomatic complexity, duplicated code, and code coverage. This can help teams understand the quality of their code and identify areas that need improvement.
Providing actionable insights: SonarQube provides detailed information about issues in the code, including the file and line number where the issue occurs and the severity of the issue. This makes it easy for developers to understand and address issues in the code.
Integrating with other tools: SonarQube can be integrated with a wide range of development tools and programming languages, such as Git, Maven, and Java. This allows teams to use SonarQube in their existing development workflow and take advantage of its powerful code analysis capabilities.
Managing technical debt: SonarQube provides metrics and insights on the technical debt on the codebase, enabling teams to better prioritize issues to improve the quality of the code.
Compliance with coding standards: SonarQube can check the code against industry standards like OWASP, CWE and more, making sure the code is compliant with security and coding standards.
Jmeter requires many tweaks with respect to its configuration file and thread properties. users need to edit theses files themselves. There could be some interface where we can edit this fields.
Jmeter cannot handle more threads and hangs up when we increase the number of threads. This causes lot of inconvenience. In these situations, user can be notified that such change would be lead to slow performance so that user can do as required. The same appears when we try to view huge files on graph listener.
Jmeter should optimize the read and write access to output csv since it acts as overhead to the I/O performance. This affects our test results for the application which we are testing.
Importing a new custom quality profile on SonarQube is a bit tricky, it can be made easier
Every second time when we want to rerun the server, we have to restart the whole system, otherwise, the server stops and closes automatically
When we generate a new report a second time and try to access the report, it shows details of the old report only and takes a lot of time to get updated with the details of the new and fresh report generated
Price, Wiki and user sharing. Having access to the information provided by the developers and other open source providers is key for me. The ability to share information and get answers directly is very important to success in software testing. And the price of this product currently is amazing. Too many companies charge way too much money for products that are far behind in their value and pertinence
The purpose related to performance and load testing through Apache JMeter works fine but the usability of the tool should be improved quite a lot. If someone starts with the Jmeter fresh without prior experience, they need to put more efforts in understanding the tool. The UI is not that great which is the main reason not to give high rating on usability.
I have been using JMeter for the last year. By using this tool, you can make sure the system will work under varied loads. It helps us to simulate real time scenarios by creating required virtual users and make sure the application will work under load. Perform load, stress, and stability testing using JMeter.
We we easily able to integrate the SonarQube steps into our TFS process via the Microsoft Marektplace, we didn't have the need to call SonarQube support. We've used their online documentation and community forum if we ran into any issues.
I have used LoadRunner and Silkperformer, and so far Jmeter turns out be the easiest to use of all these. While each of them have their own ROI, Jmeter can be picked by anyone in hours and start testing within a day. While with other tools, we need to get license, install them (takes a while) and setup tests and firewalls, etc.
SonarQube is an open-source. It's a scalable product. The costs for this application, for the kind of job it does, are pretty descent. Pipeline scan is more secured in SonarQube. Its a very good tool and its support multiple languages. Its main core competency is of static code analysis and that is why SonarQube exists and it does it exceedingly well. The quality of scan on code convention, best practices, coding standards, unit test coverage etc makes them one of the best competent tool in the market
Positive ROI from the standpoint of flagging several issues that would have otherwise likely been unaddressed and caused more time to be spent closer to launch
Slightly positive ROI from time-saving perspective (it's an automated check which is nice, but depending on the issues it finds, can take developers time to investigate and resolve)