Azure Analysis Services vs. iCharts
| Product | Rating | Most Used By | Product Summary | Starting Price |
|---|---|---|---|---|
 Azure Analysis Services | Score8.6 out of 10 | N/A | Azure Analysis Services delivers enterprise-grade BI semantic modeling capabilities with the scale, flexibility, and management benefits of the cloud. Azure Analysis Services helps transform complex data into actionable insights. Azure Analysis Services is built on the analytics engine in Microsoft SQL Server Analysis Services. | N/A |
 iCharts | Score8 out of 10 | Mid-Size Companies (51-1,000 employees) | iCharts is a Business Intelligence and Analytics solution for NetSuite. With this solution, users can transform their NetSuite data into interactive, real-time analytics without leaving their NetSuite dashboard. iCharts includes drag-and-drop chart creation and best-practice templates. The vendor’s value proposition is that iCharts accelerates an organization’s analytics strategy by empowering their team with the critical data-driven tools they need. | $10,000 per installation |
| Azure Analysis Services | iCharts | |||||||||||||||
|---|---|---|---|---|---|---|---|---|---|---|---|---|---|---|---|---|
| Editions & Modules | No answers on this topic |
| ||||||||||||||
| Offerings |
| |||||||||||||||
| Entry-level Setup Fee | No setup fee | $3,000 per installation | ||||||||||||||
| Additional Details | — | Based on number of NetSuite licenses | ||||||||||||||
| More Pricing Information | ||||||||||||||||
| Azure Analysis Services | iCharts | |
|---|---|---|
| Considered Both Products | No answer on this topic | No answer on this topic |
| Key User Insights | ||
| Would buy again | ||
100% Would buy again 9 Answers | No answers on this topic | |
| Delivers good value for the price | ||
100% Delivers good value for the price 9 Answers | No answers on this topic | |
| Happy with the feature set | ||
100% Happy with the feature set 9 Answers | No answers on this topic | |
| Lived up to sales and marketing promises | ||
100% Lived up to sales and marketing promises 7 Answers | No answers on this topic | |
| Implementation went as expected | ||
100% Implementation went as expected 9 Answers | No answers on this topic | |
| Azure Analysis Services | iCharts | ||||||||||||||||||||||
|---|---|---|---|---|---|---|---|---|---|---|---|---|---|---|---|---|---|---|---|---|---|---|---|
| BI Standard Reporting |
| ||||||||||||||||||||||
| Ad-hoc Reporting |
| ||||||||||||||||||||||
| Report Output and Scheduling |
| ||||||||||||||||||||||
| Data Discovery and Visualization |
| ||||||||||||||||||||||
| Access Control and Security |
| ||||||||||||||||||||||
| Mobile Capabilities |
| ||||||||||||||||||||||
| Application Program Interfaces (APIs) / Embedding |
| ||||||||||||||||||||||
| Azure Analysis Services | iCharts | |
|---|---|---|
| Small Businesses |  Cyfe Score4 out of 10 | Cyfe Score4 out of 10 |
| Medium-sized Companies |  Zendesk Explore Score8.1 out of 10 | Zendesk Explore Score8.1 out of 10 |
| Enterprises |  Sisense Score6.7 out of 10 | Sisense Score6.7 out of 10 |
| All Alternatives | View all alternatives | View all alternatives |
| Azure Analysis Services | iCharts | |
|---|---|---|
| Likelihood to Recommend | 9.0 | 8.0 |
| Data Sharing and Collaboration | - | 5.0 |
| Data Sources | - | 4.0 |
| Azure Analysis Services | iCharts | |
|---|---|---|
| Likelihood to Recommend |
|
|
| Pros |
|
|
| Cons |
|
|
| Alternatives Considered |
|
|
| Return on Investment |
| No answers on this topic |
| ScreenShots | iCharts Screenshots 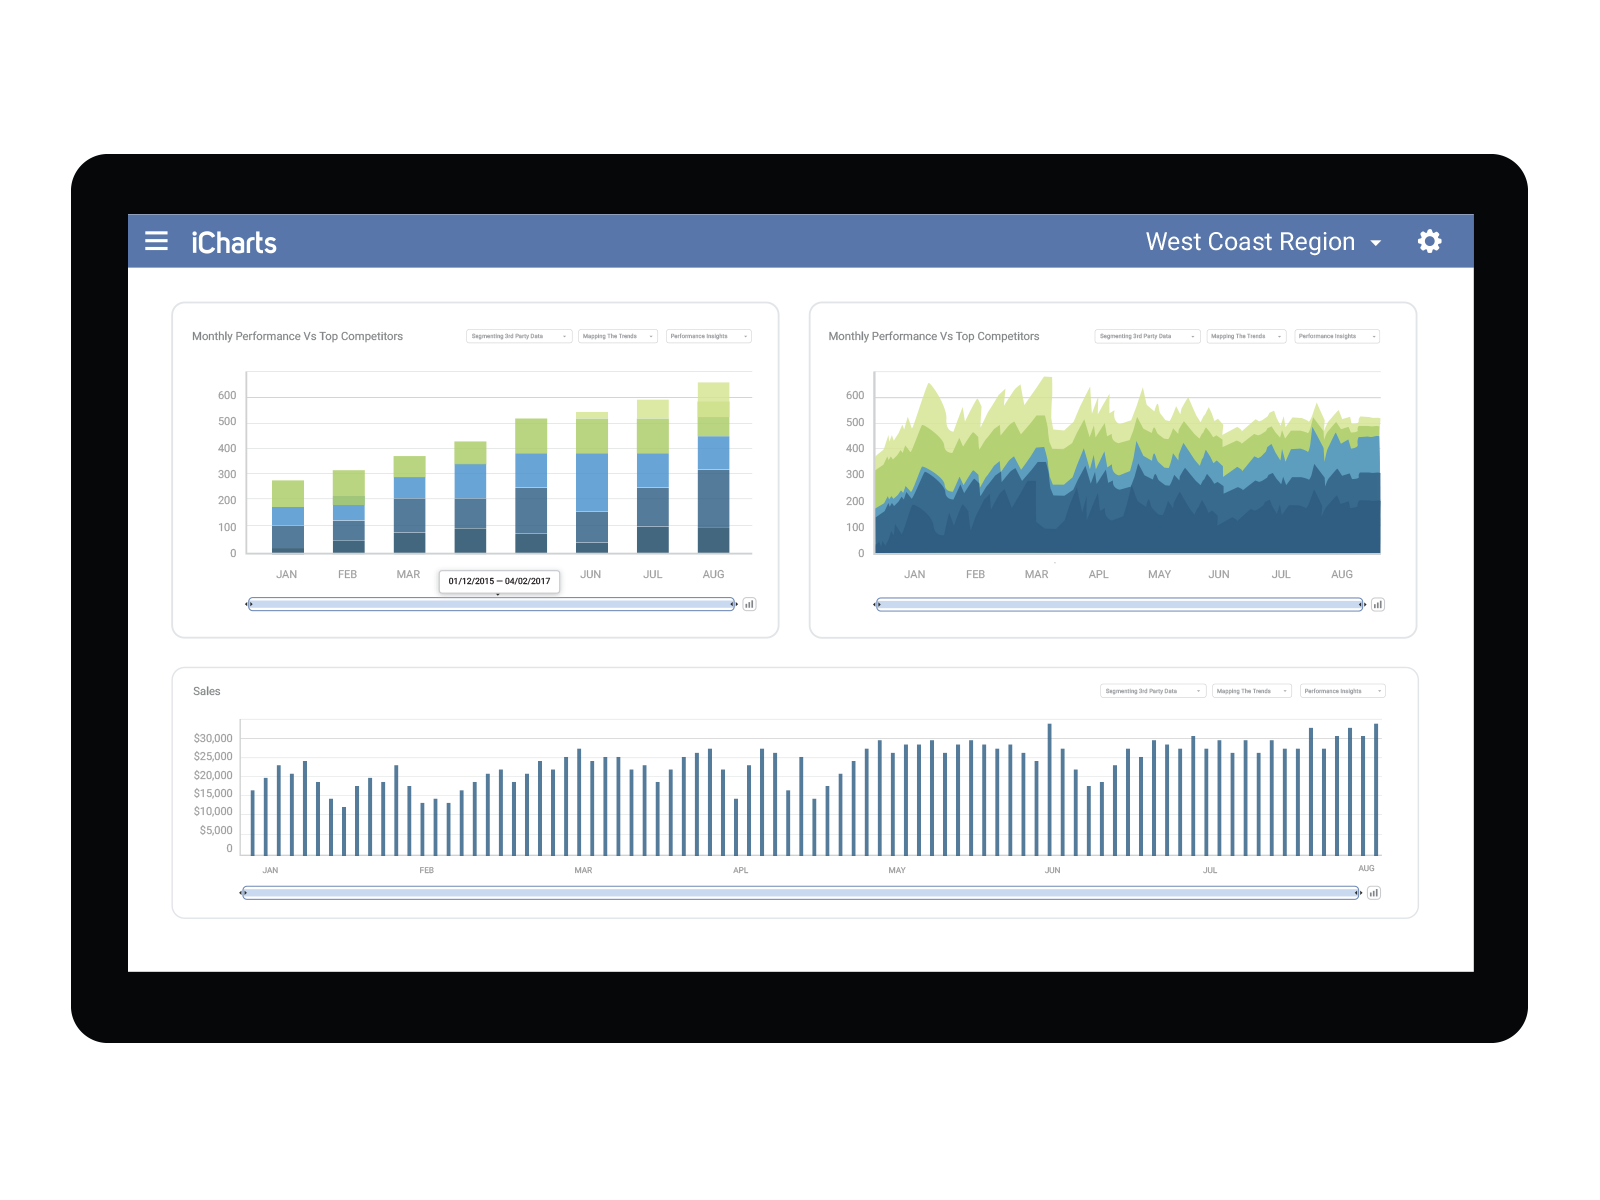 |