
Biuwer vs. SAS Visual Analytics
| Product | Rating | Most Used By | Product Summary | Starting Price |
|---|---|---|---|---|
 Biuwer | N/A | N/A | Biuwer is a cloud-based Business Data Analytics platform that helps analyze business data and create reports and dashboards to inform decision-making. It aims to enable users to create and share reports, even if they have no technical knowledge. The vendor states Biuwer is specially designed for modern companies that are committed to continuous improvement based on daily work with data embracing a Data Driven Growth culture, and that it promotes internal and external collaboration with… | $60 per organization |
 SAS Visual Analytics | Score7.8 out of 10 | Enterprise companies (1,001+ employees) | SAS Visual Analytics provides a complete platform for analytics visualization, enabling users to identify patterns and relationships in data that weren't initially evident. Interactive, self-service BI and reporting capabilities are combined with out-of-the-box advanced analytics so everyone can discover insights from any size and type of data, including text. | N/A |
| Biuwer | SAS Visual Analytics | |||||||||||||||
|---|---|---|---|---|---|---|---|---|---|---|---|---|---|---|---|---|
| Editions & Modules |
|
| ||||||||||||||
| Offerings |
| |||||||||||||||
| Entry-level Setup Fee | Optional | No setup fee | ||||||||||||||
| Additional Details | A pricing plan for every need. Please reach us to explain your needs and we'll setup the right plan for your company. There are monthly and yearly subscriptions. Year subscriptions get two months for free. Biuwer plans include a set of features and number of users, that you can upgrade when needed. | SAS Visual Statistics and SAS Office Analytics are also available as add-ons. | ||||||||||||||
| More Pricing Information | ||||||||||||||||
| Biuwer | SAS Visual Analytics | ||||||||||||||||||||||
|---|---|---|---|---|---|---|---|---|---|---|---|---|---|---|---|---|---|---|---|---|---|---|---|
| BI Standard Reporting |
| ||||||||||||||||||||||
| Ad-hoc Reporting |
| ||||||||||||||||||||||
| Report Output and Scheduling |
| ||||||||||||||||||||||
| Data Discovery and Visualization |
| ||||||||||||||||||||||
| Access Control and Security |
| ||||||||||||||||||||||
| Mobile Capabilities |
| ||||||||||||||||||||||
| Application Program Interfaces (APIs) / Embedding |
| ||||||||||||||||||||||
| Biuwer | SAS Visual Analytics | |
|---|---|---|
| Small Businesses |  Cyfe Score4 out of 10 | Cyfe Score4 out of 10 |
| Medium-sized Companies |  Qlik Cloud Analytics (Qlik Sense) Score8.1 out of 10 | Qlik Cloud Analytics (Qlik Sense) Score8.1 out of 10 |
| Enterprises |  Sisense Score6.9 out of 10 | Sisense Score6.9 out of 10 |
| All Alternatives | View all alternatives | View all alternatives |
| Biuwer | SAS Visual Analytics | |
|---|---|---|
| Likelihood to Recommend | - | 9.0 |
| Likelihood to Renew | - | 9.3 |
| Usability | - | 6.0 |
| Support Rating | - | 8.0 |
| Data Sharing and Collaboration | - | 9.6 |
| Data Sources | - | 9.8 |
| Biuwer | SAS Visual Analytics | |
|---|---|---|
| Likelihood to Recommend | No answers on this topic |
|
| Pros | No answers on this topic |
|
| Cons | No answers on this topic |
|
| Likelihood to Renew | No answers on this topic |
|
| Usability | No answers on this topic |
|
| Support Rating | No answers on this topic |
|
| Alternatives Considered | No answers on this topic |
|
| Return on Investment | No answers on this topic |
|
| ScreenShots | Biuwer Screenshots      | SAS Visual Analytics Screenshots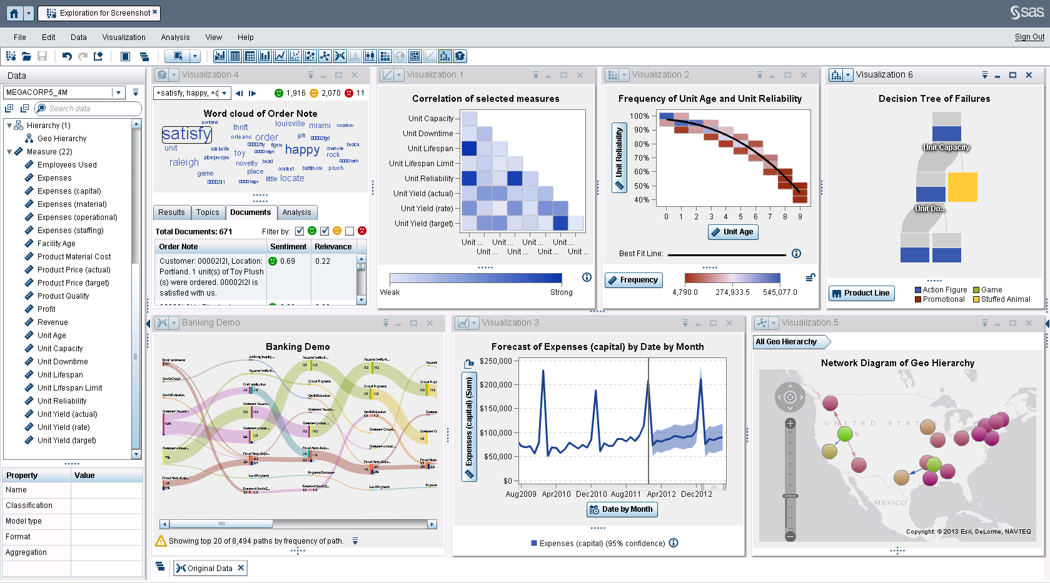 |


