
Bumblebee vs. SAS Visual Analytics
| Product | Rating | Most Used By | Product Summary | Starting Price |
|---|---|---|---|---|
 Bumblebee | N/A | Small Businesses (1-50 employees) | Bumblebee is a reporting platform for managed service providers (MSPs). It combines data from supported PSA, RMM, Microsoft 365, security, and other tools into branded quarterly business reviews (QBRs), service reviews, and security scorecards. Teams use reusable templates and conversational AI to customize report content, metrics, branding, and layouts. Reports bring together service performance, security findings, and recommended next steps to support client discussions. MSP… | $250 per month |
 SAS Visual Analytics | Score7.9 out of 10 | Enterprise companies (1,001+ employees) | SAS Visual Analytics provides a complete platform for analytics visualization, enabling users to identify patterns and relationships in data that weren't initially evident. Interactive, self-service BI and reporting capabilities are combined with out-of-the-box advanced analytics so everyone can discover insights from any size and type of data, including text. | N/A |
| Bumblebee | SAS Visual Analytics | |||||||||||||||
|---|---|---|---|---|---|---|---|---|---|---|---|---|---|---|---|---|
| Editions & Modules |
|
| ||||||||||||||
| Offerings |
| |||||||||||||||
| Entry-level Setup Fee | $3,000 one-time fee per project (starting price) | No setup fee | ||||||||||||||
| Additional Details | Self-service reporting starts at $250/month and includes 10 connected tools, 1,250 AI minutes worked per month (equivalent to 100+ reports), and two guided 30-minute setup calls. Optional guided implementation starts at $3,000/project; scope and timeline are confirmed before kickoff. A one-month trial is available. | SAS Visual Statistics and SAS Office Analytics are also available as add-ons. | ||||||||||||||
| More Pricing Information | ||||||||||||||||
| Bumblebee | SAS Visual Analytics | ||||||||||||||||||||||
|---|---|---|---|---|---|---|---|---|---|---|---|---|---|---|---|---|---|---|---|---|---|---|---|
| BI Standard Reporting |
| ||||||||||||||||||||||
| Ad-hoc Reporting |
| ||||||||||||||||||||||
| Report Output and Scheduling |
| ||||||||||||||||||||||
| Data Discovery and Visualization |
| ||||||||||||||||||||||
| Access Control and Security |
| ||||||||||||||||||||||
| Mobile Capabilities |
| ||||||||||||||||||||||
| Application Program Interfaces (APIs) / Embedding |
| ||||||||||||||||||||||
| Bumblebee | SAS Visual Analytics | |
|---|---|---|
| Small Businesses |  Cyfe Score4 out of 10 | Cyfe Score4 out of 10 |
| Medium-sized Companies |  Zendesk Explore Score8.1 out of 10 | Zendesk Explore Score8.1 out of 10 |
| Enterprises |  Sisense Score6.7 out of 10 | Sisense Score6.7 out of 10 |
| All Alternatives | View all alternatives | View all alternatives |
| Bumblebee | SAS Visual Analytics | |
|---|---|---|
| Likelihood to Recommend | - | 9.0 |
| Likelihood to Renew | - | 9.3 |
| Usability | - | 6.0 |
| Support Rating | - | 8.0 |
| Data Sharing and Collaboration | - | 9.6 |
| Data Sources | - | 9.8 |
| Bumblebee | SAS Visual Analytics | |
|---|---|---|
| Likelihood to Recommend | No answers on this topic |
|
| Pros | No answers on this topic |
|
| Cons | No answers on this topic |
|
| Likelihood to Renew | No answers on this topic |
|
| Usability | No answers on this topic |
|
| Support Rating | No answers on this topic |
|
| Alternatives Considered | No answers on this topic |
|
| Return on Investment | No answers on this topic |
|
| ScreenShots | Bumblebee Screenshots  | SAS Visual Analytics Screenshots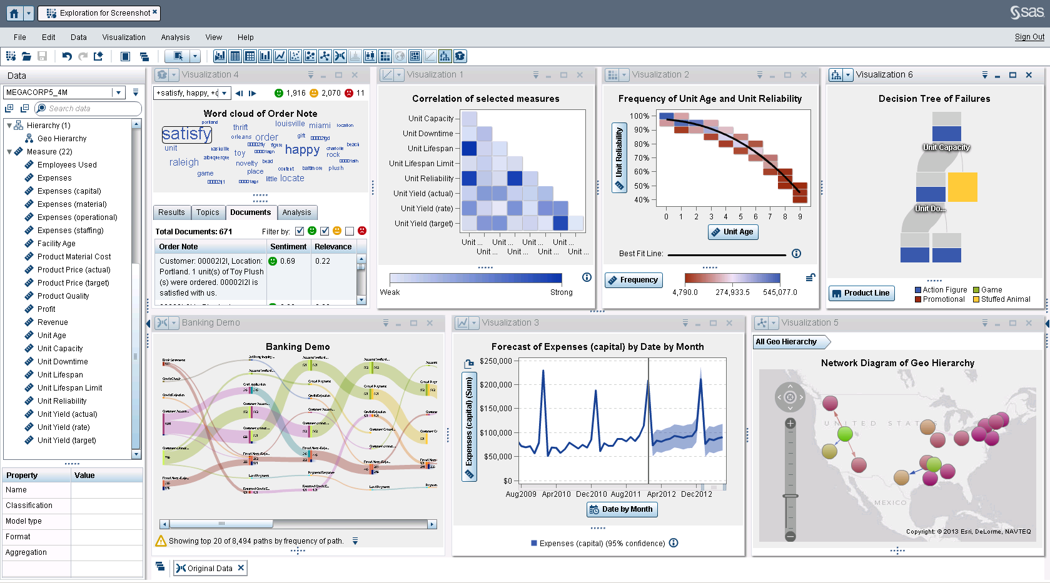 |


