TrustRadius: an HG Insights company

ClicData vs. Flexmonster Pivot Table & Charts Component

Save this comparison

Save this comparison

Add Product

Recommended Comparisons

    Overview
    ProductRatingMost Used ByProduct SummaryStarting Price

    ClicData

    Score8.5 out of 10
    N/AClicData is a cloud-based data management and business intelligence platform for connecting, preparing, storing, visualizing, and distributing organizational data. The platform combines data integration, extract, transform, and load (ETL) processes, data warehousing, dashboard creation, automation, and artificial intelligence features. Key Capabilities Data connectivity: ClicData connects to business applications and databases to support automated data…

    $290

    per month

    Flexmonster Pivot Table & Charts Component

    Score10 out of 10
    Mid-Size Companies (51-1,000 employees)
    Flexmonster Pivot Table & Charts is a component for interactive pivot reports that can be inserted into a web page or a web application. It’s a JavaScript tool that enables a user to visualize their business data. This solution supports Microsoft Analysis Services OLAP cubes, Mondrian, icCube, JSON, SQL (MS SQL, MySQL and others) databases or static JSON or CSV files. According to the vendor, this solution allows users to work extremely quickly with really large data…

    $0

    Annual SaaS Subscription

    Pricing
    ClicDataFlexmonster Pivot Table & Charts Component
    Editions & Modules
    Basic
    $290
    per month
    Team
    $520
    per month
    Enterprise
    $835
    per month
    Dedicated
    Custom Quote
    Pivot Table for SQL/CSV/JSON Unlimited
    $0
    Annual SaaS Subscription
    Pivot Table for Pentaho Mondrian
    $0
    Annual SaaS Subscription
    Pivot Table for MS Analysis Services
    $0
    Annual SaaS Subscription
    Pivot Table for SQL/CSV/JSON Basic
    $299
    Annual subscription
    Pivot Table for Pentaho Mondrian
    $799
    Annual subscription
    Pivot Table for SQL/CSV/JSON Unlimited
    $799
    Annual subscription
    Pivot Table for MS Analysis Services
    $799
    Annual subscription
    Offerings
    Pricing Offerings
    ClicDataFlexmonster Pivot Table & Charts Component
    Free Trial
    YesYes
    Free/Freemium Version
    NoNo
    Premium Consulting/Integration Services
    NoYes
    Entry-level Setup FeeNo setup feeNo setup fee
    Additional DetailsPlans start at $290/month and include unlimited dashboards, reports, and data flows, as well as a built-in data warehouse and data lake. User licenses are included in all plans (up to 25, 50, or 200 users depending on the plan), and dashboards can be shared with external users via live links at no extra cost. Plans and pricing vary based on the data connectors needed (Files & Storage, Web Services & Apps, or Databases), the number of table updates per month, and the level of automation required. SSO and White Label options are available on the Enterprise plan. AI-powered features are included in the Team and Enterprise plans. Dedicated Plans are also available for organizations requiring stable and predictable performance, higher data volumes, and faster processing times (Standard, Performance, and Self-Hosted options). Professional Services are available as paid add-ons: Onboarding (one-time fee for personalized training and shadowing sessions), Project (fixed cost with clearly defined deliverables), and Packages (ad-hoc hours of Data Analysts' time). A discount is available for annual billing.—
    More Pricing Information
    Features
    ClicDataFlexmonster Pivot Table & Charts Component
    BI Standard Reporting
    Comparison of BI Standard Reporting features of ClicData and Flexmonster Pivot Table & Charts Component
    Feature
    ClicData
    10.0
    3 Ratings
    20% above category average
    Flexmonster Pivot Table & Charts Component
    10.0
    1 Ratings
    20% above category average
    Pixel Perfect reports10.01 Ratings00 Ratings
    Customizable dashboards10.03 Ratings00 Ratings
    Report Formatting Templates00 Ratings10.01 Ratings
    Ad-hoc Reporting
    Comparison of Ad-hoc Reporting features of ClicData and Flexmonster Pivot Table & Charts Component
    Feature
    ClicData
    9.0
    3 Ratings
    12% above category average
    Flexmonster Pivot Table & Charts Component
    9.5
    1 Ratings
    17% above category average
    Drill-down analysis8.03 Ratings00 Ratings
    Formatting capabilities9.03 Ratings9.01 Ratings
    Report sharing and collaboration10.02 Ratings10.01 Ratings
    Report Output and Scheduling
    Comparison of Report Output and Scheduling features of ClicData and Flexmonster Pivot Table & Charts Component
    Feature
    ClicData
    8.5
    3 Ratings
    3% above category average
    Flexmonster Pivot Table & Charts Component
    10.0
    1 Ratings
    20% above category average
    Publish to Web10.02 Ratings00 Ratings
    Publish to PDF9.02 Ratings10.01 Ratings
    Report Versioning7.02 Ratings00 Ratings
    Report Delivery Scheduling8.01 Ratings00 Ratings
    Data Discovery and Visualization
    Comparison of Data Discovery and Visualization features of ClicData and Flexmonster Pivot Table & Charts Component
    Feature
    ClicData
    8.5
    3 Ratings
    6% above category average
    Flexmonster Pivot Table & Charts Component
    -
    Ratings
    Pre-built visualization formats (heatmaps, scatter plots etc.)10.03 Ratings00 Ratings
    Location Analytics / Geographic Visualization7.02 Ratings00 Ratings
    Access Control and Security
    Comparison of Access Control and Security features of ClicData and Flexmonster Pivot Table & Charts Component
    Feature
    ClicData
    10.0
    2 Ratings
    16% above category average
    Flexmonster Pivot Table & Charts Component
    -
    Ratings
    Multi-User Support (named login)10.02 Ratings00 Ratings
    Multiple Access Permission Levels (Create, Read, Delete)10.02 Ratings00 Ratings
    Mobile Capabilities
    Comparison of Mobile Capabilities features of ClicData and Flexmonster Pivot Table & Charts Component
    Feature
    ClicData
    6.0
    2 Ratings
    25% below category average
    Flexmonster Pivot Table & Charts Component
    10.0
    1 Ratings
    25% above category average
    Responsive Design for Web Access7.02 Ratings10.01 Ratings
    Mobile Application1.01 Ratings00 Ratings
    Dashboard / Report / Visualization Interactivity on Mobile10.02 Ratings00 Ratings
    Application Program Interfaces (APIs) / Embedding
    Comparison of Application Program Interfaces (APIs) / Embedding features of ClicData and Flexmonster Pivot Table & Charts Component
    Feature
    ClicData
    10.0
    1 Ratings
    25% above category average
    Flexmonster Pivot Table & Charts Component
    -
    Ratings
    iFrames10.01 Ratings00 Ratings
    Themeable User Interface (UI)10.01 Ratings00 Ratings
    Best Alternatives
    ClicDataFlexmonster Pivot Table & Charts Component
    Small Businesses
    Cyfe
    Score4 out of 10
    Cyfe
    Score4 out of 10
    Medium-sized Companies
    Qlik Cloud Analytics (Qlik Sense)
    Score8.1 out of 10
    Qlik Cloud Analytics (Qlik Sense)
    Score8.1 out of 10
    Enterprises
    Sisense
    Score6.9 out of 10
    Sisense
    Score6.9 out of 10
    All AlternativesView all alternativesView all alternatives
    User Ratings
    ClicDataFlexmonster Pivot Table & Charts Component
    Likelihood to Recommend
    10.0
    (3 ratings)
    10.0
    (1 ratings)
    Usability
    10.0
    (1 ratings)
    9.0
    (1 ratings)
    Support Rating
    10.0
    (1 ratings)
    10.0
    (1 ratings)
    Data Sharing and Collaboration
    8.0
    (2 ratings)
    -
    (0 ratings)
    Data Sources
    8.0
    (2 ratings)
    -
    (0 ratings)
    User Testimonials
    ClicDataFlexmonster Pivot Table & Charts Component
    Likelihood to Recommend
    ClicData
    We used ClicData dashboards in a somewhat unorthodox way: we used "Indicators", or icons within tables to represent data, and the results looked great. The ability to integrate 3rd party HTML into dashboards was valuable (although Clic Data correctly warns that response time may suffer). The ability to start small and release dashboards incrementally suited our needs very well. We also valued the responsive account team getting us quickly pointed in the right direction.
    Incentivized
    Read full review
    Flexmonster
    Fantastic product to embed in any SaaS solution for reporting and data exports. Excellent performance, ability to customize fields and tons of other features out of the box that makes it a well-rounded tool that is easy to use. To top it off their support is amazing for answering technical questions quickly and they provide great examples to learn how to interact with the code. We are very happy with our choice to use Flexmonster!
    Incentivized
    Read full review
    Pros
    ClicData
    • Ease of use, I can put together a dashboard in about an hour that is used by daily.
    • Support, their support team is super helpful and always has detailed insight.
    • Connectors, they have a huge number of connectors that allow easy integration of your data sources.
    Incentivized
    Read full review
    Flexmonster
    No answers on this topic
    Cons
    ClicData
    • More widgets.
    • Sometimes it takes a while to refresh.
    Incentivized
    Read full review
    Flexmonster
    No answers on this topic
    Usability
    ClicData
    Like I mentioned before, the ease of use means we not only get very quick results and beautiful dashboards in minutes, it means my team is actually using it because they aren't frustrated in the learning curve or wasting time trying to accomplish simple tasks.
    Incentivized
    Read full review
    Flexmonster
    Checks all the boxes! Easy to use, great out of the box feature set and fantastic support team
    Incentivized
    Read full review
    Support Rating
    ClicData
    We've only needed support a couple times in the beginning as we were learning the system and how to display our data in interesting ways. Every time we reached out we got very detailed responses and were connected to someone that you could tell was very interested in making sure we were happy with how things were going.
    Incentivized
    Read full review
    Flexmonster
    Quick response to questions and feedback, excellent documentation for learning about the product and tons of examples to leverage.
    Incentivized
    Read full review
    Alternatives Considered
    ClicData
    ClicData was the most flexible. It is cloud-based and even has WebService access. You can publish your data for access from other applications. The sheer number of data connectors is amazing. The ability to not only create dashboards, but you can schedule them to be delivered to specific recipients on a scheduled basis via PDF or a static HTML page.
    Incentivized
    Read full review
    Flexmonster
    No answers on this topic
    Return on Investment
    ClicData
    • ClicData was by far the most reasonable cost-wise, and we were able to get ROI within just minutes of using it.
    Incentivized
    Read full review
    Flexmonster
    No answers on this topic
    ScreenShots

    ClicData Screenshots

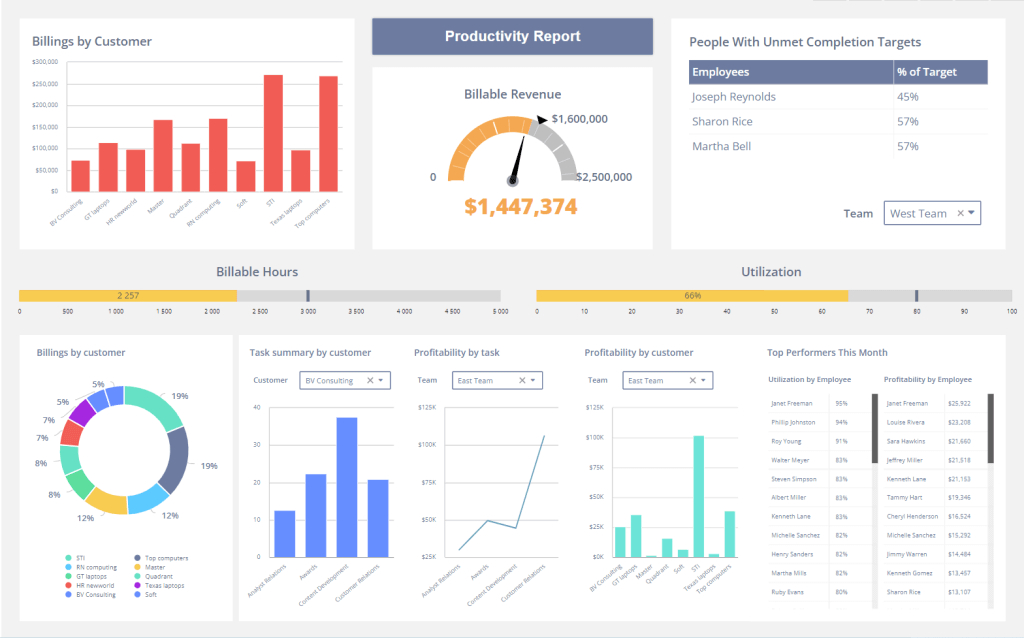
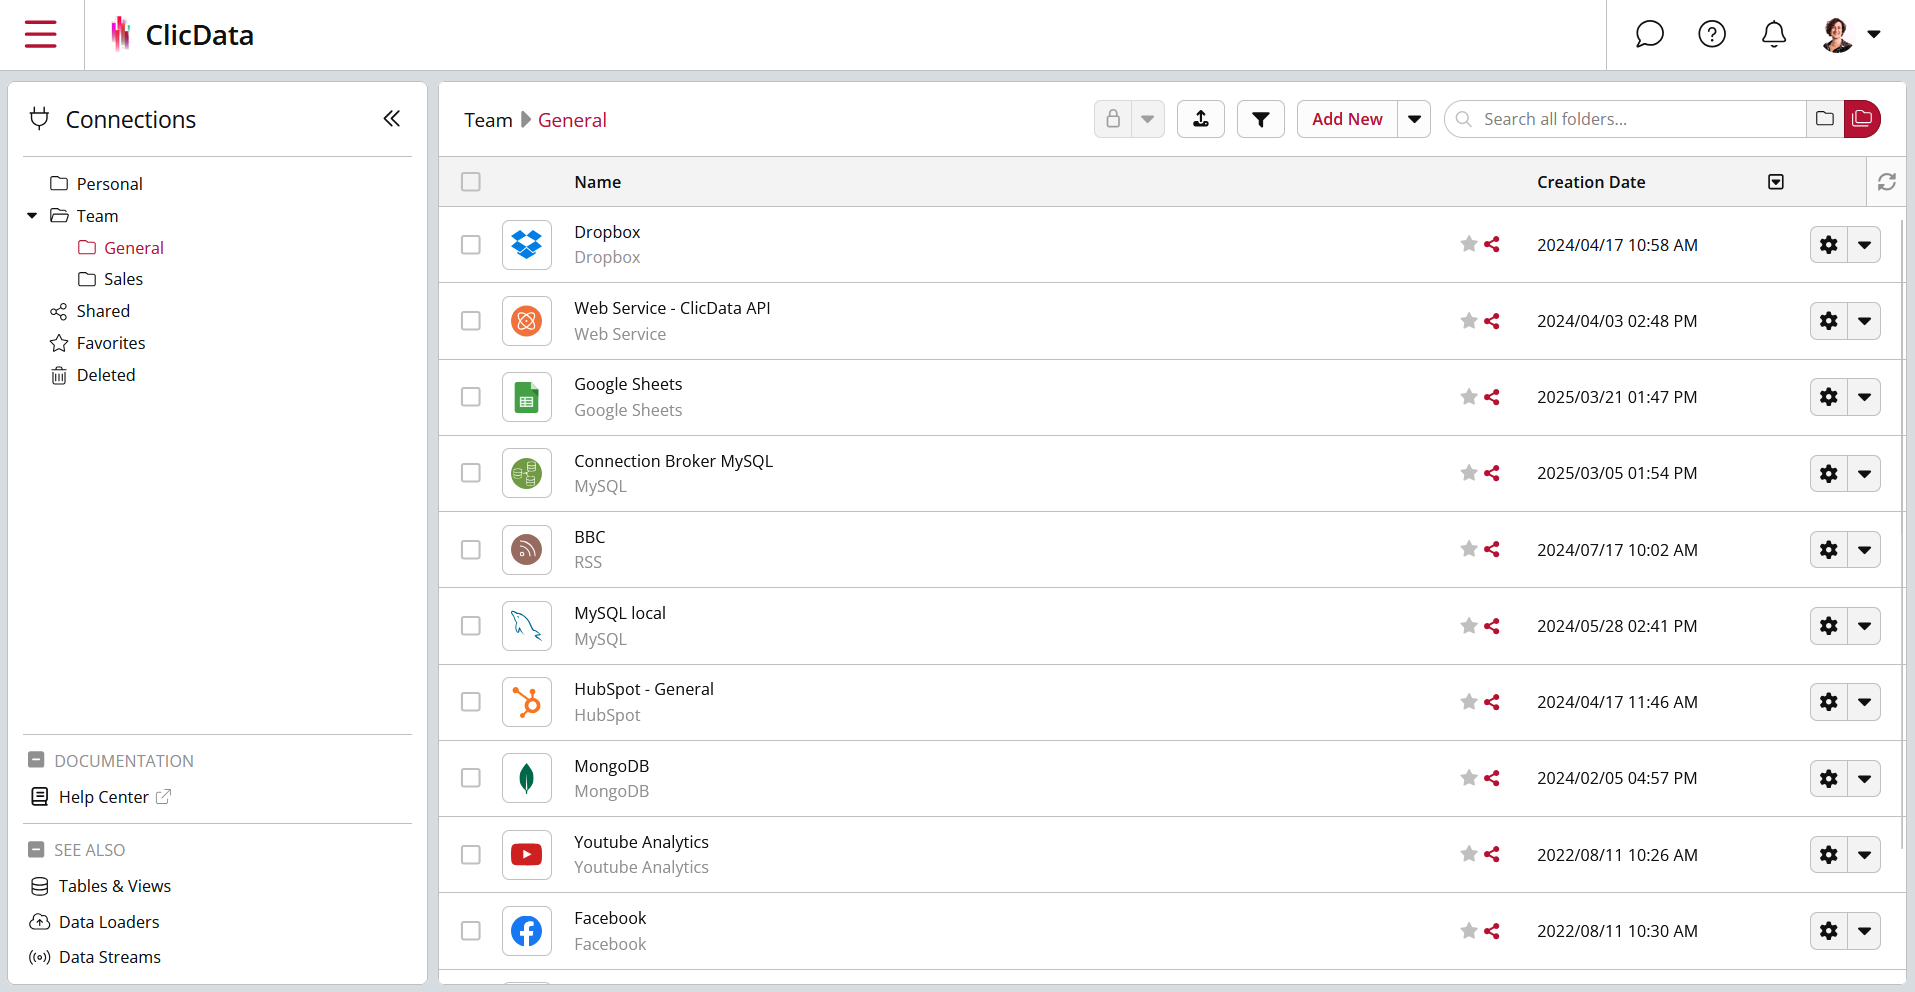
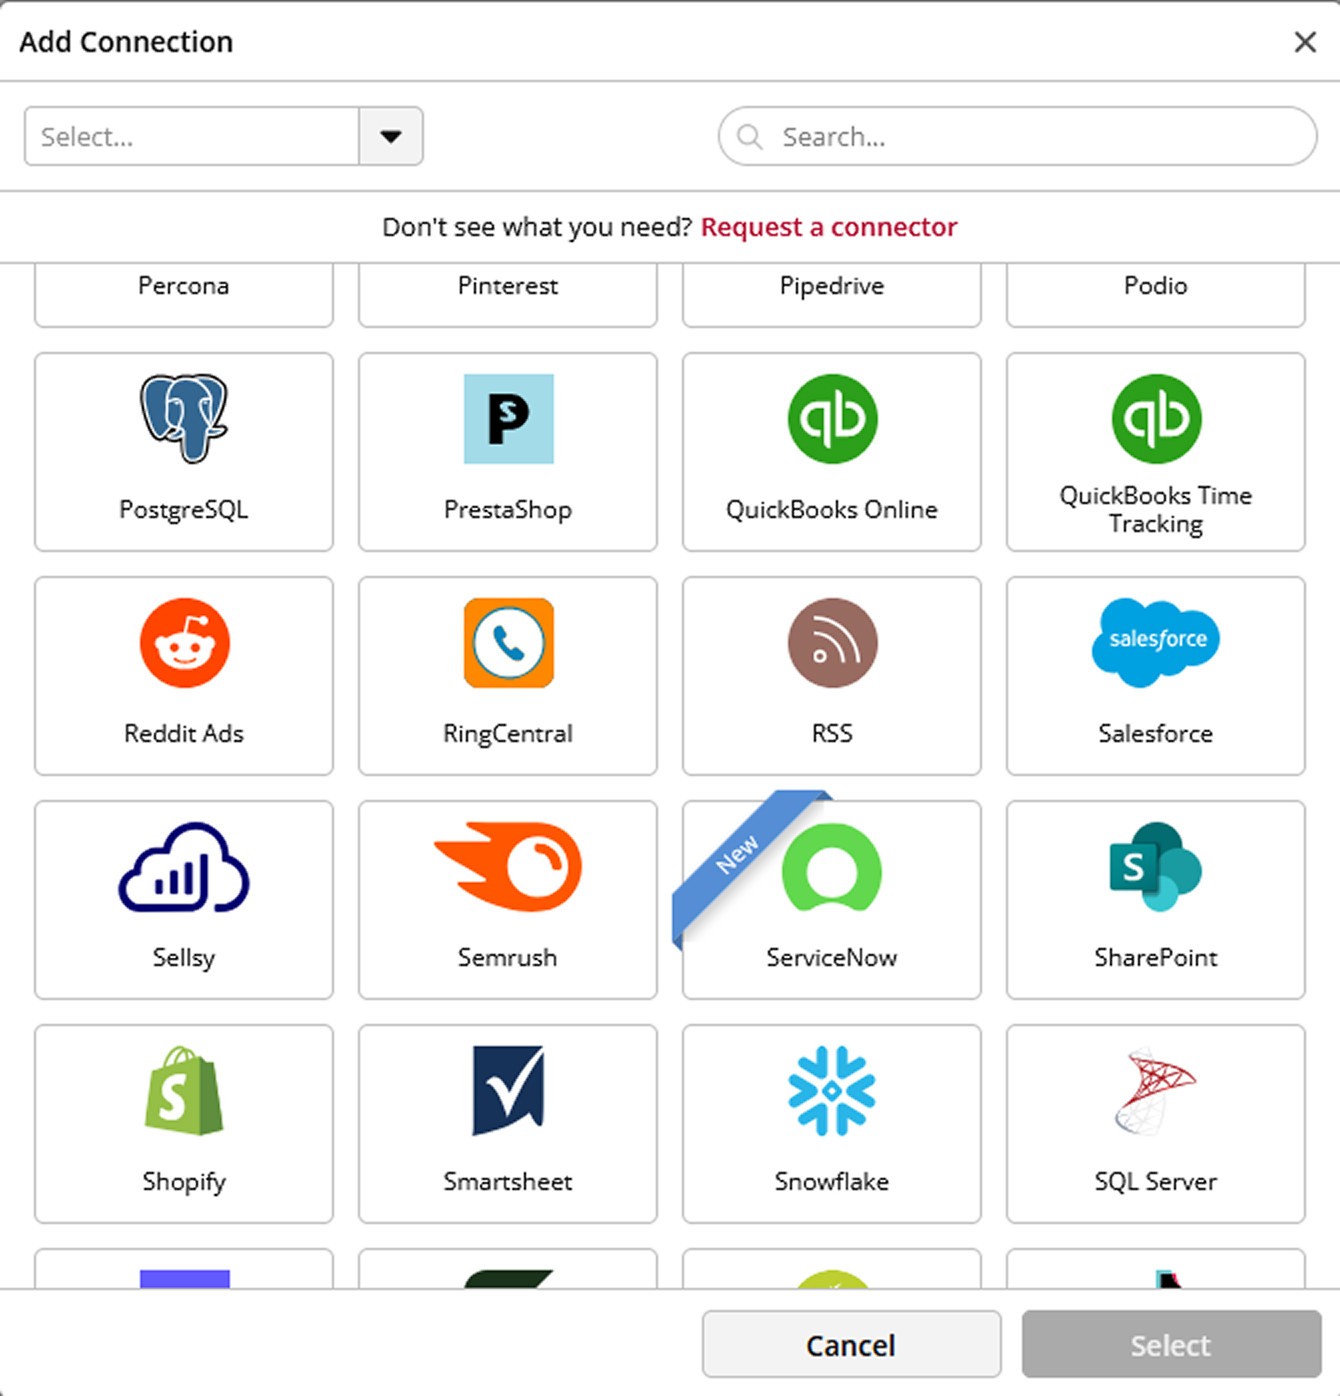
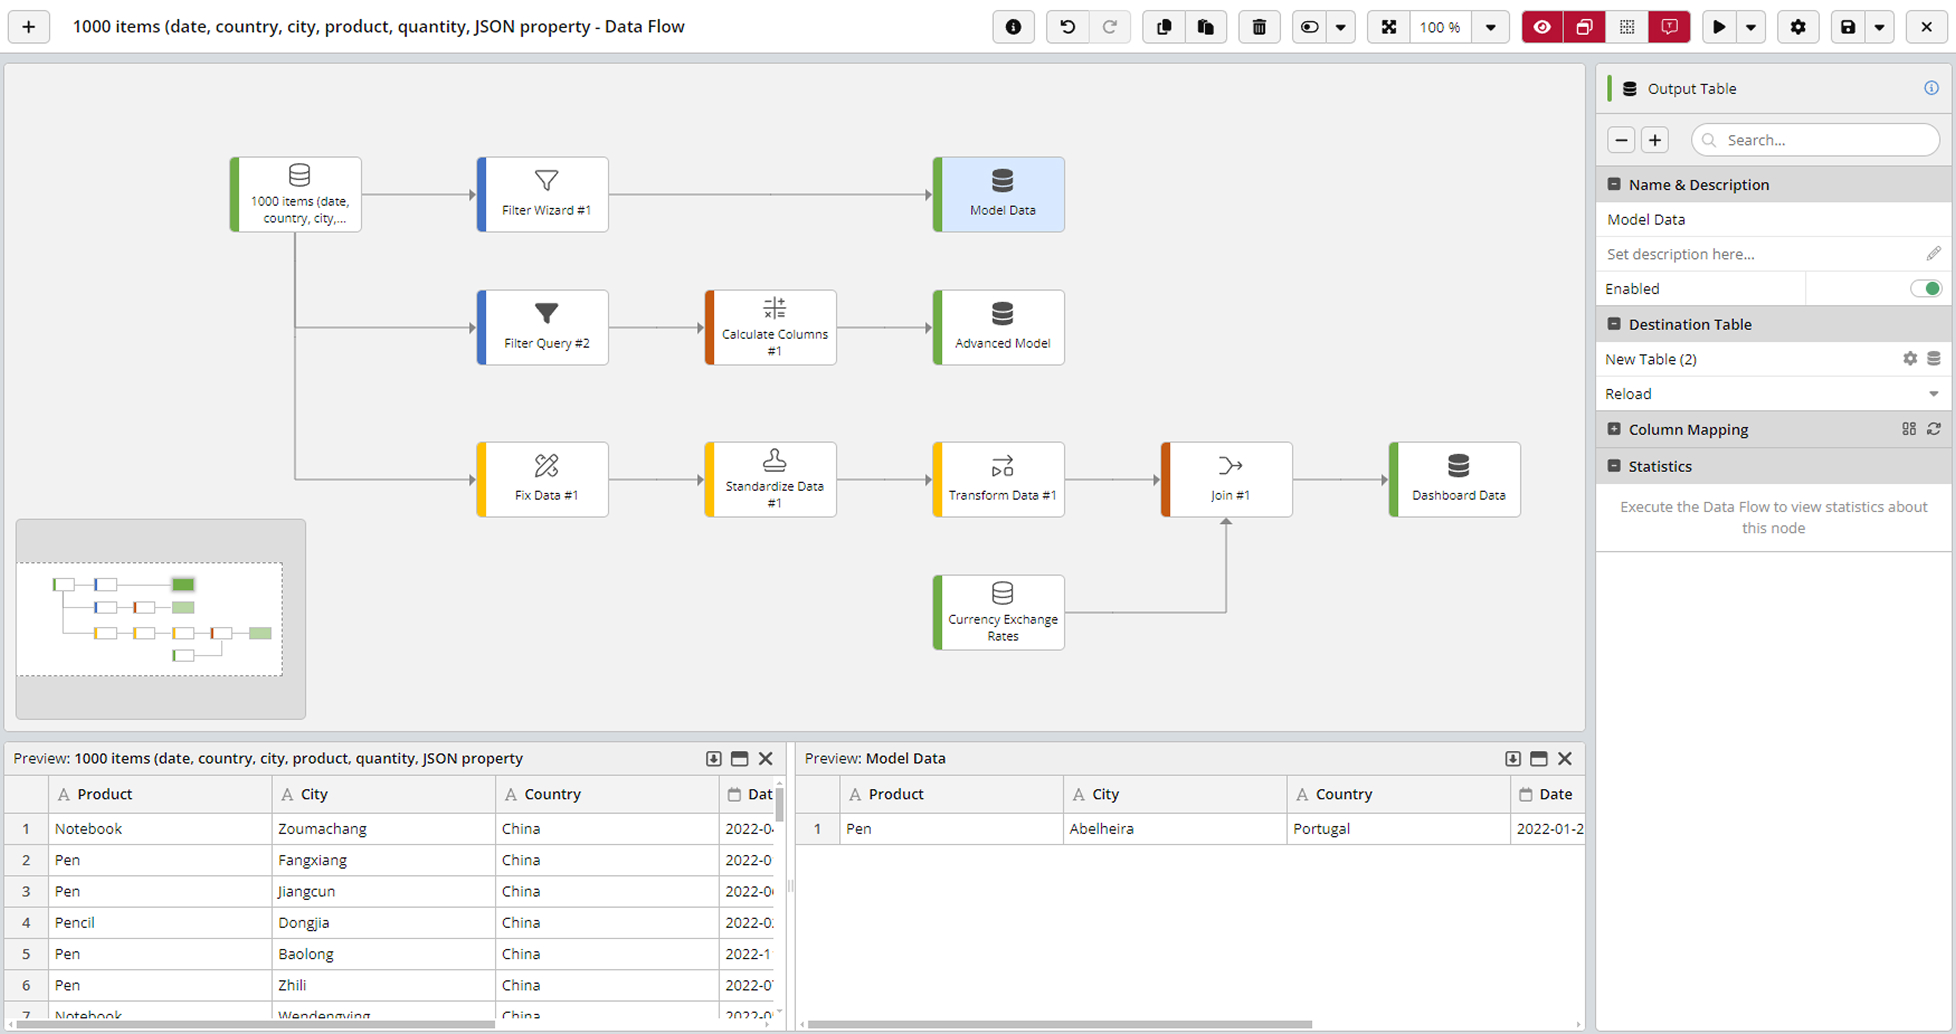
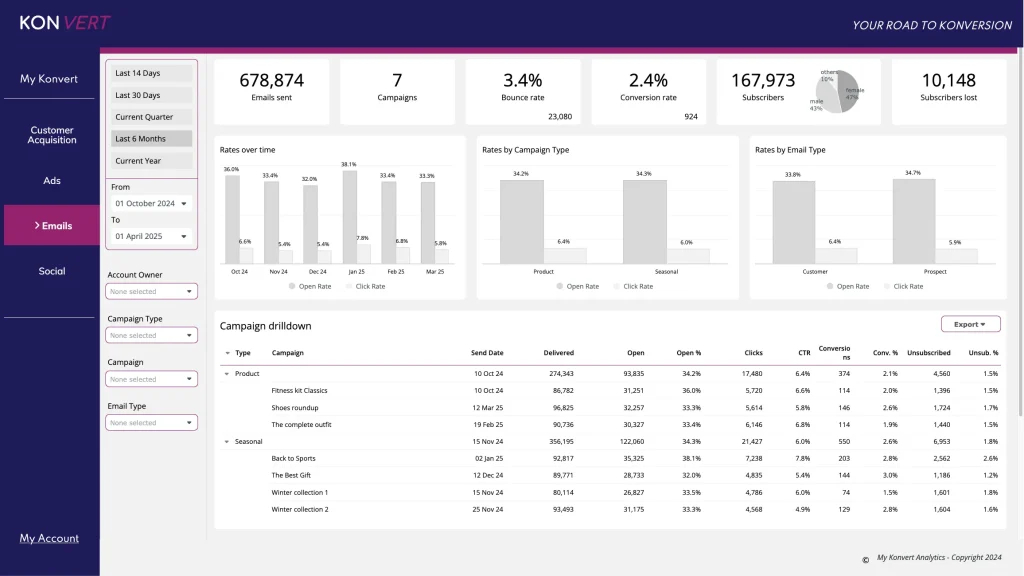
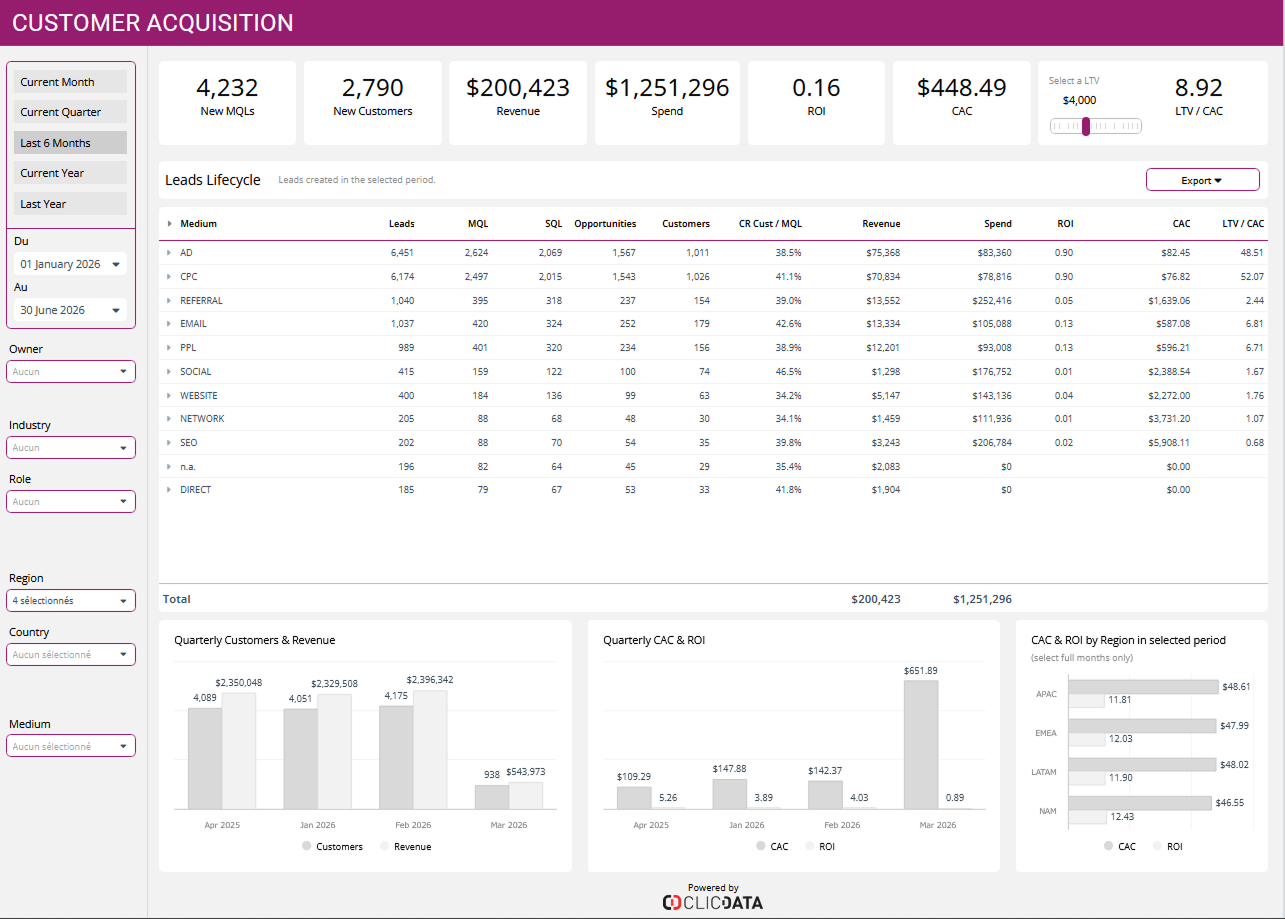
    Product screenshotScreenshot of ClicData's data warehouse where company's data is centralized.Screenshot of Some of ClicData's connectors. 300+ data connections are available.Screenshot of Preview of a joint between datasets from two different sources. Basic or advanced data transformations can be performed with ClicData's ETL features.Screenshot of marketing metrics, from open rates to conversions.Screenshot of an Online Customer Acquisition dashboard example

    Flexmonster Pivot Table & Charts Component Screenshots

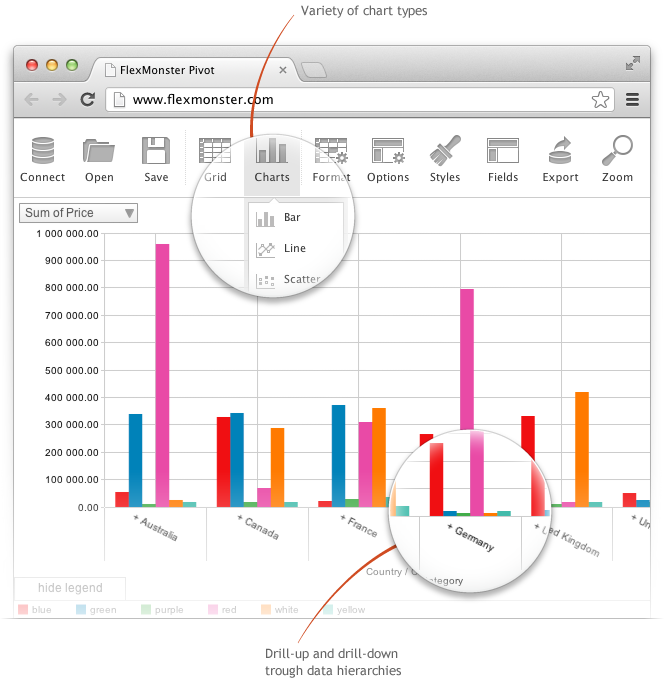
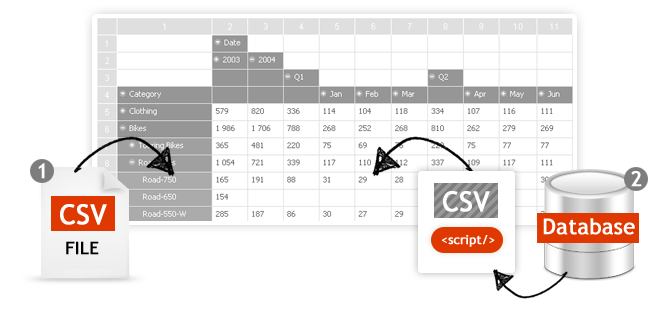
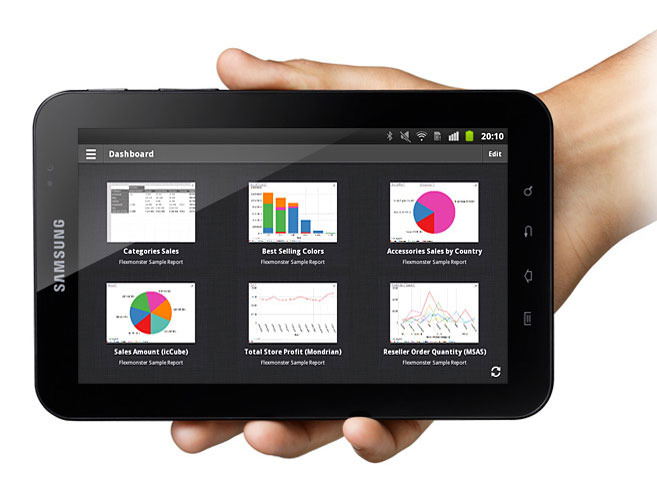
    Screenshot of Pivot Component supports the printing of the Pivot view. Additionally users can export the reports into a variety of formats.Screenshot of Pivot Table Component helps you to create interactive pivot tables and charts reports for web and Flex applications. Pivot Component will provide your customers with an extremely intuitive end-user experience while creating and analyzing reports.Screenshot of Pivot Charts provide an alternative, interactive way to visualize data.Screenshot of The component will connect to any database: MS SQL, MySQL, Oracle, PostgreSQL - using simple script generating CSV output to enable real-time business analysis. Pivot Component is full browser-side component, thus you can use any desired server-side to generate CSV data.Screenshot of Pivot Table Component can connect to OLAP cubes via XMLA protocol. XMLA is XML for Analysis - an industry standard for data access in analytical systems, such as OLAP and Data Mining.Screenshot of Start mobile business reporting with the Flexmonster mobile application. It can be downloaded to your tablets from Google Play or Apple App Store.