Cube vs. Solver
Cube vs. Solver
| Product | Rating | Most Used By | Product Summary | Starting Price |
|---|---|---|---|---|
 Cube | N/A | Cube is a financial planning & analysis (FP&A) platform that aims to enable finance teams to be more strategic and positively contribute to company growth activities by spending less time on manual, repetitive task, from Cube Planning headquartered in New York. | N/A | |
 Solver | N/A | Solver is a cloud-based extended financial planning and analysis solution (xFP&A) that increases access to actionable insights beyond the finance department to accelerate intelligent decisions. | N/A |
| Cube | Solver | |||||||||||||||
|---|---|---|---|---|---|---|---|---|---|---|---|---|---|---|---|---|
| Editions & Modules |
| No answers on this topic | ||||||||||||||
| Offerings |
| |||||||||||||||
| Entry-level Setup Fee | Required | No setup fee | ||||||||||||||
| Additional Details | — | Solver has not provided pricing information for this product or service. This is common practice for software sellers and service providers. Contact Solver to obtain current pricing. | ||||||||||||||
| More Pricing Information | ||||||||||||||||
| Cube | Solver |
|---|
| Cube | Solver | ||||||||||||||||||||||||
|---|---|---|---|---|---|---|---|---|---|---|---|---|---|---|---|---|---|---|---|---|---|---|---|---|---|
| BI Standard Reporting |
| ||||||||||||||||||||||||
| Ad-hoc Reporting |
| ||||||||||||||||||||||||
| Report Output and Scheduling |
| ||||||||||||||||||||||||
| Data Discovery and Visualization |
| ||||||||||||||||||||||||
| Access Control and Security |
| ||||||||||||||||||||||||
| Mobile Capabilities |
| ||||||||||||||||||||||||
| Budgeting, Planning, and Forecasting |
| ||||||||||||||||||||||||
| Consolidation and Close |
| ||||||||||||||||||||||||
| Financial Reporting and Compliance |
| ||||||||||||||||||||||||
| Analytics and Reporting |
| ||||||||||||||||||||||||
| Integration |
|
| Cube | Solver | |
|---|---|---|
| Small Businesses | No answers on this topic | No answers on this topic |
| Medium-sized Companies |  Centage Score 9.4 out of 10 | Cube Score 9.8 out of 10 |
| Enterprises |  OneStream Score 8.8 out of 10 | OneStream Score 8.8 out of 10 |
| All Alternatives | View all alternatives | View all alternatives |
| Cube | Solver | |
|---|---|---|
| Likelihood to Recommend | 9.1 (58 ratings) | 10.0 (2 ratings) |
| Cube | Solver | |
|---|---|---|
| Likelihood to Recommend | Cube Planning, Inc
| Solver
|
| Pros | Cube Planning, Inc
| Solver
|
| Cons | Cube Planning, Inc
 Guneet Oberoi Sr FP&A Analyst | Solver
|
| Alternatives Considered | Cube Planning, Inc
| Solver
|
| Return on Investment | Cube Planning, Inc
| Solver
|
| ScreenShots | Solver Screenshots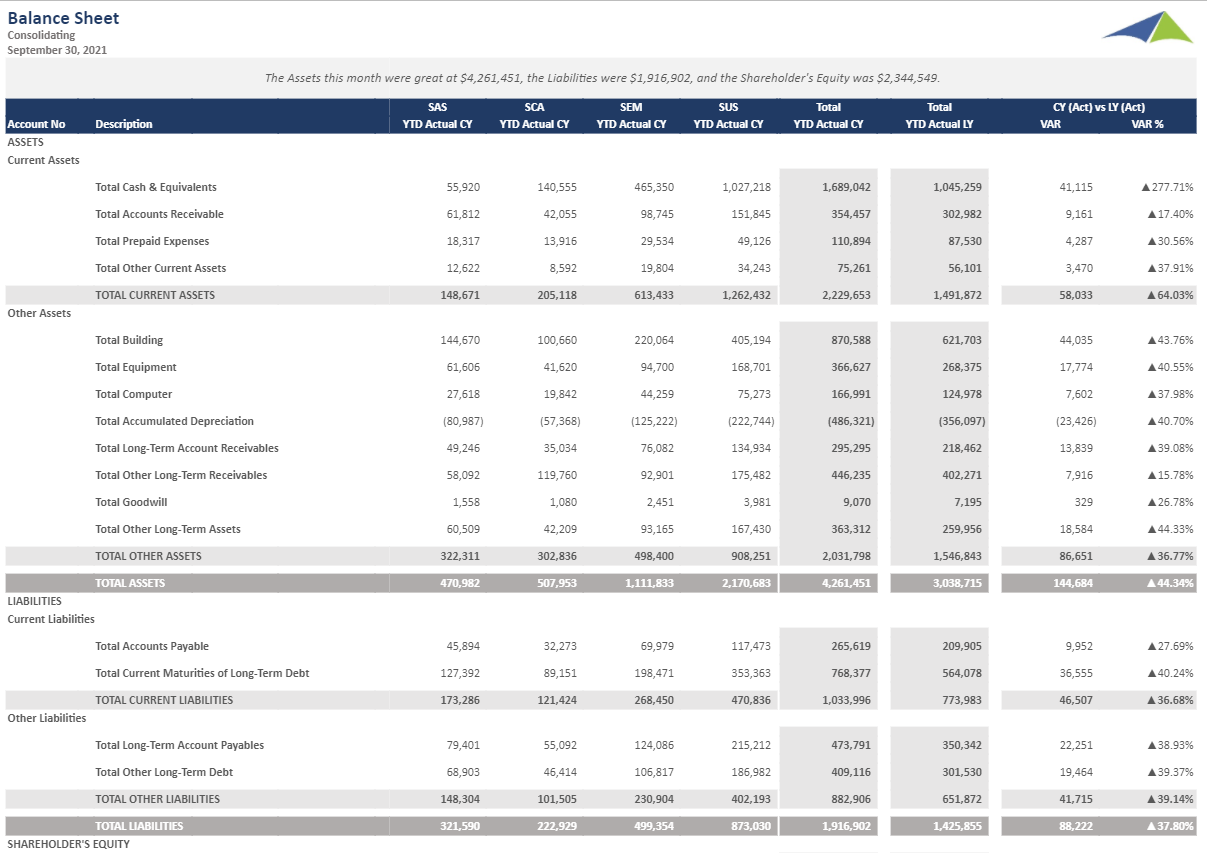 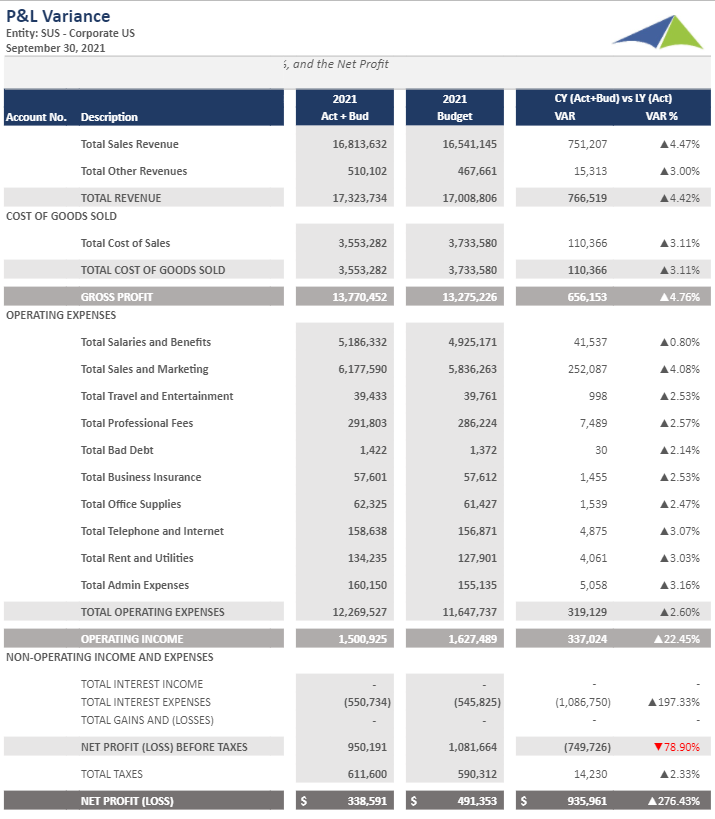 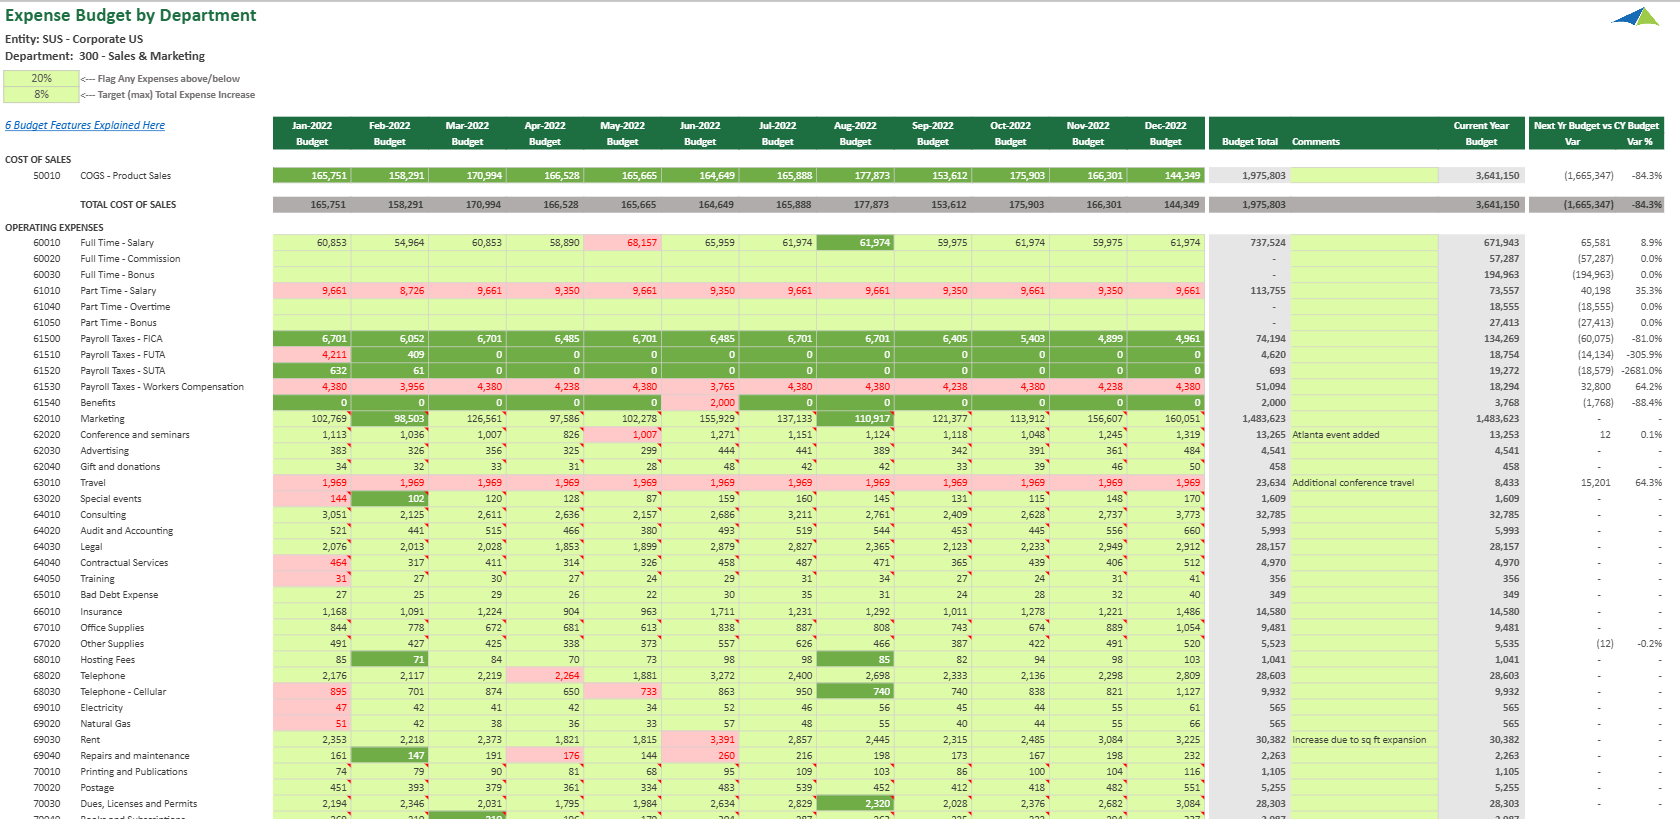 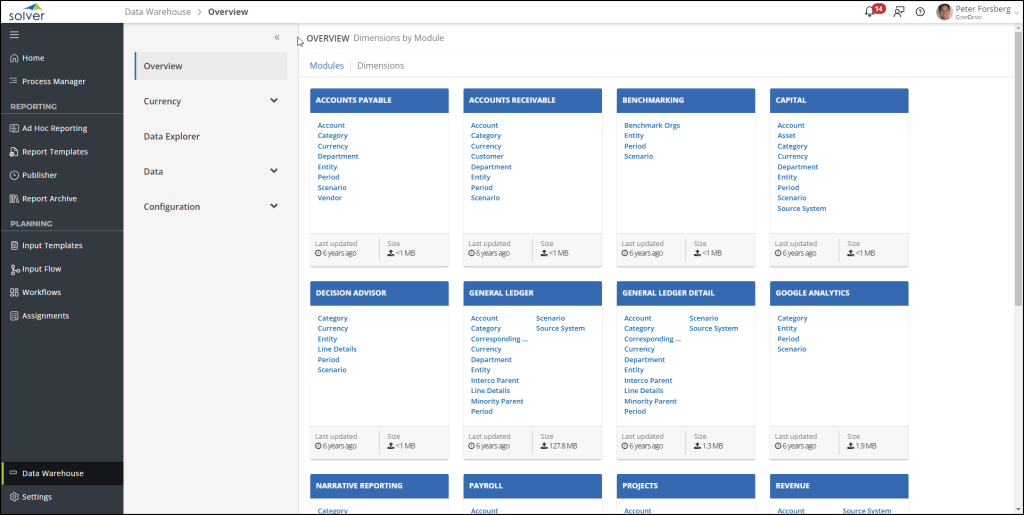 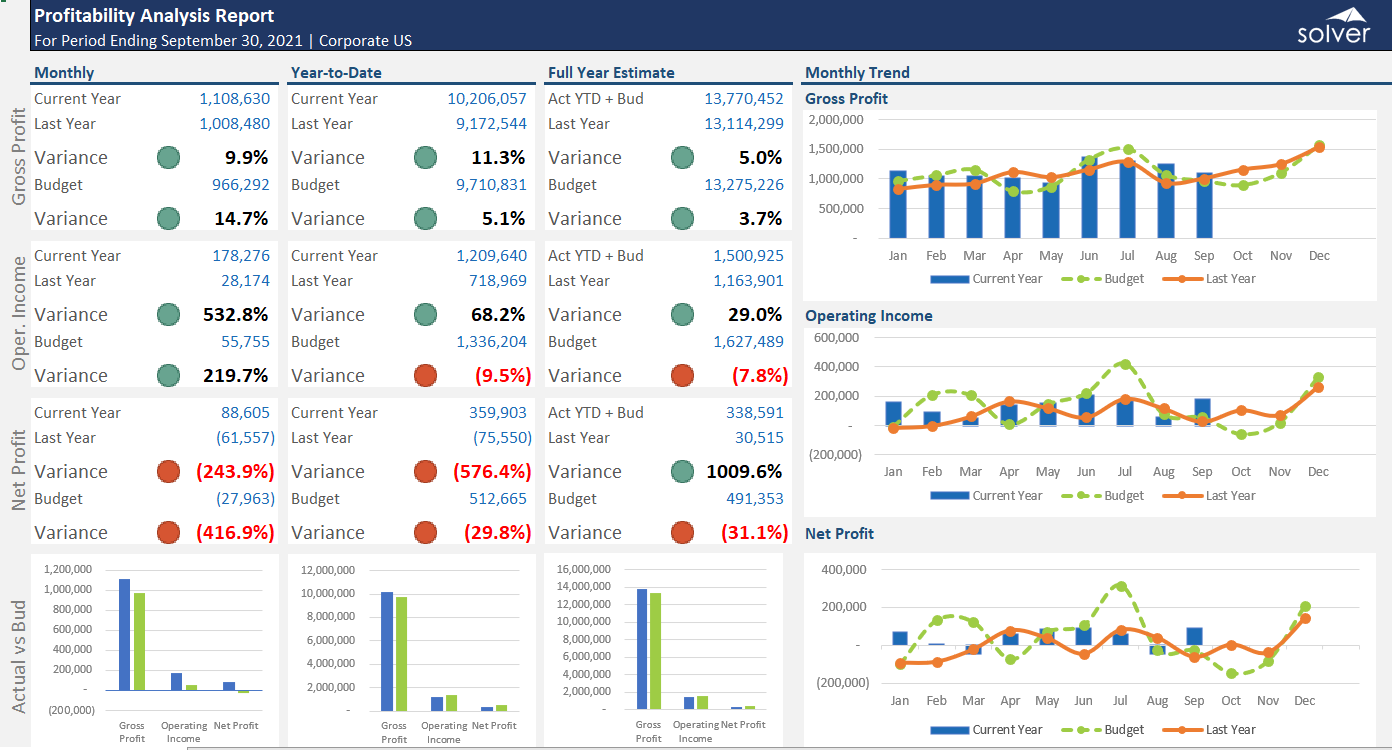 |