Chose D3.js
D3.js gives a better aesthetic feel on the charts and as a developer, it gives more options to customize on the charts.

| Product | Rating | Most Used By | Product Summary | Starting Price |
|---|---|---|---|---|
 D3.js | N/A | D3.js is a JavaScript library for manipulating documents based on data. | N/A | |
 PivotData Microservice | N/A | PivotData Microservice is an on-premise NET6 app that provides a web API for tabular reports generation (pivot tables, data grids). It may be hosted either on Windows or Linux. Some key features include: direct connection to all popular SQL databases / some NoSQL (MongoDb, ElasticSearch) data sources and cube models are configured via JSON config advanced web-based pivot tables formula measures and report parameters transparent… | $999 per year per installation |
| D3.js | PivotData Microservice | |||||||||||||||
|---|---|---|---|---|---|---|---|---|---|---|---|---|---|---|---|---|
| Editions & Modules | No answers on this topic |
| ||||||||||||||
| Offerings |
| |||||||||||||||
| Entry-level Setup Fee | No setup fee | Optional | ||||||||||||||
| Additional Details | — | Custom licensing conditions are possible. | ||||||||||||||
| More Pricing Information | ||||||||||||||||
| D3.js | PivotData Microservice | |
|---|---|---|
| Considered Both Products |  D3.js  Sanyam Jain Freelancer in RPA Chose D3.js Python libraries and Tableau do not provide much flexibility in data visualization.  Firaz Peer Fellow Chose D3.js Protoviz does not require as much knowledge of programming to build visualizations as with D3.js or Google Charts. Highcharts or AnyChart are other alternatives that are more specific to building charts only. |  PivotData Microservice No answer on this topic |
| D3.js | PivotData Microservice | |
|---|---|---|
| Small Businesses |  React (React.js) Score 8.9 out of 10 | React (React.js) Score 8.9 out of 10 |
| Medium-sized Companies | React (React.js) Score 8.9 out of 10 | React (React.js) Score 8.9 out of 10 |
| Enterprises | React (React.js) Score 8.9 out of 10 | React (React.js) Score 8.9 out of 10 |
| All Alternatives | View all alternatives | View all alternatives |
| D3.js | PivotData Microservice | |
|---|---|---|
| Likelihood to Recommend | 8.9 (0 ratings) | - (0 ratings) |
| Support Rating | 8.0 (0 ratings) | - (0 ratings) |
| D3.js | PivotData Microservice | |
|---|---|---|
| Likelihood to Recommend |
Firaz Peer Fellow | No answers on this topic |
| Pros |
| No answers on this topic |
| Cons |
Firaz Peer Fellow | No answers on this topic |
| Support Rating |
| No answers on this topic |
| Alternatives Considered |
| No answers on this topic |
| Return on Investment |
Sanyam Jain Freelancer in RPA | No answers on this topic |
| ScreenShots | PivotData Microservice Screenshots  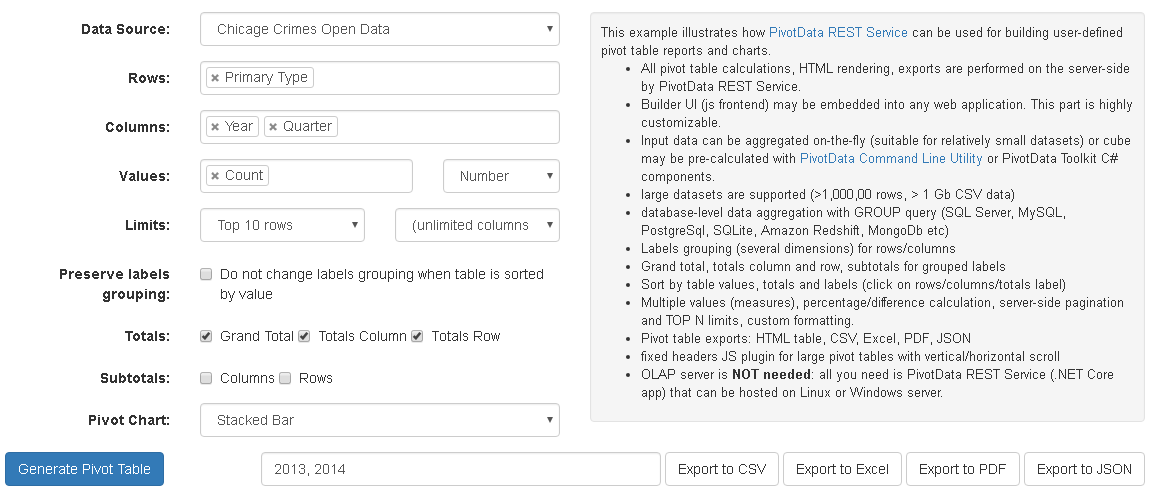 |