
DataRPM (discontinued) vs. SAS Visual Analytics
| Product | Rating | Most Used By | Product Summary | Starting Price |
|---|---|---|---|---|
 DataRPM (discontinued) | Score7 out of 10 | N/A | DataRPM from Progress Software was smart machine analytics for Big Data. Leveraging the power of cognitive computing, DataRPM aimed to solve the problems that traditional, manual approaches could not by automating mundane tasks, thereby freeing data scientists and analysts to draw meaningful conclusions from the data sooner. DataRPM has been discontinued. | $4,000 Per Month (unlimited seats) |
 SAS Visual Analytics | Score7.8 out of 10 | Enterprise companies (1,001+ employees) | SAS Visual Analytics provides a complete platform for analytics visualization, enabling users to identify patterns and relationships in data that weren't initially evident. Interactive, self-service BI and reporting capabilities are combined with out-of-the-box advanced analytics so everyone can discover insights from any size and type of data, including text. | N/A |
| DataRPM (discontinued) | SAS Visual Analytics | |||||||||||||||
|---|---|---|---|---|---|---|---|---|---|---|---|---|---|---|---|---|
| Editions & Modules |
|
| ||||||||||||||
| Offerings |
| |||||||||||||||
| Entry-level Setup Fee | No setup fee | No setup fee | ||||||||||||||
| Additional Details | List pricing is 12 month subsciption. 10% discount for 24 month term, 20% discount for 36 month term. We support virtual or physical server deployments. No difference in pricing between virtual or physical nodes. We offer 'Unlimited users' in every subscription. Pricing model is based on the amount of data indexed and analyzed. Subscribers have a data cap- they may use the product as much as they want with as many data sources they want as long as the concurrent usage is at or under their edition's data cap. | SAS Visual Statistics and SAS Office Analytics are also available as add-ons. | ||||||||||||||
| More Pricing Information | ||||||||||||||||
| DataRPM (discontinued) | SAS Visual Analytics | ||||||||||||||||||||||
|---|---|---|---|---|---|---|---|---|---|---|---|---|---|---|---|---|---|---|---|---|---|---|---|
| BI Standard Reporting |
| ||||||||||||||||||||||
| Ad-hoc Reporting |
| ||||||||||||||||||||||
| Report Output and Scheduling |
| ||||||||||||||||||||||
| Data Discovery and Visualization |
| ||||||||||||||||||||||
| Access Control and Security |
| ||||||||||||||||||||||
| Mobile Capabilities |
| ||||||||||||||||||||||
| Application Program Interfaces (APIs) / Embedding |
| ||||||||||||||||||||||
| DataRPM (discontinued) | SAS Visual Analytics | |
|---|---|---|
| Small Businesses |  Cyfe Score4 out of 10 | Cyfe Score4 out of 10 |
| Medium-sized Companies |  Qlik Cloud Analytics (Qlik Sense) Score8.2 out of 10 | Qlik Cloud Analytics (Qlik Sense) Score8.2 out of 10 |
| Enterprises |  Jaspersoft Community Edition Score7 out of 10 | Jaspersoft Community Edition Score7 out of 10 |
| All Alternatives | View all alternatives | View all alternatives |
| DataRPM (discontinued) | SAS Visual Analytics | |
|---|---|---|
| Likelihood to Recommend | - | 9.0 |
| Likelihood to Renew | - | 9.3 |
| Usability | - | 6.0 |
| Support Rating | - | 8.0 |
| Data Sharing and Collaboration | - | 9.6 |
| Data Sources | - | 9.8 |
| DataRPM (discontinued) | SAS Visual Analytics | |
|---|---|---|
| Likelihood to Recommend | No answers on this topic |
|
| Pros | No answers on this topic |
|
| Cons | No answers on this topic |
|
| Likelihood to Renew | No answers on this topic |
|
| Usability | No answers on this topic |
|
| Support Rating | No answers on this topic |
|
| Alternatives Considered | No answers on this topic |
|
| Return on Investment | No answers on this topic |
|
| ScreenShots | DataRPM (discontinued) Screenshots | SAS Visual Analytics Screenshots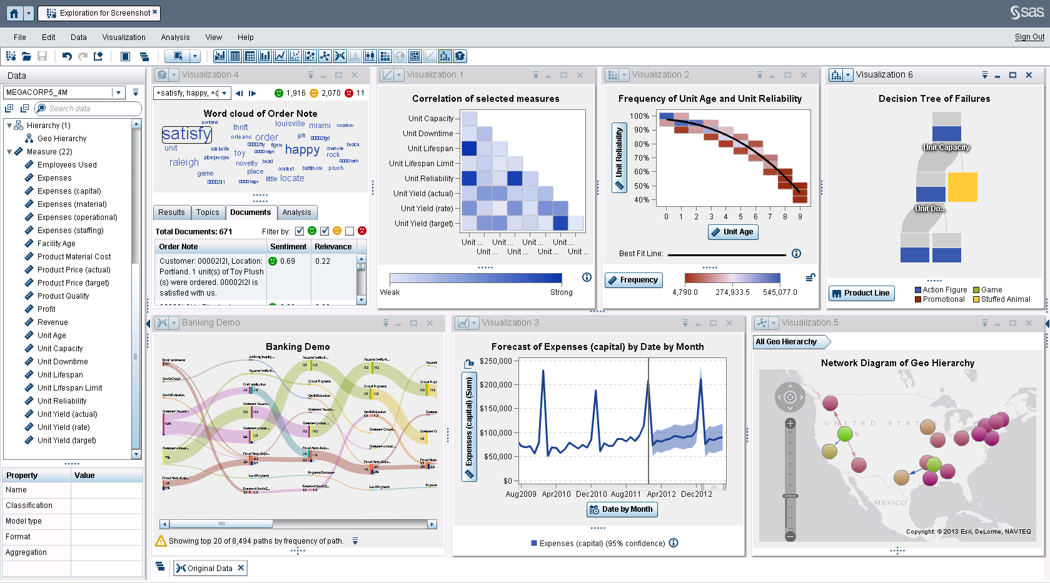 |


