
DXcharts vs. Epicor Grow
| Product | Rating | Most Used By | Product Summary | Starting Price |
|---|---|---|---|---|
 DXcharts | N/A | N/A | DXcharts is an interface for technical analysis and market data visualization of multiple asset classes both in real-time and retroactively. The user can make changes in the UI or create a completely new custom interface. Devexperts offer a free-of-charge, a paid SaaS and a full-access lifetime options. Data feeds with futures and indices, equities, FX and cryptocurrencies is already available out of the box, just sign with dxFeed. Native solutions for all platforms: - web -… | $1,500 |
 Epicor Grow | Score6.3 out of 10 | Small Businesses (1-50 employees) | Grow, from Epicor since the March 2022 acquisition, is a business intelligence software that is designed to empower businesses to become data-driven and accelerate growth by aligning team objectives and inspiring strategic decisions. | N/A |
| DXcharts | Epicor Grow | |||||||||||||||
|---|---|---|---|---|---|---|---|---|---|---|---|---|---|---|---|---|
| Editions & Modules | No answers on this topic | No answers on this topic | ||||||||||||||
| Offerings |
| |||||||||||||||
| Entry-level Setup Fee | No setup fee | Required | ||||||||||||||
| Additional Details | — | — | ||||||||||||||
| More Pricing Information | ||||||||||||||||
| DXcharts | Epicor Grow | |
|---|---|---|
| Considered Both Products | No answer on this topic | No answer on this topic |
| Key User Insights | ||
| Would buy again | ||
No answers on this topic | 100% Would buy again 6 Answers | |
| Delivers good value for the price | ||
No answers on this topic | 100% Delivers good value for the price 6 Answers | |
| Happy with the feature set | ||
No answers on this topic | 83% Happy with the feature set 5 Answers | |
| Lived up to sales and marketing promises | ||
No answers on this topic | 100% Lived up to sales and marketing promises 5 Answers | |
| Implementation went as expected | ||
No answers on this topic | 100% Implementation went as expected 6 Answers | |
| DXcharts | Epicor Grow | |||||||||||||||||||
|---|---|---|---|---|---|---|---|---|---|---|---|---|---|---|---|---|---|---|---|---|
| BI Standard Reporting |
| |||||||||||||||||||
| Ad-hoc Reporting |
| |||||||||||||||||||
| Report Output and Scheduling |
| |||||||||||||||||||
| Data Discovery and Visualization |
| |||||||||||||||||||
| Access Control and Security |
| |||||||||||||||||||
| Mobile Capabilities |
| |||||||||||||||||||
| Application Program Interfaces (APIs) / Embedding |
| |||||||||||||||||||
| DXcharts | Epicor Grow | |
|---|---|---|
| Small Businesses |  Chartio (discontinued) Score7.5 out of 10 |  Cyfe Score4 out of 10 |
| Medium-sized Companies |  Jet Reports Score9.5 out of 10 |  Qlik Cloud Analytics (Qlik Sense) Score8.1 out of 10 |
| Enterprises |  Kibana Score8.4 out of 10 |  Sisense Score6.9 out of 10 |
| All Alternatives | View all alternatives | View all alternatives |
| DXcharts | Epicor Grow | |
|---|---|---|
| Likelihood to Recommend | - | 8.0 |
| Usability | - | 7.1 |
| Support Rating | - | 9.4 |
| Data Sharing and Collaboration | - | 10.0 |
| Data Sources | - | 7.1 |
| DXcharts | Epicor Grow | |
|---|---|---|
| Likelihood to Recommend | No answers on this topic |
|
| Pros | No answers on this topic |
|
| Cons | No answers on this topic |
|
| Usability | No answers on this topic |
|
| Support Rating | No answers on this topic |
|
| Alternatives Considered | No answers on this topic |
|
| Return on Investment | No answers on this topic |
|
| ScreenShots | DXcharts Screenshots    | Epicor Grow Screenshots  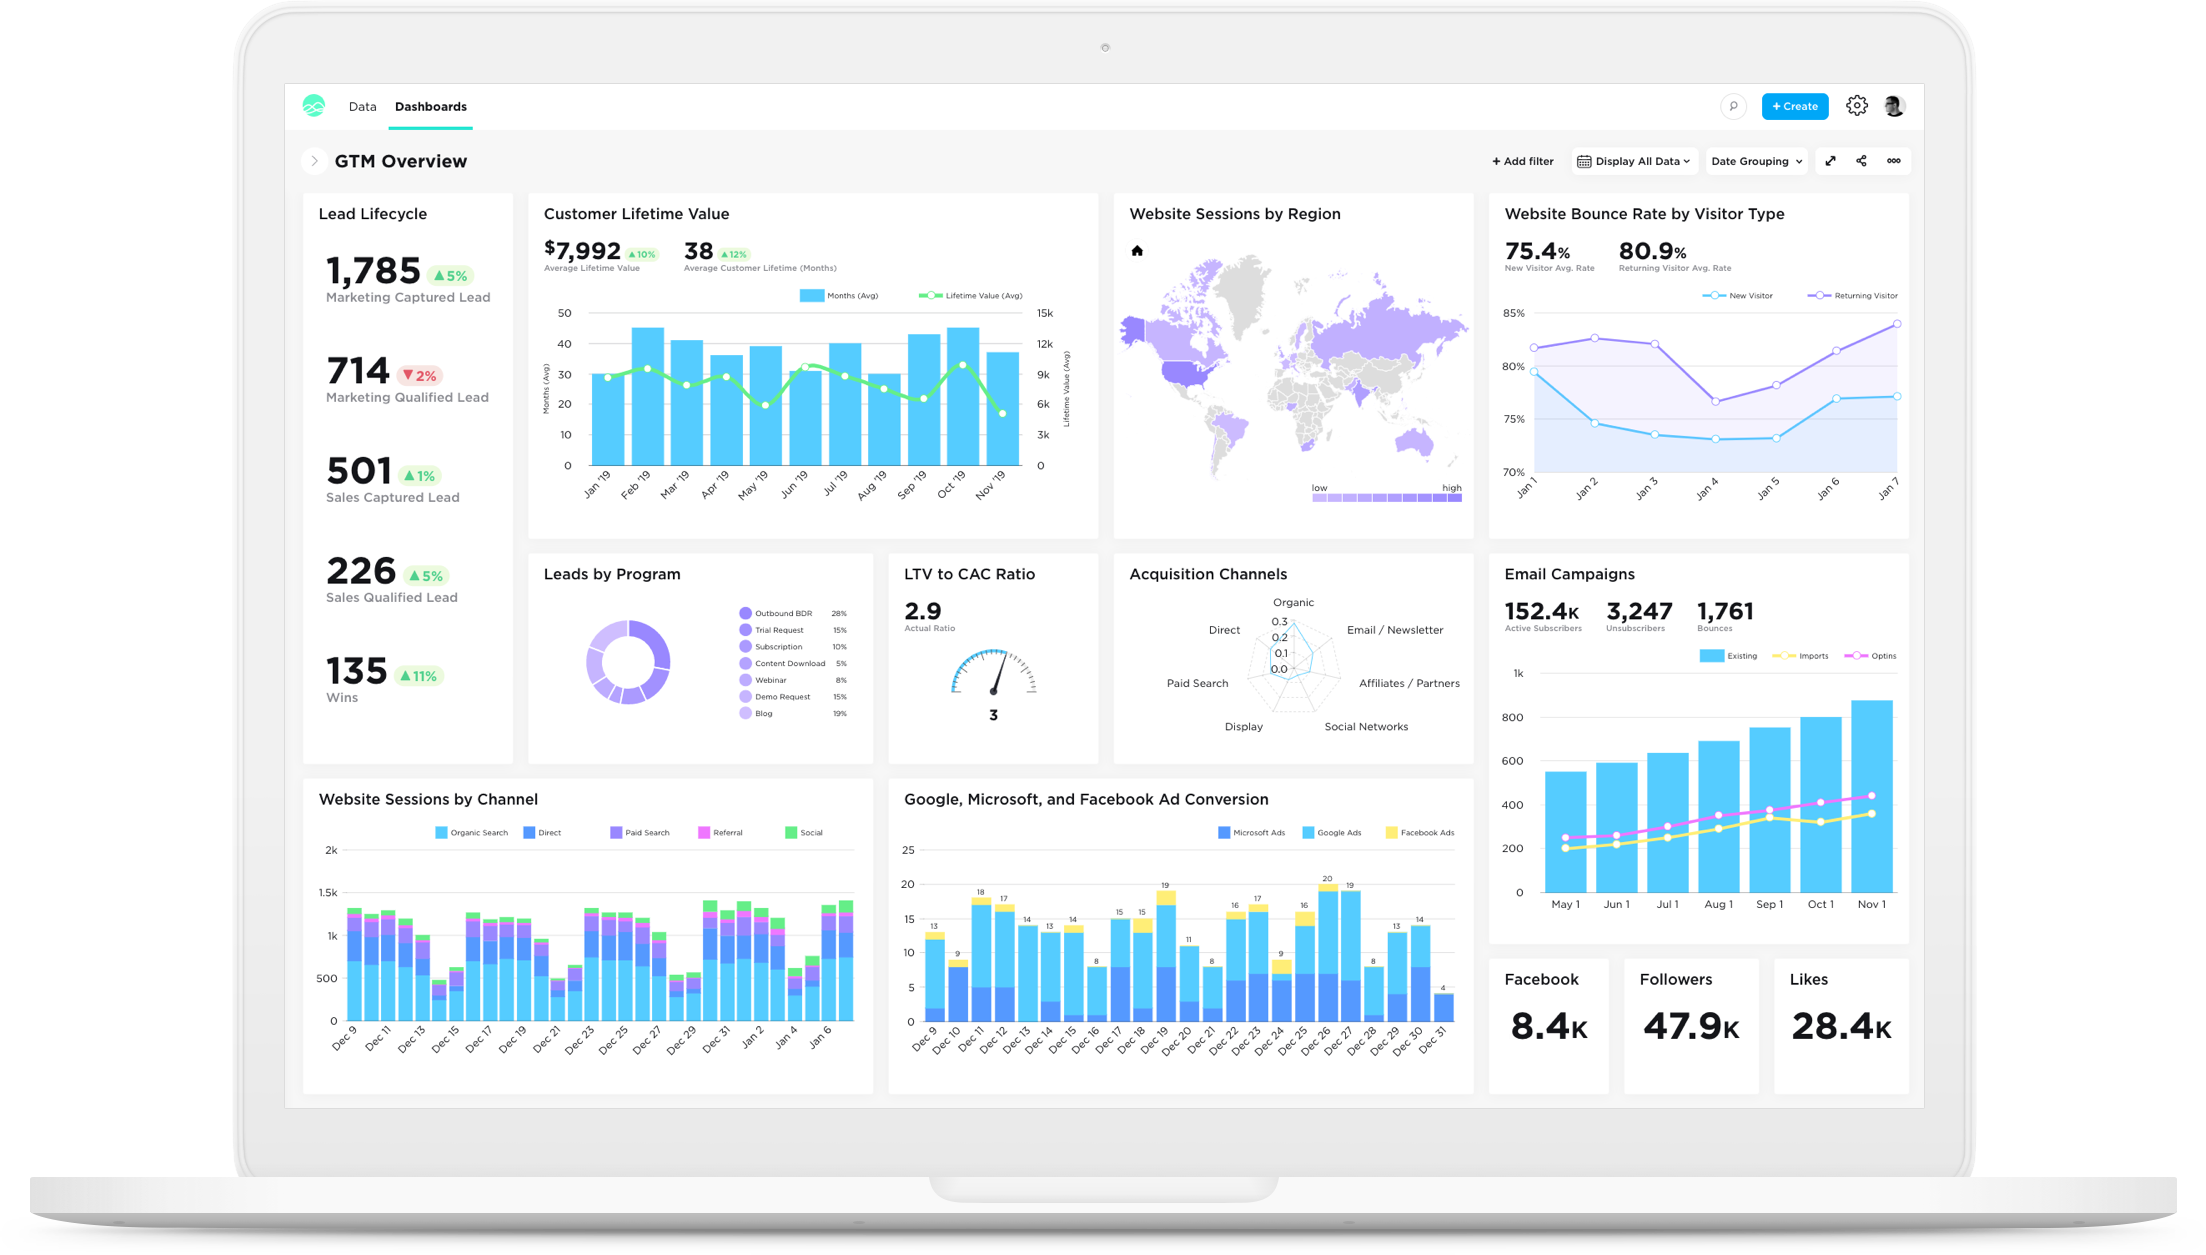 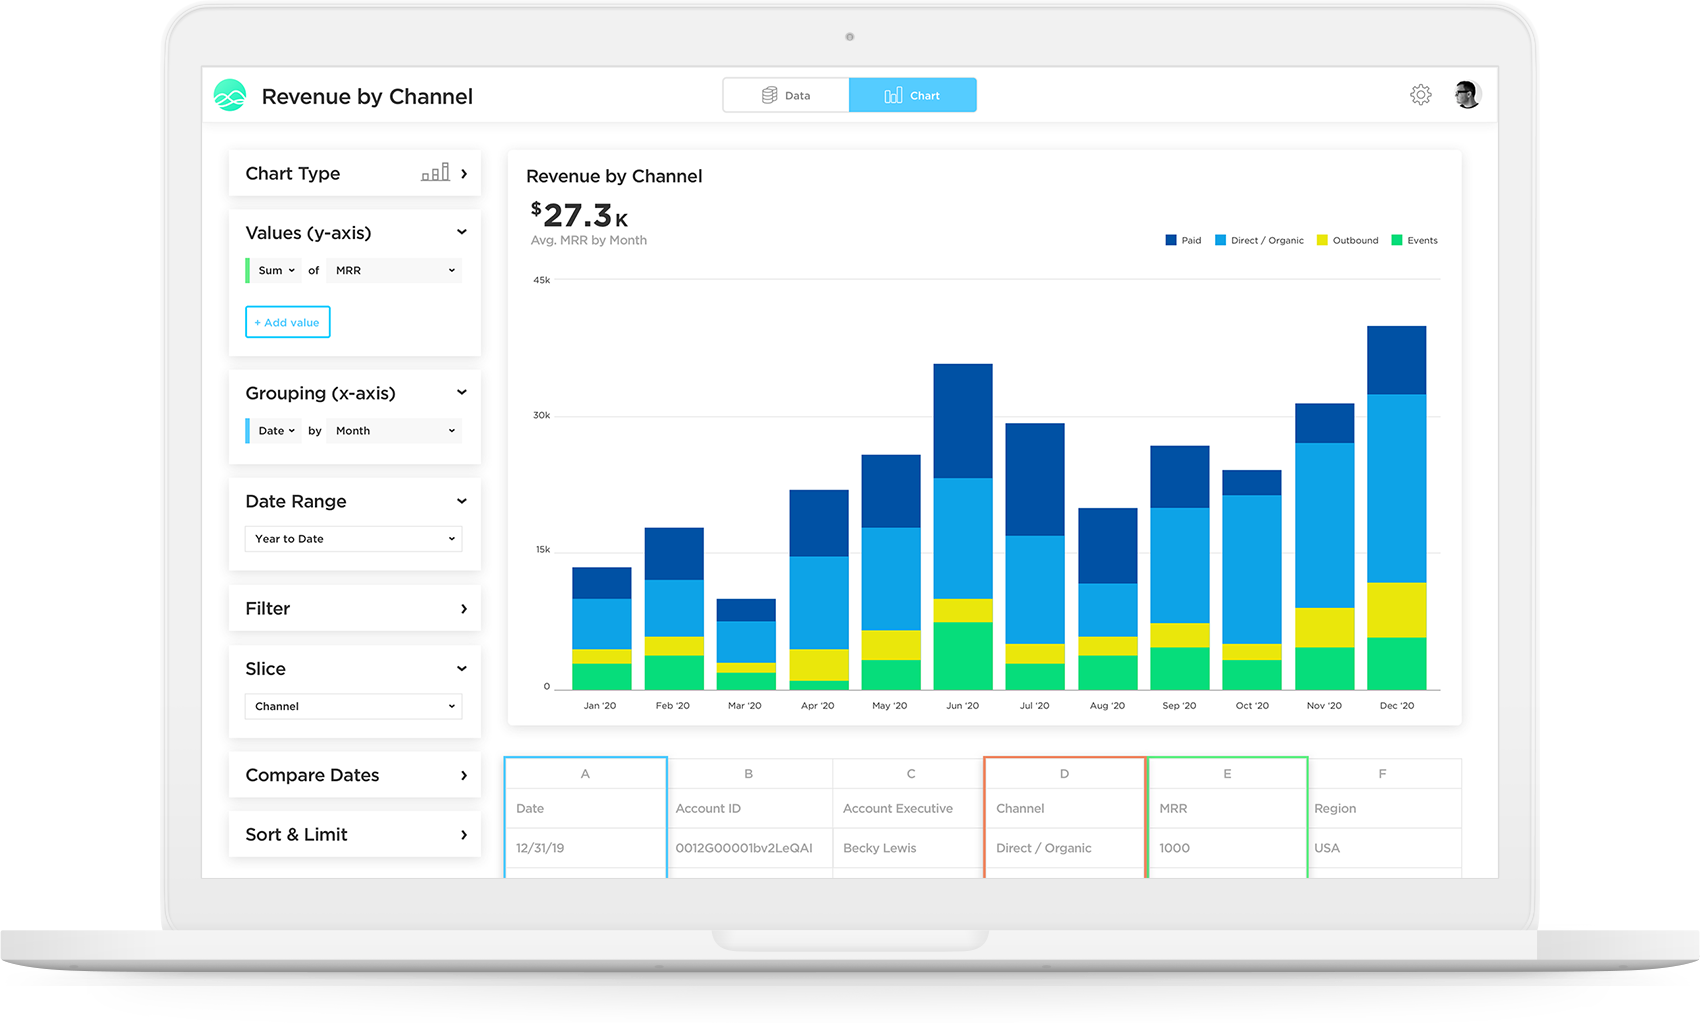 |



