Fliptop (Discontinued Product) vs. Predicte.com
Fliptop (Discontinued Product) vs. Predicte.com
| Product | Rating | Most Used By | Product Summary | Starting Price |
|---|---|---|---|---|
 Fliptop (Discontinued Product) | N/A | Fliptop was a predictive analytics application combining public web data with internal CRM and marketing data to score leads, identify target companies and trigger marketing actions. Fliptop was acquired by LinkedIn in 2015 and integrated with LinkedIn products. Fliptop is no longer available as a standalone product. | N/A | |
 Predicte.com | Small Businesses (1-50 employees) | Predicte offers real-time predicive insights from product, sales, and client data. By unifying disparate data sources within its Data Platform (Analytics), Predicte empowers distributors, wholesalers and manufacturers to forecast sales with greater accuracy, detect churn risks before they escalate, and deliver tailored recommendations. The platform’s analytics framework helps teams optimize product usage, enhance sales performance, and continuously improve client outcomes through its… | N/A |
| Fliptop (Discontinued Product) | Predicte.com | |||||||||||||||
|---|---|---|---|---|---|---|---|---|---|---|---|---|---|---|---|---|
| Editions & Modules | No answers on this topic | No answers on this topic | ||||||||||||||
| Offerings |
| |||||||||||||||
| Entry-level Setup Fee | No setup fee | Required | ||||||||||||||
| Additional Details | — | — | ||||||||||||||
| More Pricing Information | ||||||||||||||||
| Fliptop (Discontinued Product) | Predicte.com |
|---|
| Fliptop (Discontinued Product) | Predicte.com | |
|---|---|---|
| Small Businesses |  Mediafly Score 7.7 out of 10 | Mediafly Score 7.7 out of 10 |
| Medium-sized Companies |  Clari Score 8.6 out of 10 | Clari Score 8.6 out of 10 |
| Enterprises | Clari Score 8.6 out of 10 | Clari Score 8.6 out of 10 |
| All Alternatives | View all alternatives | View all alternatives |
| Fliptop (Discontinued Product) | Predicte.com | |
|---|---|---|
| Likelihood to Recommend | 8.2 (1 ratings) | - (0 ratings) |
| Fliptop (Discontinued Product) | Predicte.com | |
|---|---|---|
| Likelihood to Recommend | Discontinued Products
 Mark Farnell Marketing Operations Director | Predicte.com No answers on this topic |
| Pros | Discontinued Products
Mark Farnell Marketing Operations Director | Predicte.com No answers on this topic |
| Cons | Discontinued Products
Mark Farnell Marketing Operations Director | Predicte.com No answers on this topic |
| Alternatives Considered | Discontinued Products
Mark Farnell Marketing Operations Director | Predicte.com No answers on this topic |
| Return on Investment | Discontinued Products
Mark Farnell Marketing Operations Director | Predicte.com No answers on this topic |
| ScreenShots | Predicte.com Screenshots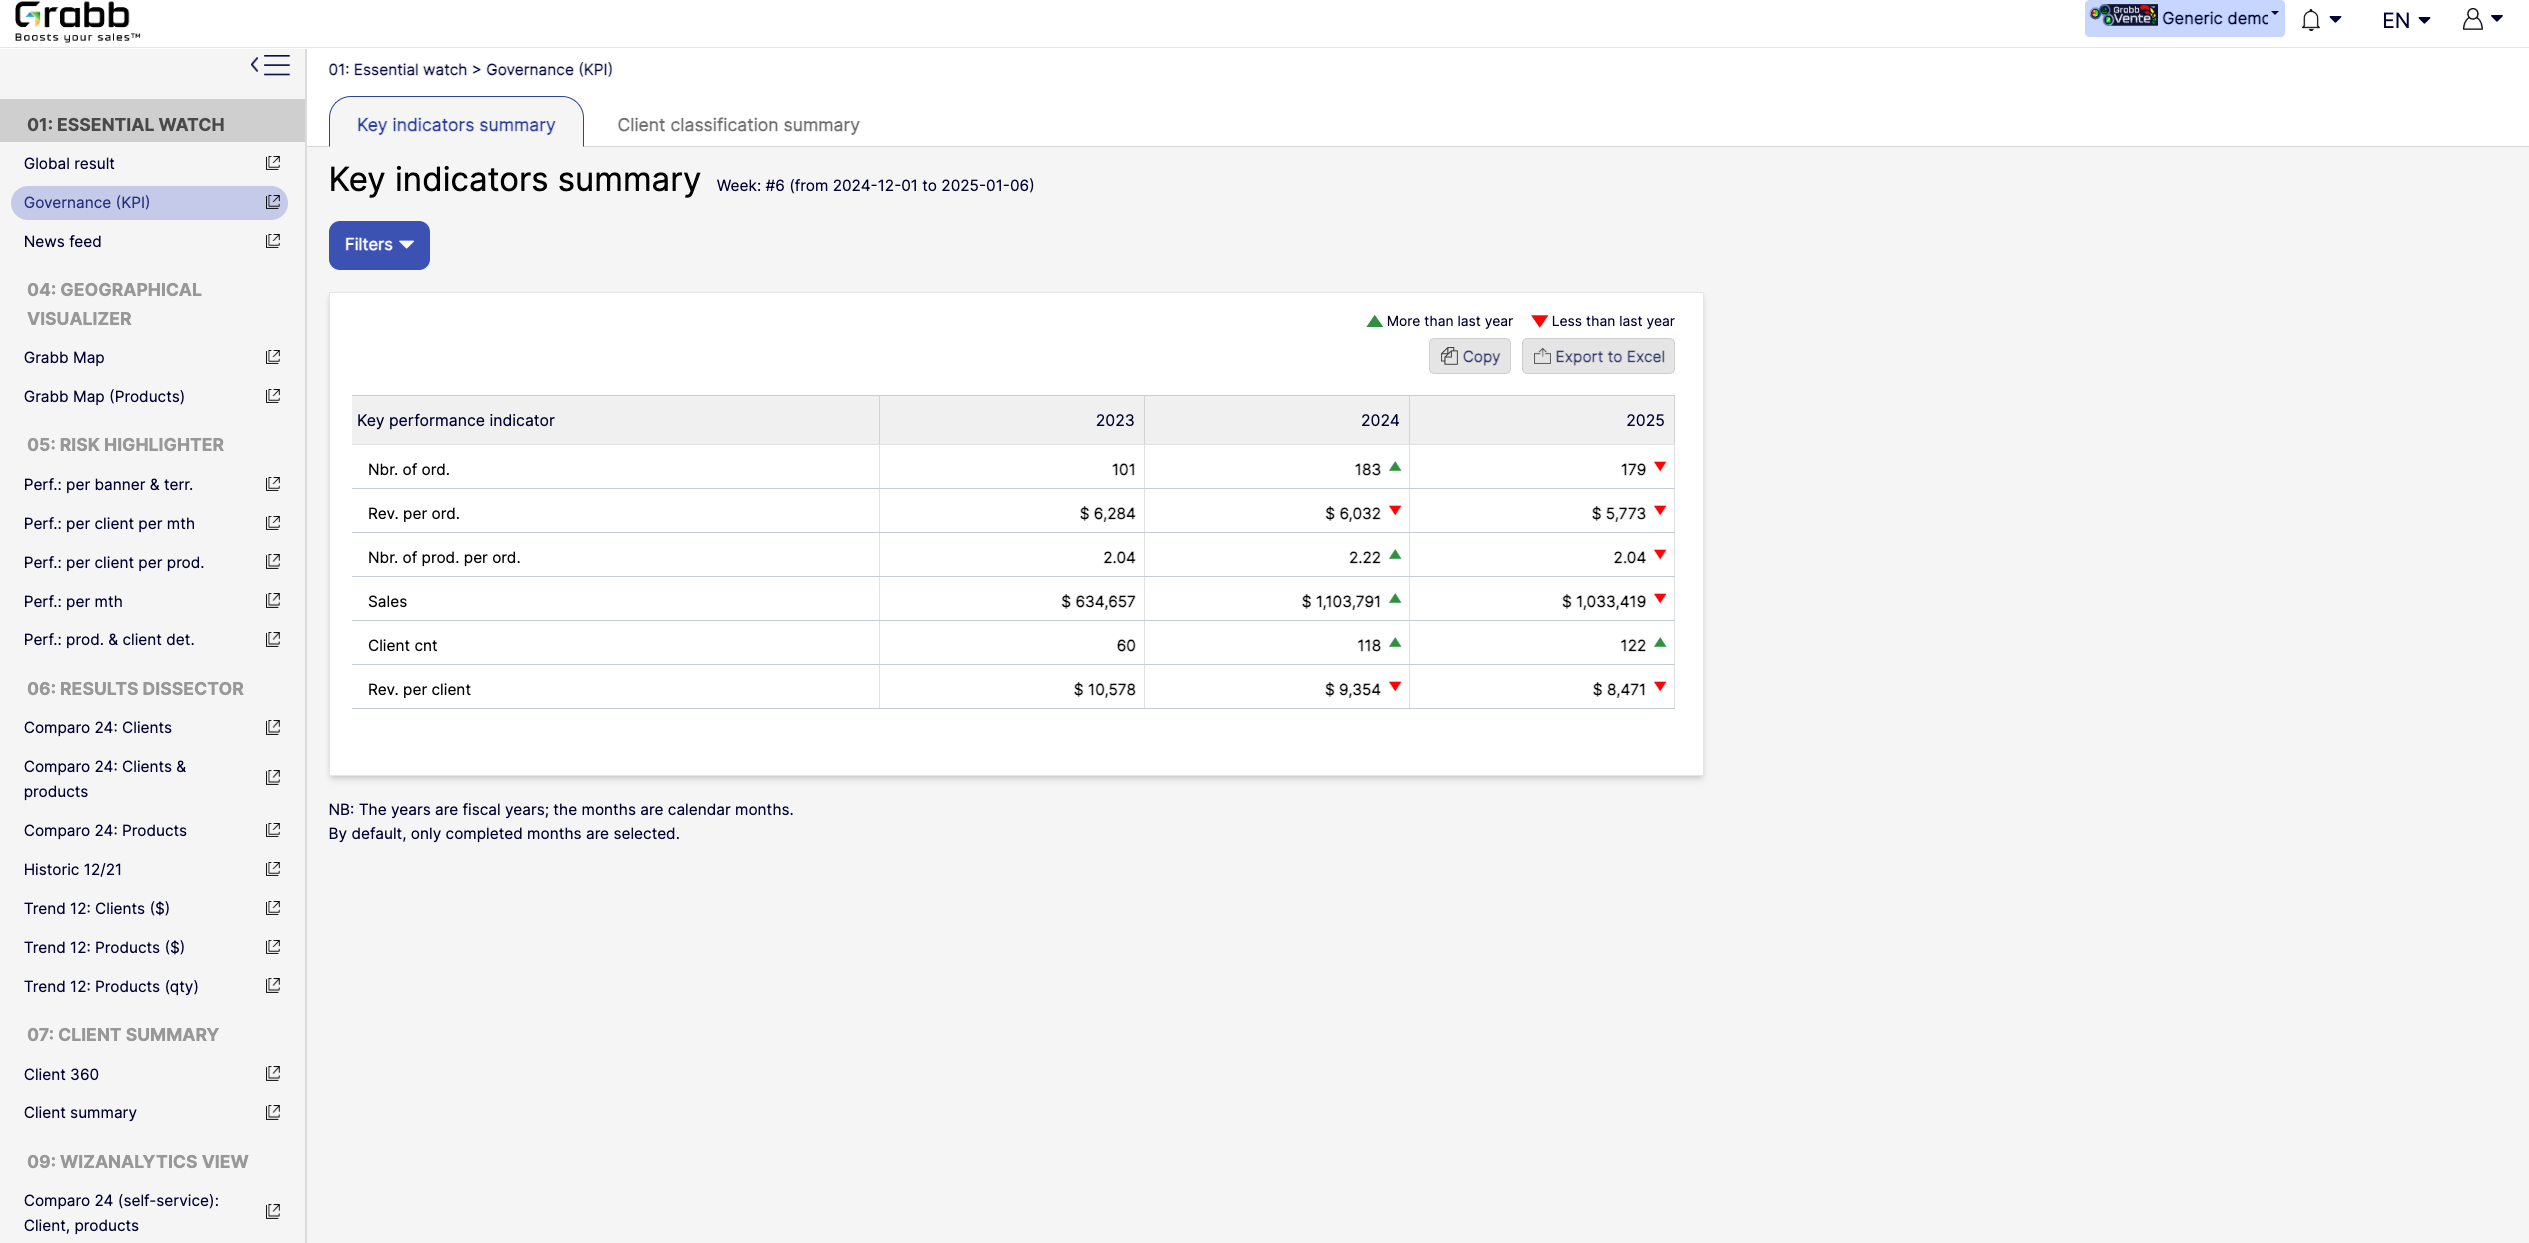 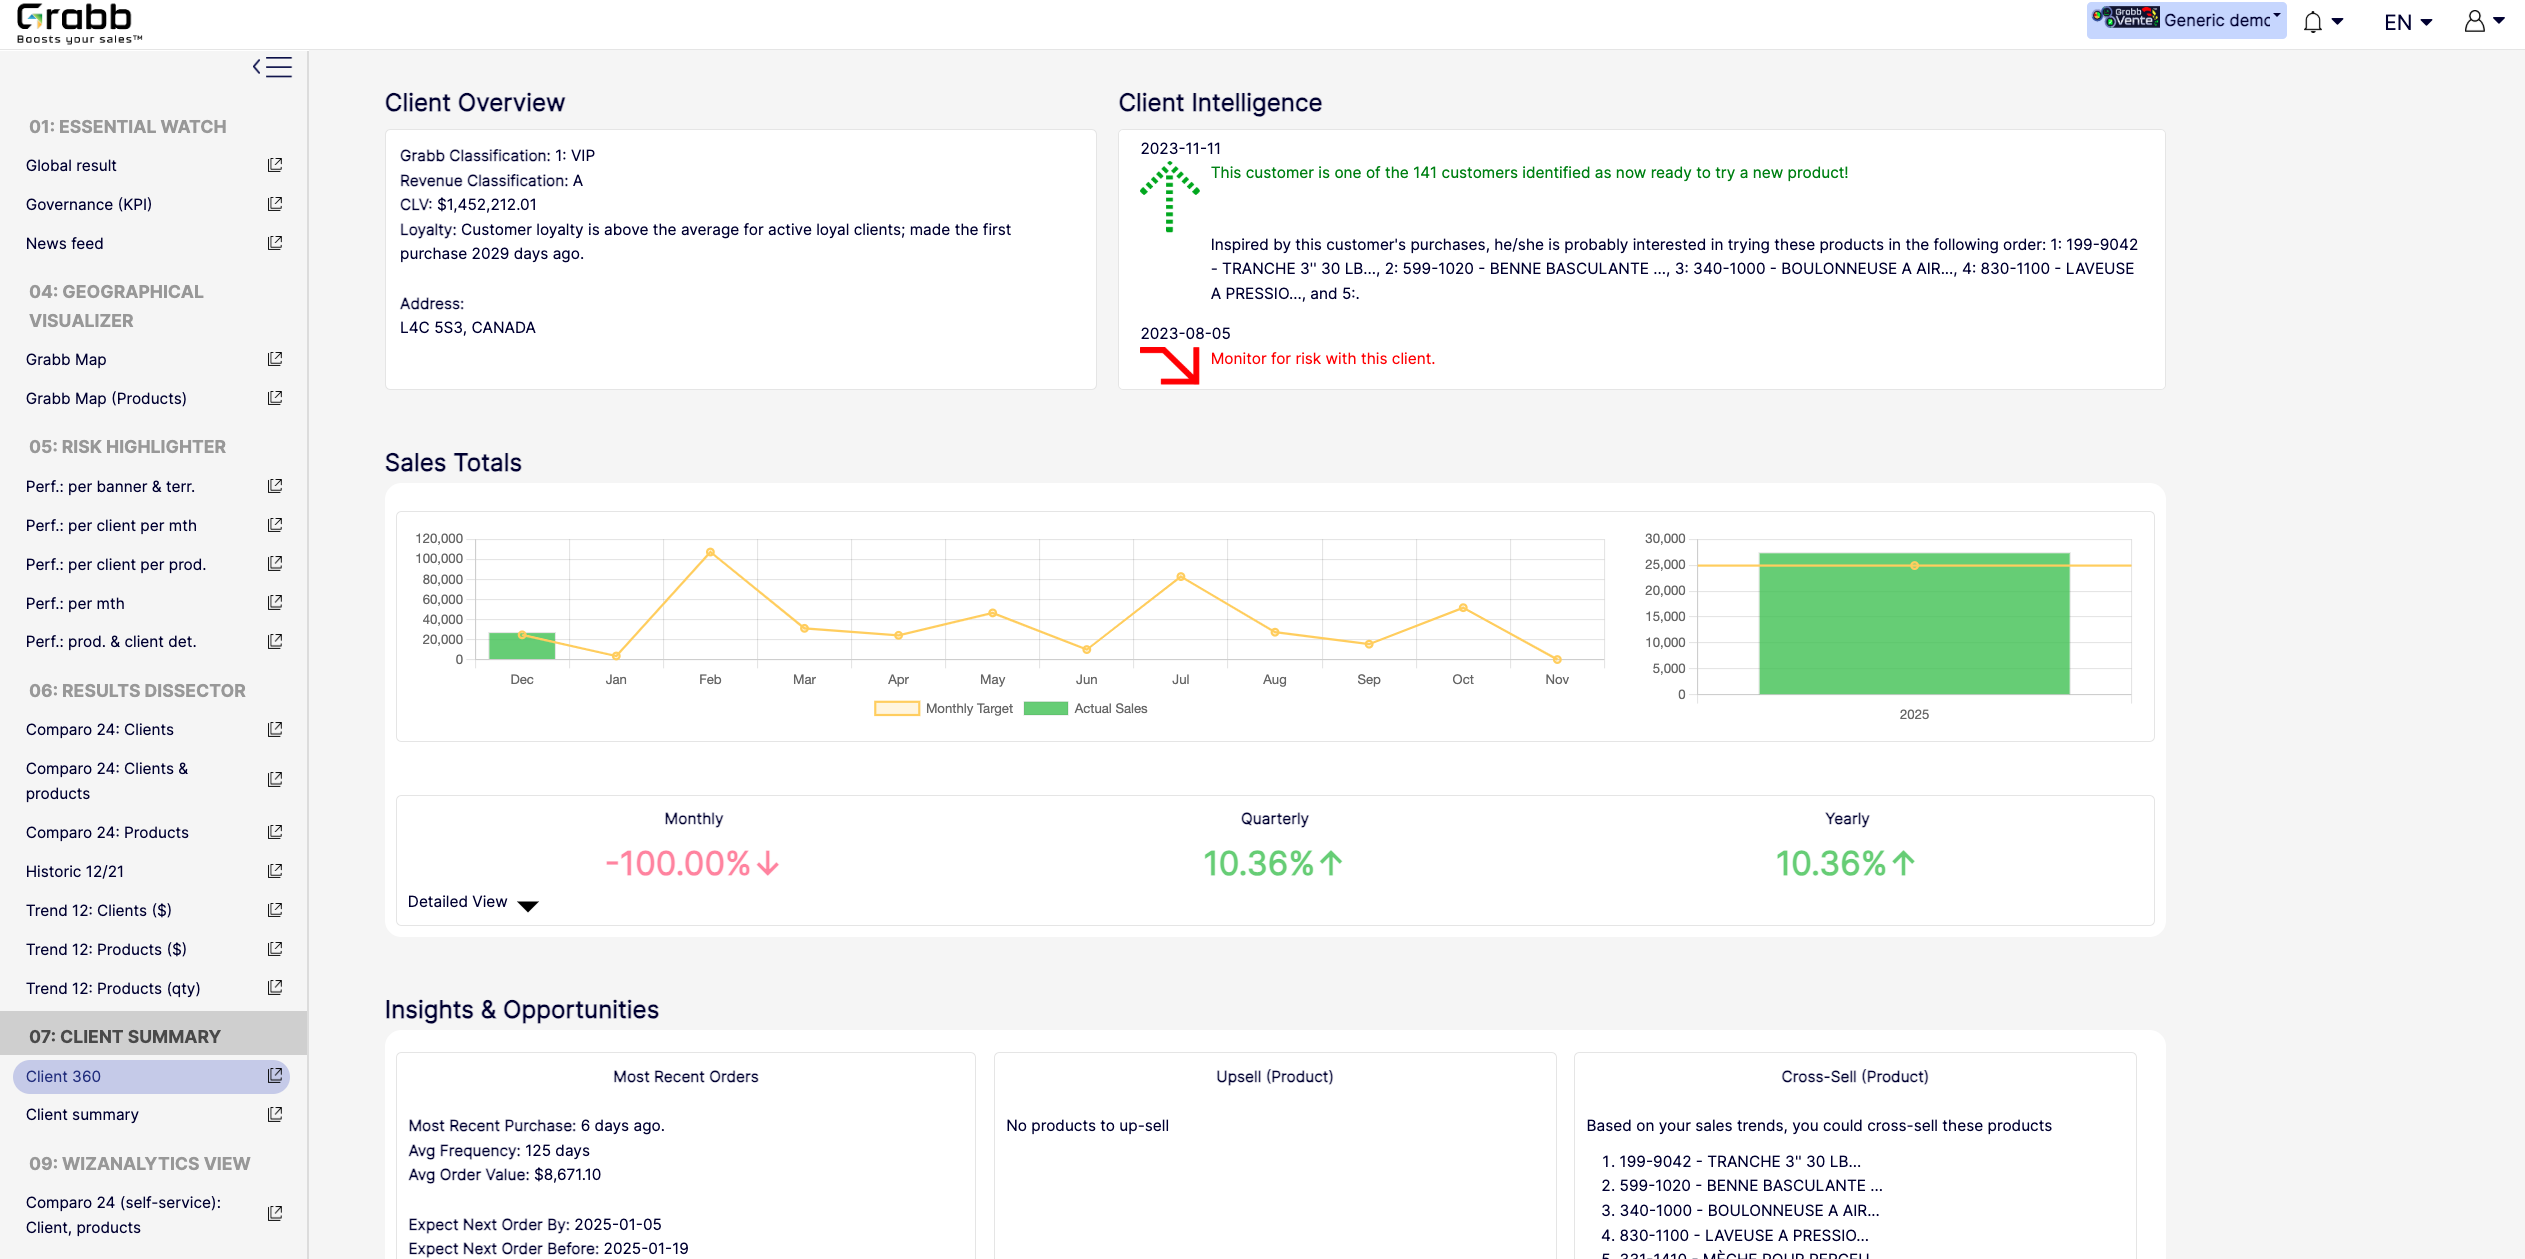 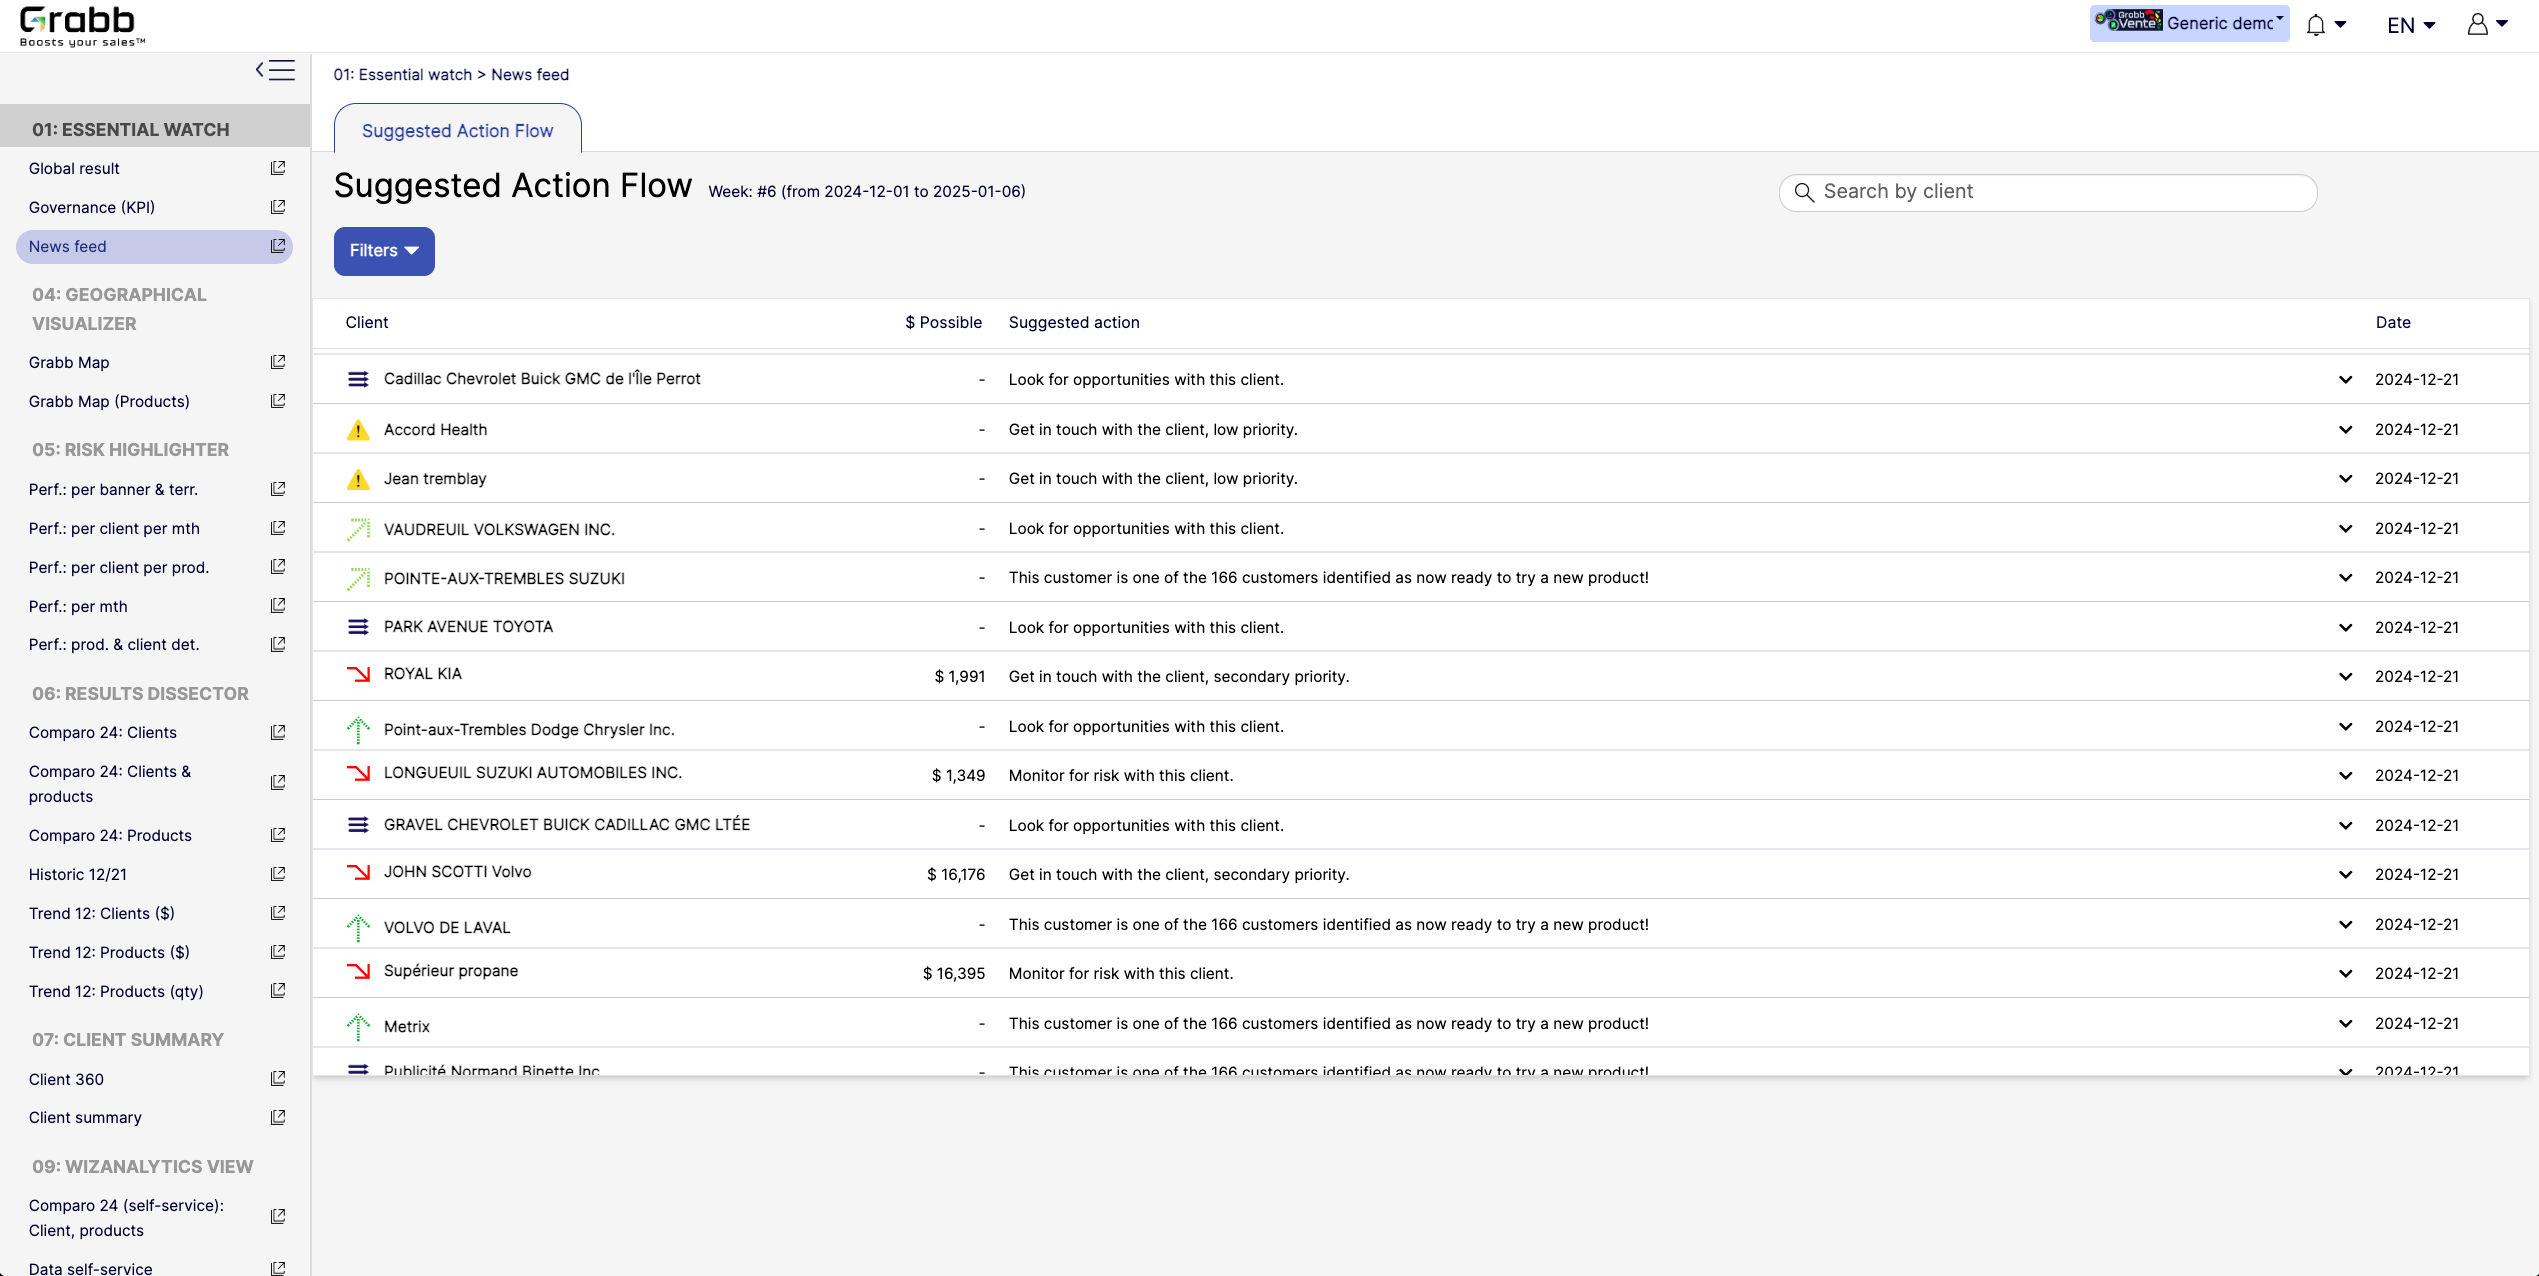 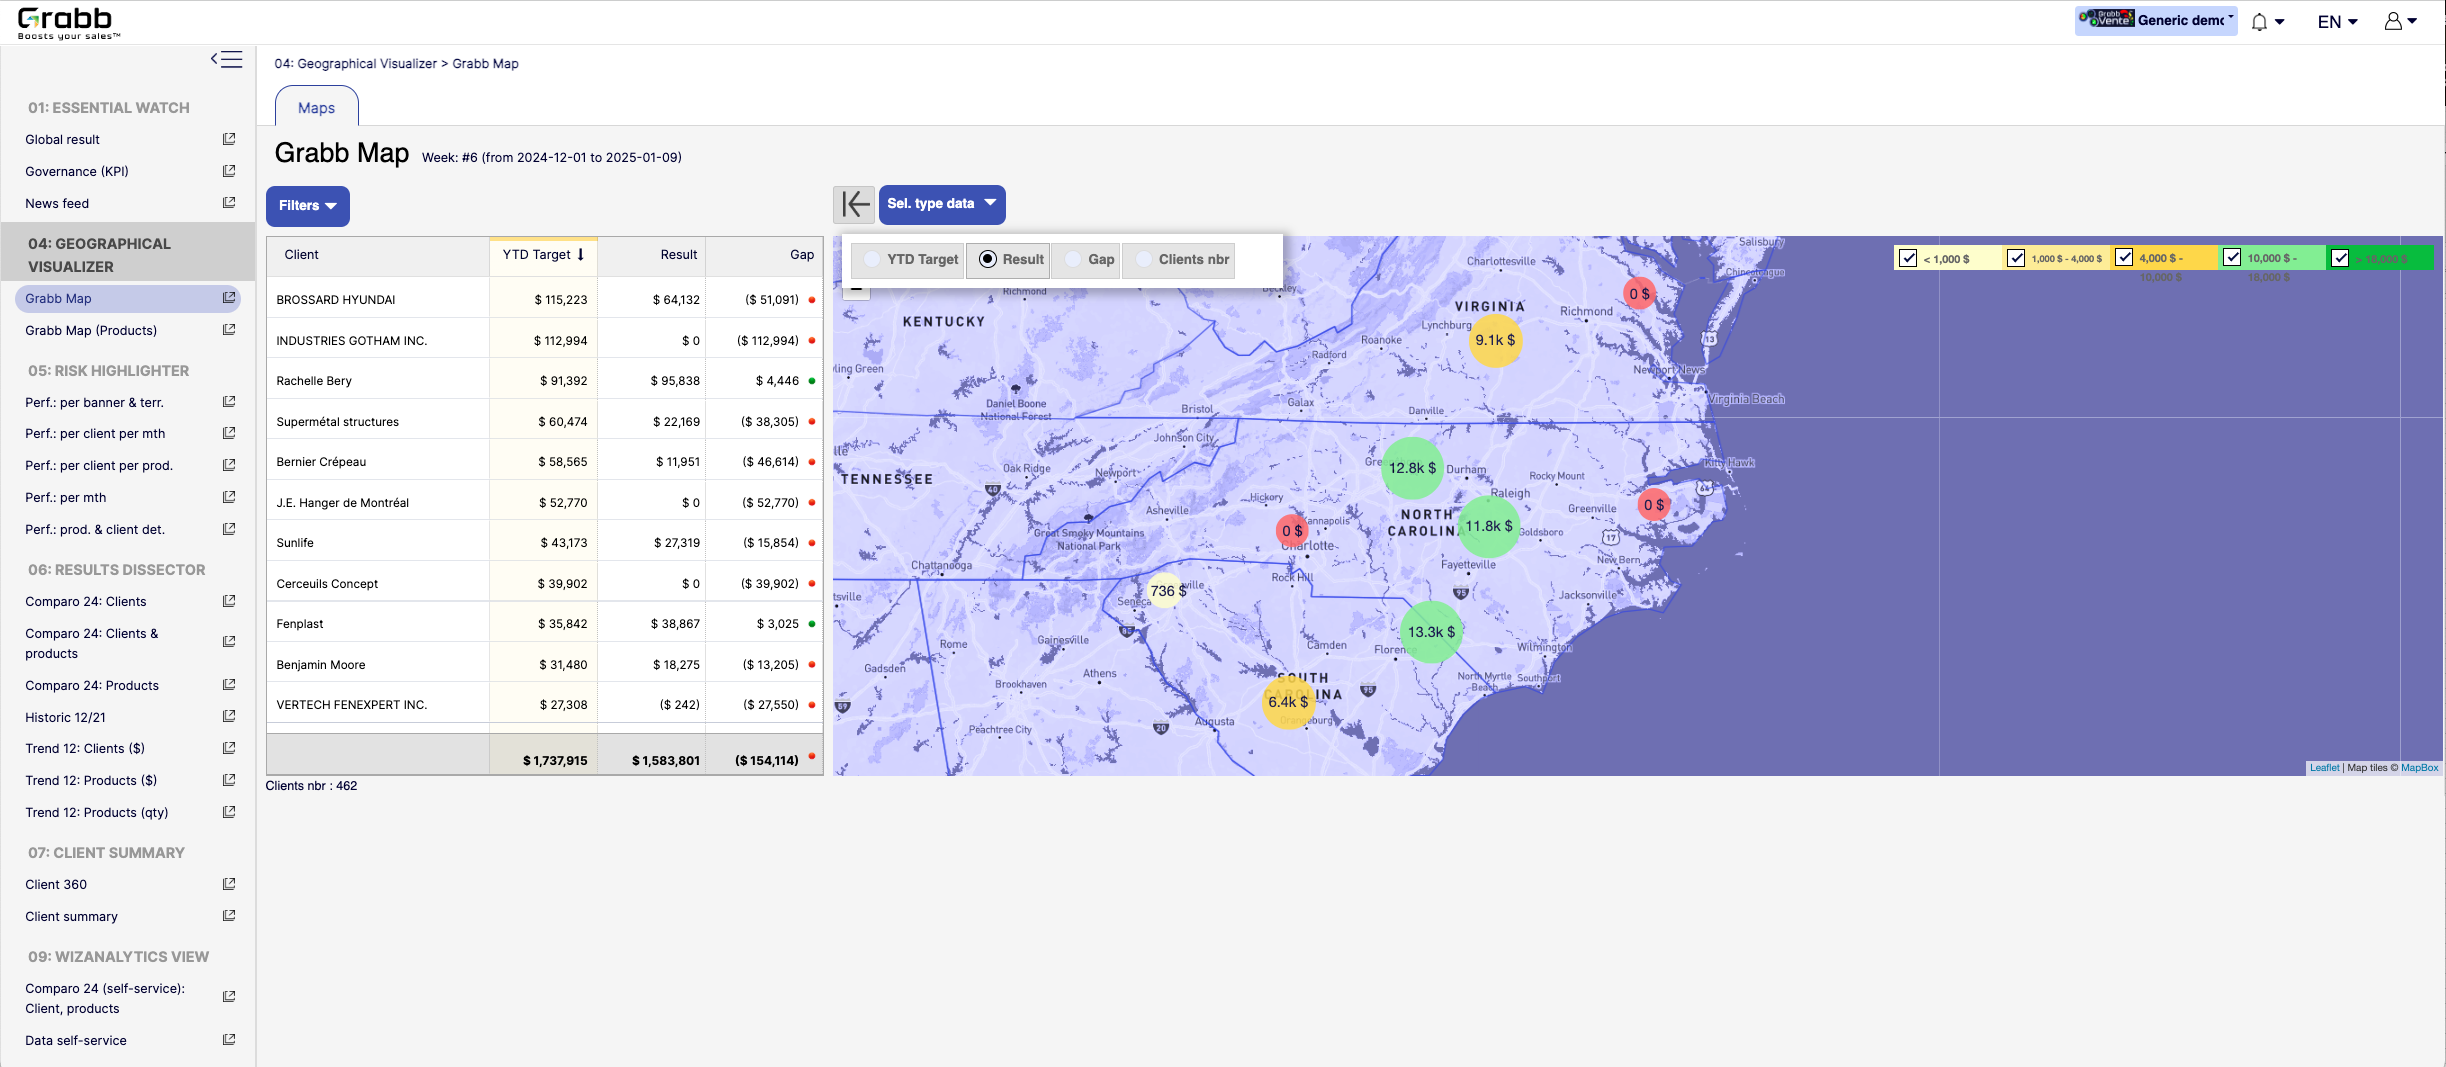 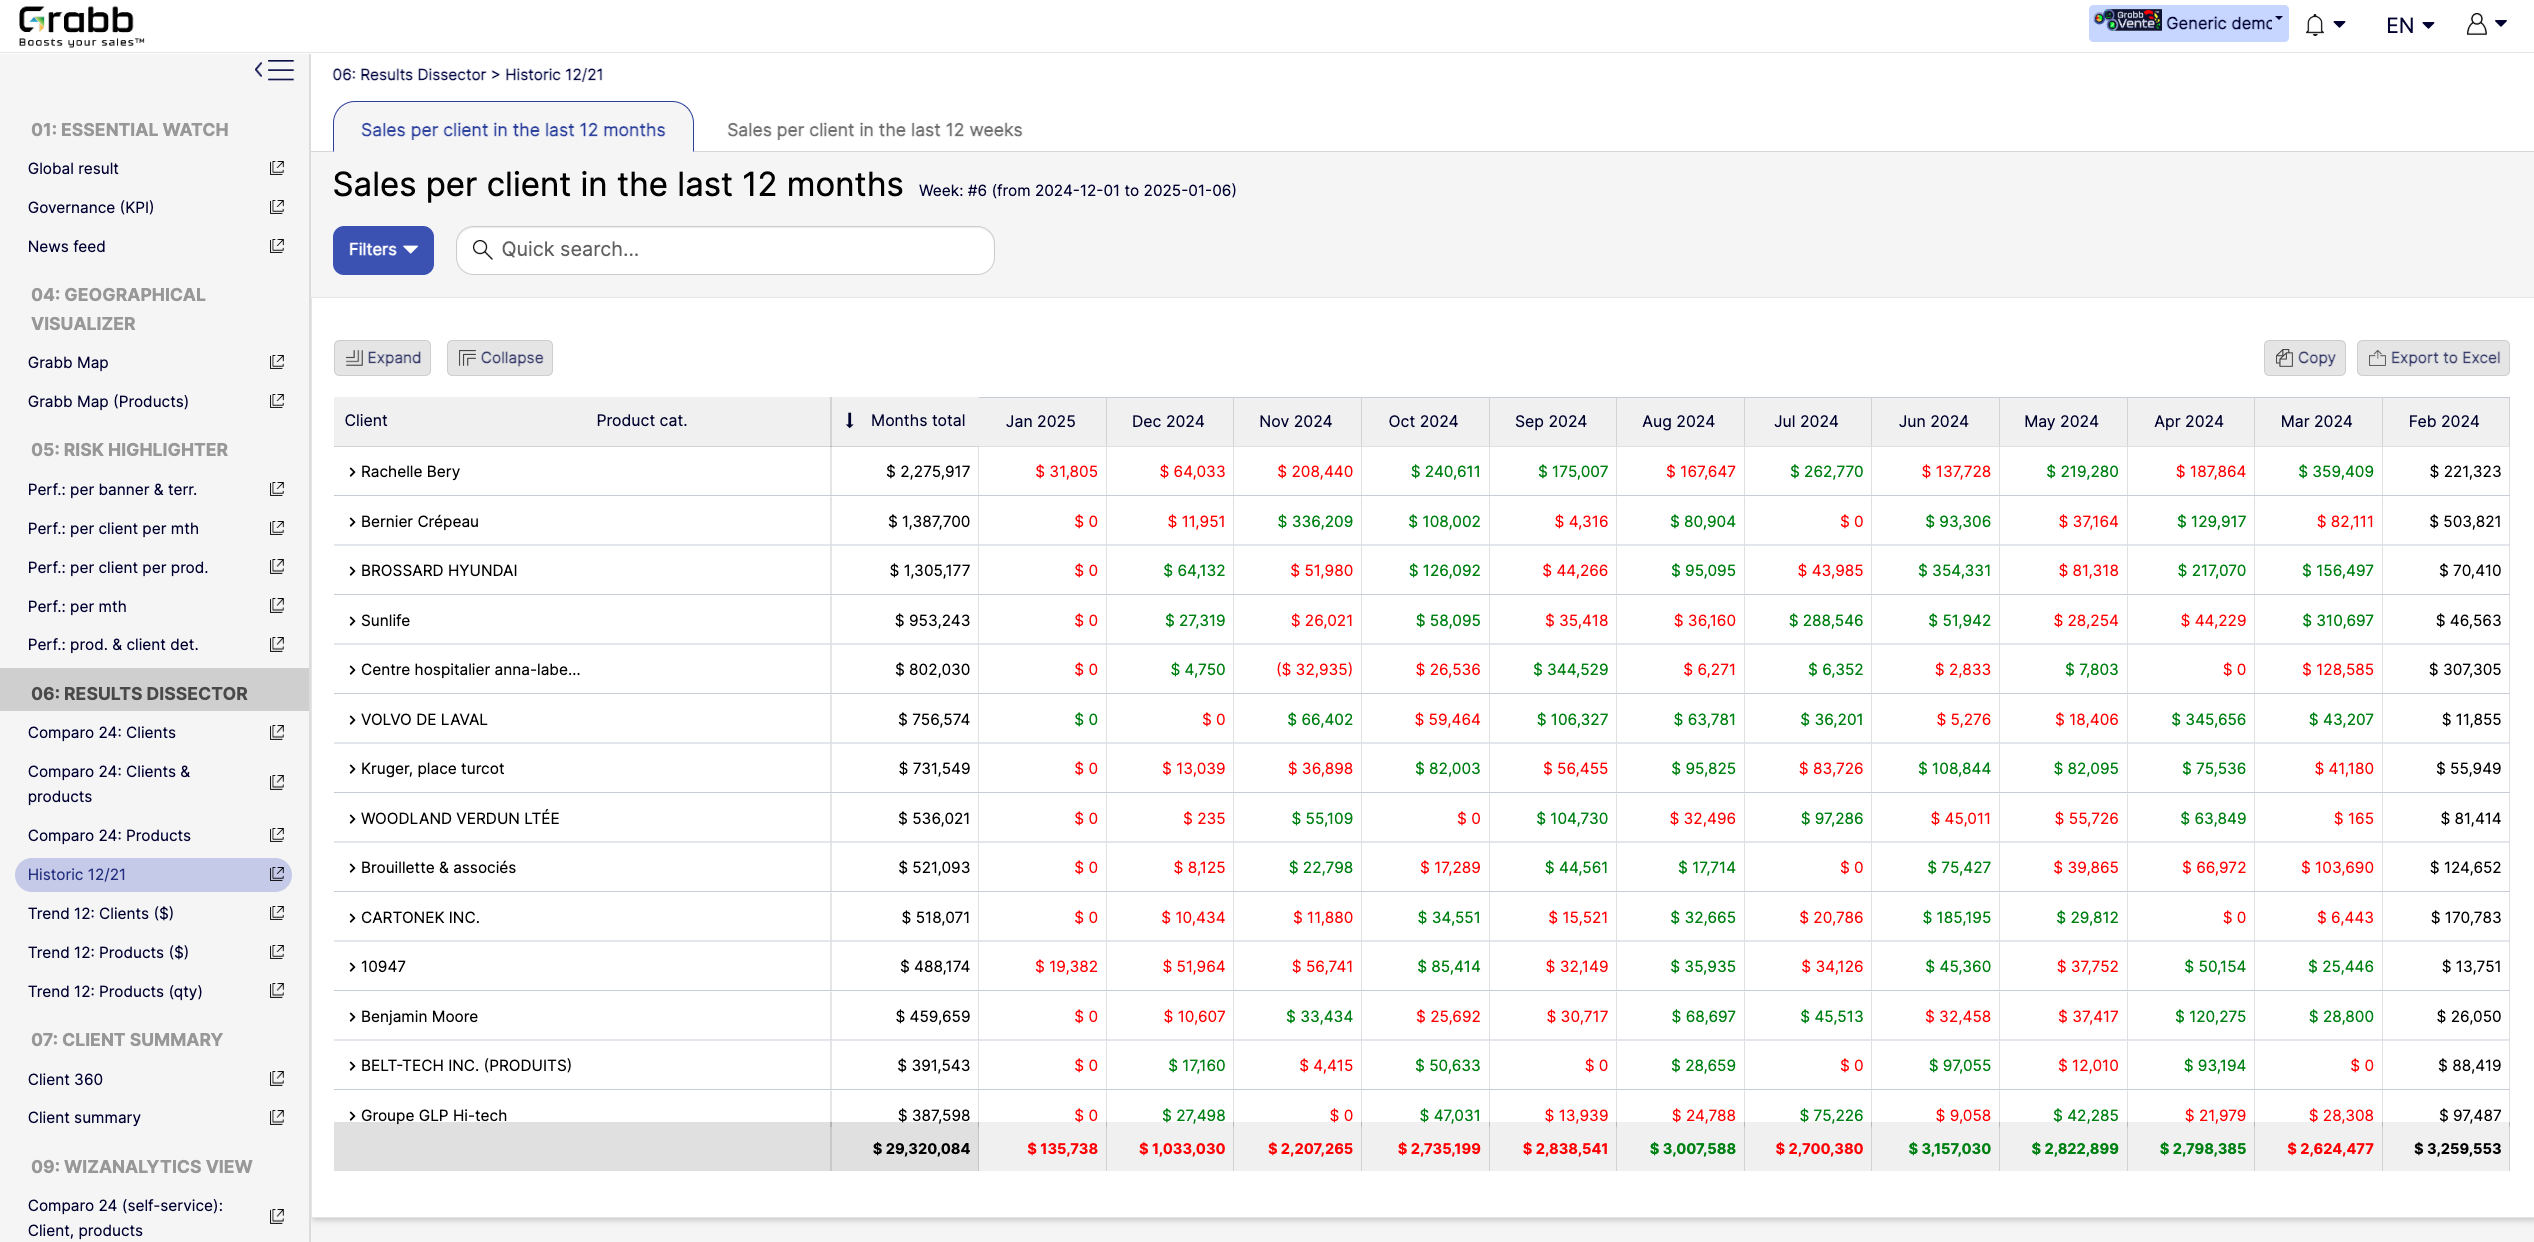 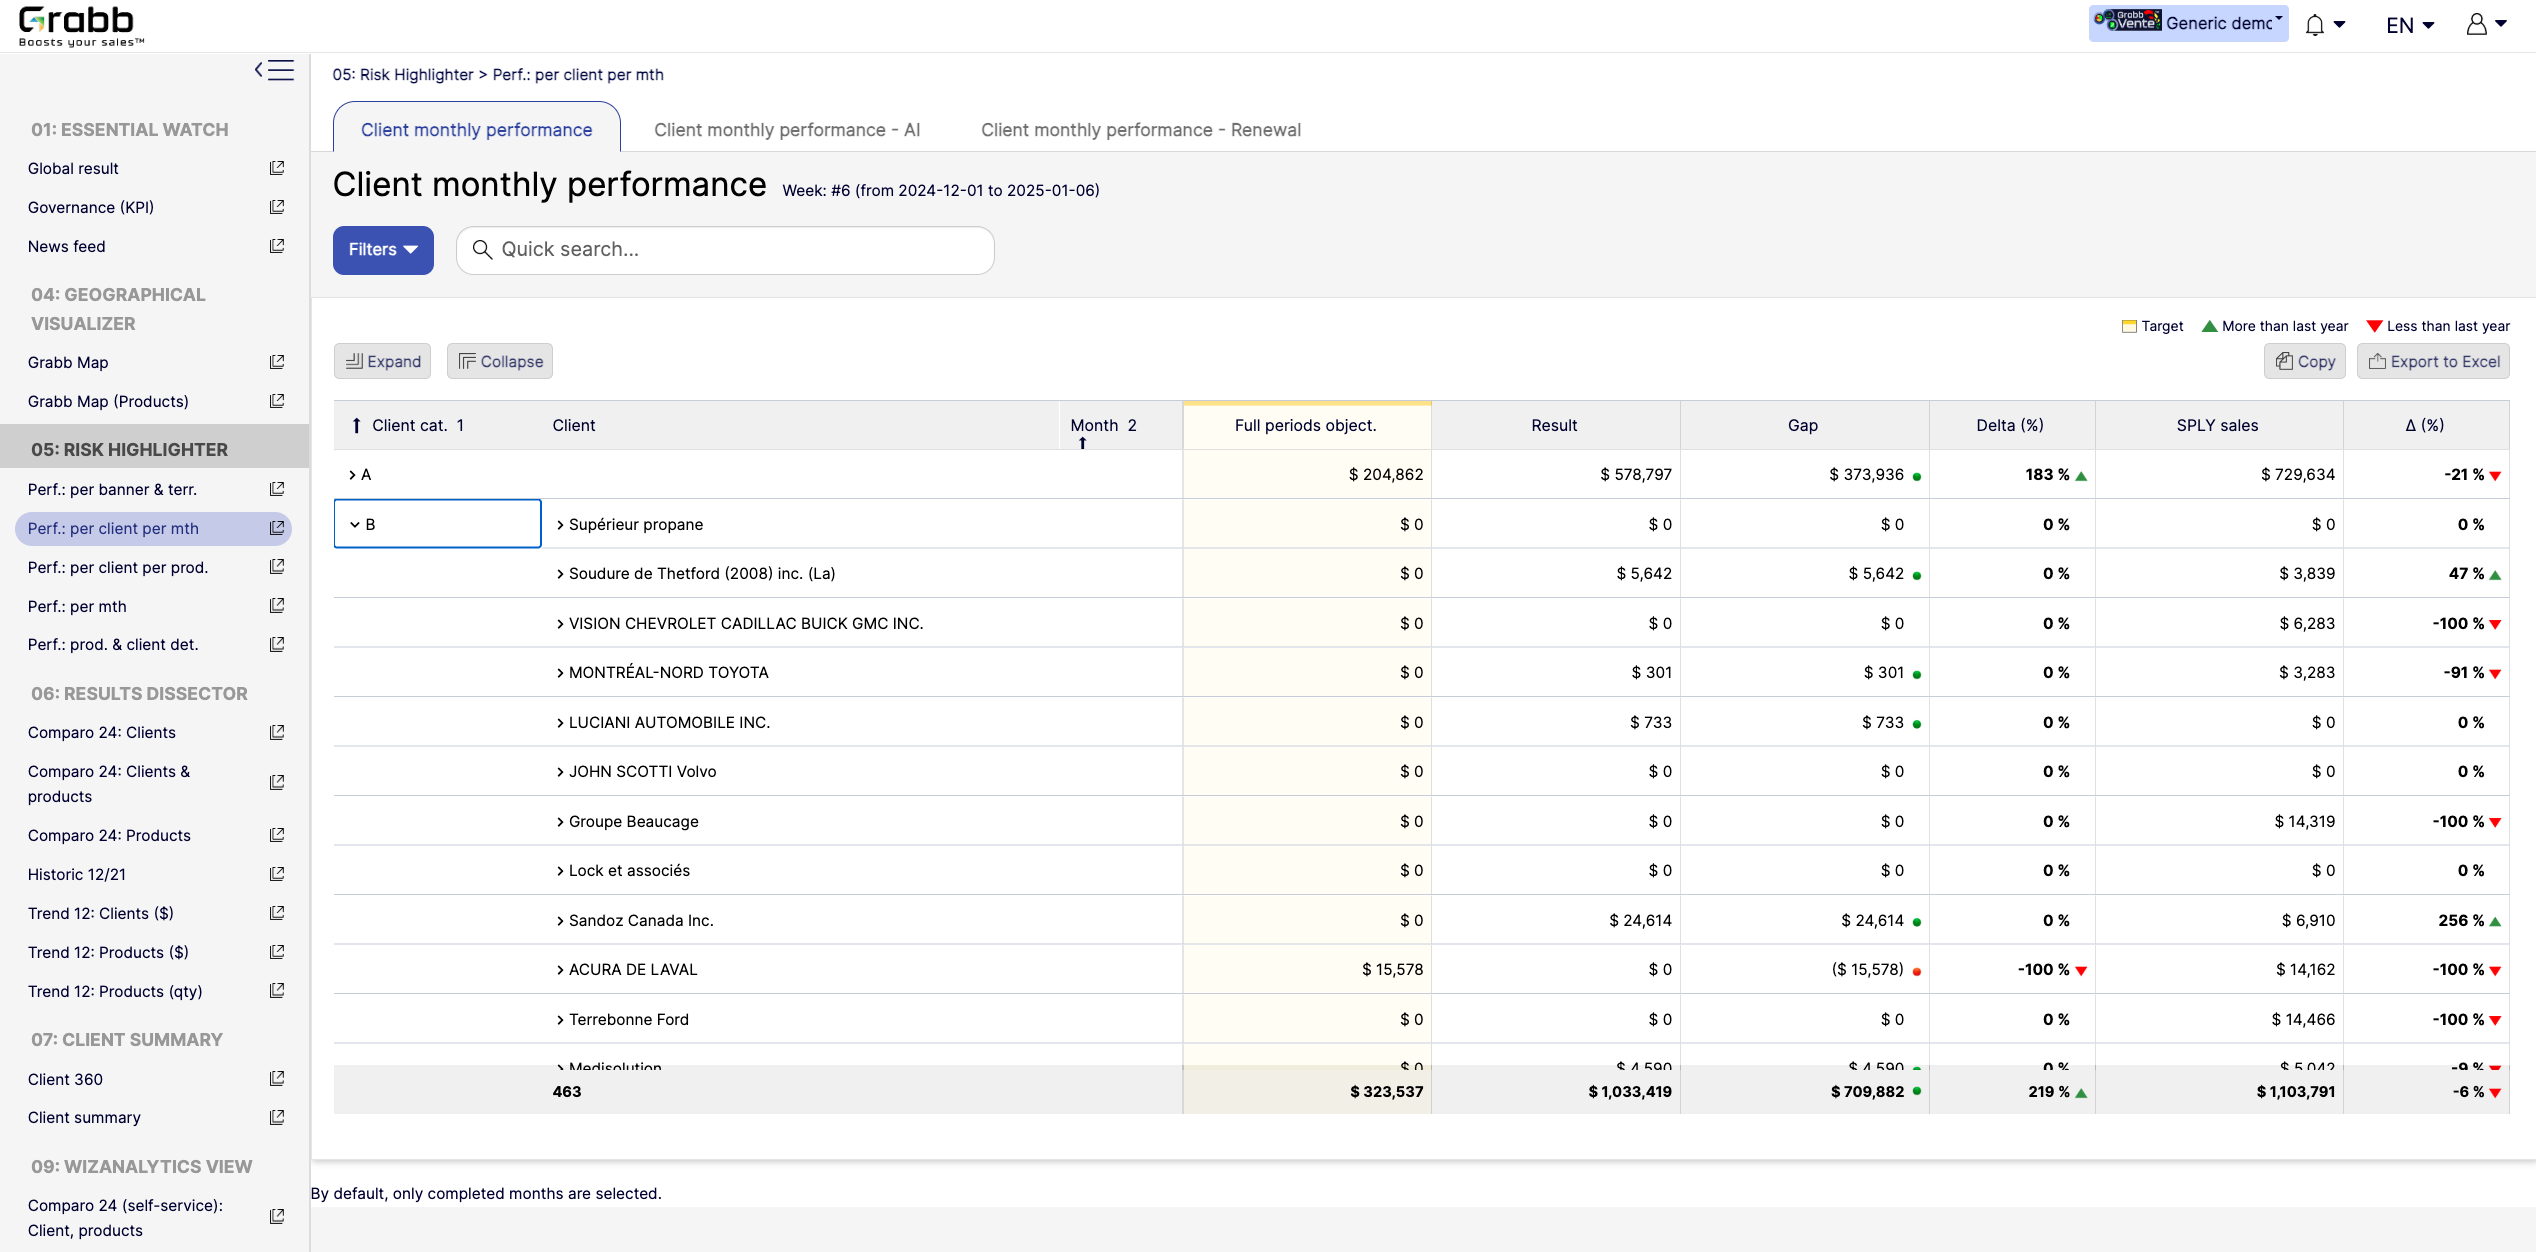 |