Google Charts vs. Rational BI
Google Charts vs. Rational BI
| Product | Rating | Most Used By | Product Summary | Starting Price |
|---|---|---|---|---|
 Google Charts | N/A | Google Charts provides a way to visualize data on your website - for free. From simple line charts to complex hierarchical tree maps, the chart gallery provides a large number of ready-to-use chart types. The most common way to use Google Charts is with simple JavaScript that you embed in your web page. | N/A | |
 Rational BI | Enterprise companies (1,001+ employees) | Rational BI provides analytics, data science and business intelligence in an analytical platform that connects to databases, data files and cloud drives including AWS and Azure data sources, enabling users to explore and visualize data. Users can build real-time notebook-style reports directly in a web browser with JavaScript and SQL with direct and live connections to data. Filter and query data with an SQL database embedded in the client, without network… | $0 single user |
| Google Charts | Rational BI | |||||||||||||||
|---|---|---|---|---|---|---|---|---|---|---|---|---|---|---|---|---|
| Editions & Modules | No answers on this topic |
| ||||||||||||||
| Offerings |
| |||||||||||||||
| Entry-level Setup Fee | No setup fee | Optional | ||||||||||||||
| Additional Details | — | Additional cost per extra user (varies by edition) | ||||||||||||||
| More Pricing Information | ||||||||||||||||
| Google Charts | Rational BI |
|---|
| Google Charts | Rational BI | |||||||||||||||||||||
|---|---|---|---|---|---|---|---|---|---|---|---|---|---|---|---|---|---|---|---|---|---|---|
| BI Standard Reporting |
| |||||||||||||||||||||
| Ad-hoc Reporting |
| |||||||||||||||||||||
| Report Output and Scheduling |
| |||||||||||||||||||||
| Data Discovery and Visualization |
| |||||||||||||||||||||
| Access Control and Security |
| |||||||||||||||||||||
| Mobile Capabilities |
| |||||||||||||||||||||
| Application Program Interfaces (APIs) / Embedding |
|
| Google Charts | Rational BI | |
|---|---|---|
| Small Businesses |  Yellowfin Score 8.7 out of 10 |  Supermetrics Score 9.7 out of 10 |
| Medium-sized Companies |  Reveal Score 10.0 out of 10 | Supermetrics Score 9.7 out of 10 |
| Enterprises |  Kyvos Semantic Layer Score 9.5 out of 10 |  IBM Analytics Engine Score 7.2 out of 10 |
| All Alternatives | View all alternatives | View all alternatives |
| Google Charts | Rational BI | |
|---|---|---|
| Likelihood to Recommend | 9.0 (61 ratings) | 7.7 (4 ratings) |
| Likelihood to Renew | 7.3 (8 ratings) | - (0 ratings) |
| Usability | 9.0 (33 ratings) | 8.7 (4 ratings) |
| Availability | 10.0 (1 ratings) | - (0 ratings) |
| Performance | 5.0 (1 ratings) | - (0 ratings) |
| Support Rating | 8.3 (32 ratings) | 7.7 (4 ratings) |
| Online Training | 5.0 (1 ratings) | - (0 ratings) |
| Implementation Rating | 10.0 (1 ratings) | - (0 ratings) |
| Configurability | 8.0 (1 ratings) | - (0 ratings) |
| Ease of integration | 10.0 (1 ratings) | - (0 ratings) |
| Product Scalability | 8.0 (1 ratings) | - (0 ratings) |
| Vendor post-sale | 10.0 (1 ratings) | - (0 ratings) |
| Vendor pre-sale | 10.0 (1 ratings) | - (0 ratings) |
| Google Charts | Rational BI | |
|---|---|---|
| Likelihood to Recommend |  Google
| Rational BI
|
| Pros | Google
| Rational BI
|
| Cons | Google
 Sarah Bandy Executive Director | Rational BI
 Judy L. Berglund Solutions Architect - Infrastructure Solutions Group |
| Likelihood to Renew | Google
 Daniel Ma Web Developer | Rational BI No answers on this topic |
| Usability | Google
| Rational BI
|
| Reliability and Availability | Google
| Rational BI No answers on this topic |
| Performance | Google
| Rational BI No answers on this topic |
| Support Rating | Google
 Alexander Cooper RPA Developer | Rational BI
|
| Online Training | Google
| Rational BI No answers on this topic |
| Implementation Rating | Google
| Rational BI No answers on this topic |
| Alternatives Considered | Google
| Rational BI
|
| Scalability | Google
| Rational BI No answers on this topic |
| Return on Investment | Google
| Rational BI
Judy L. Berglund Solutions Architect - Infrastructure Solutions Group |
| ScreenShots | Rational BI Screenshots  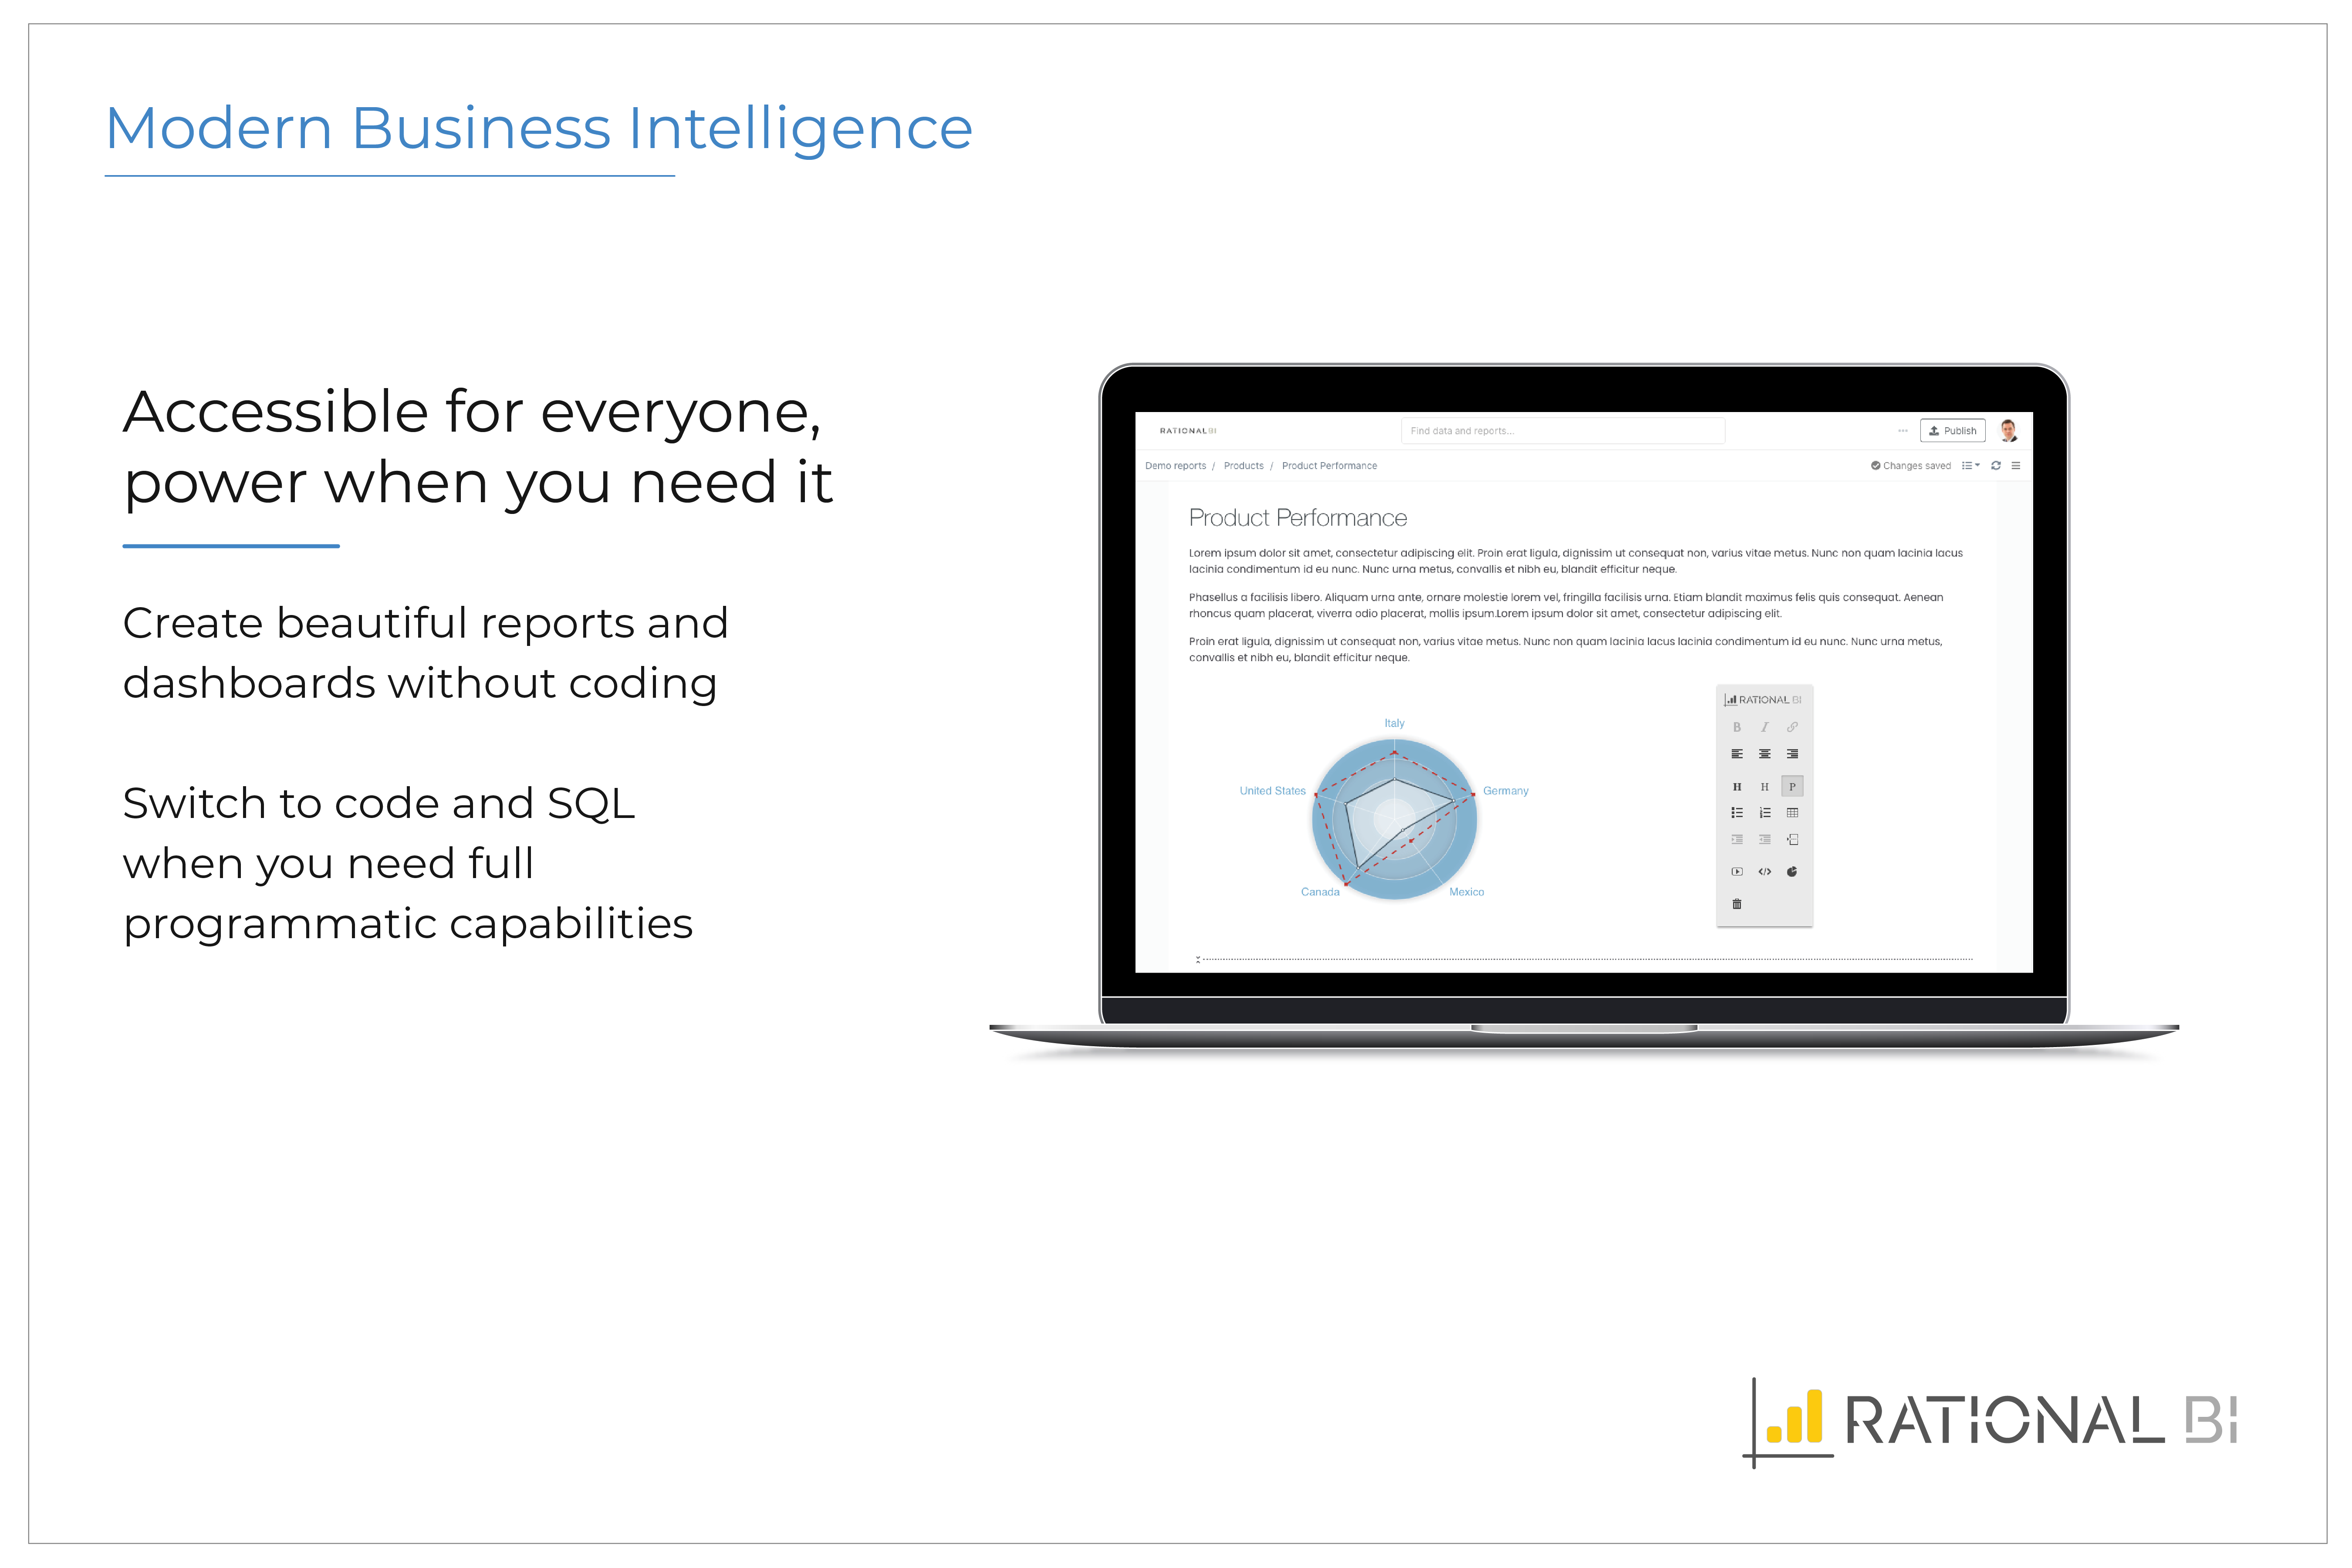  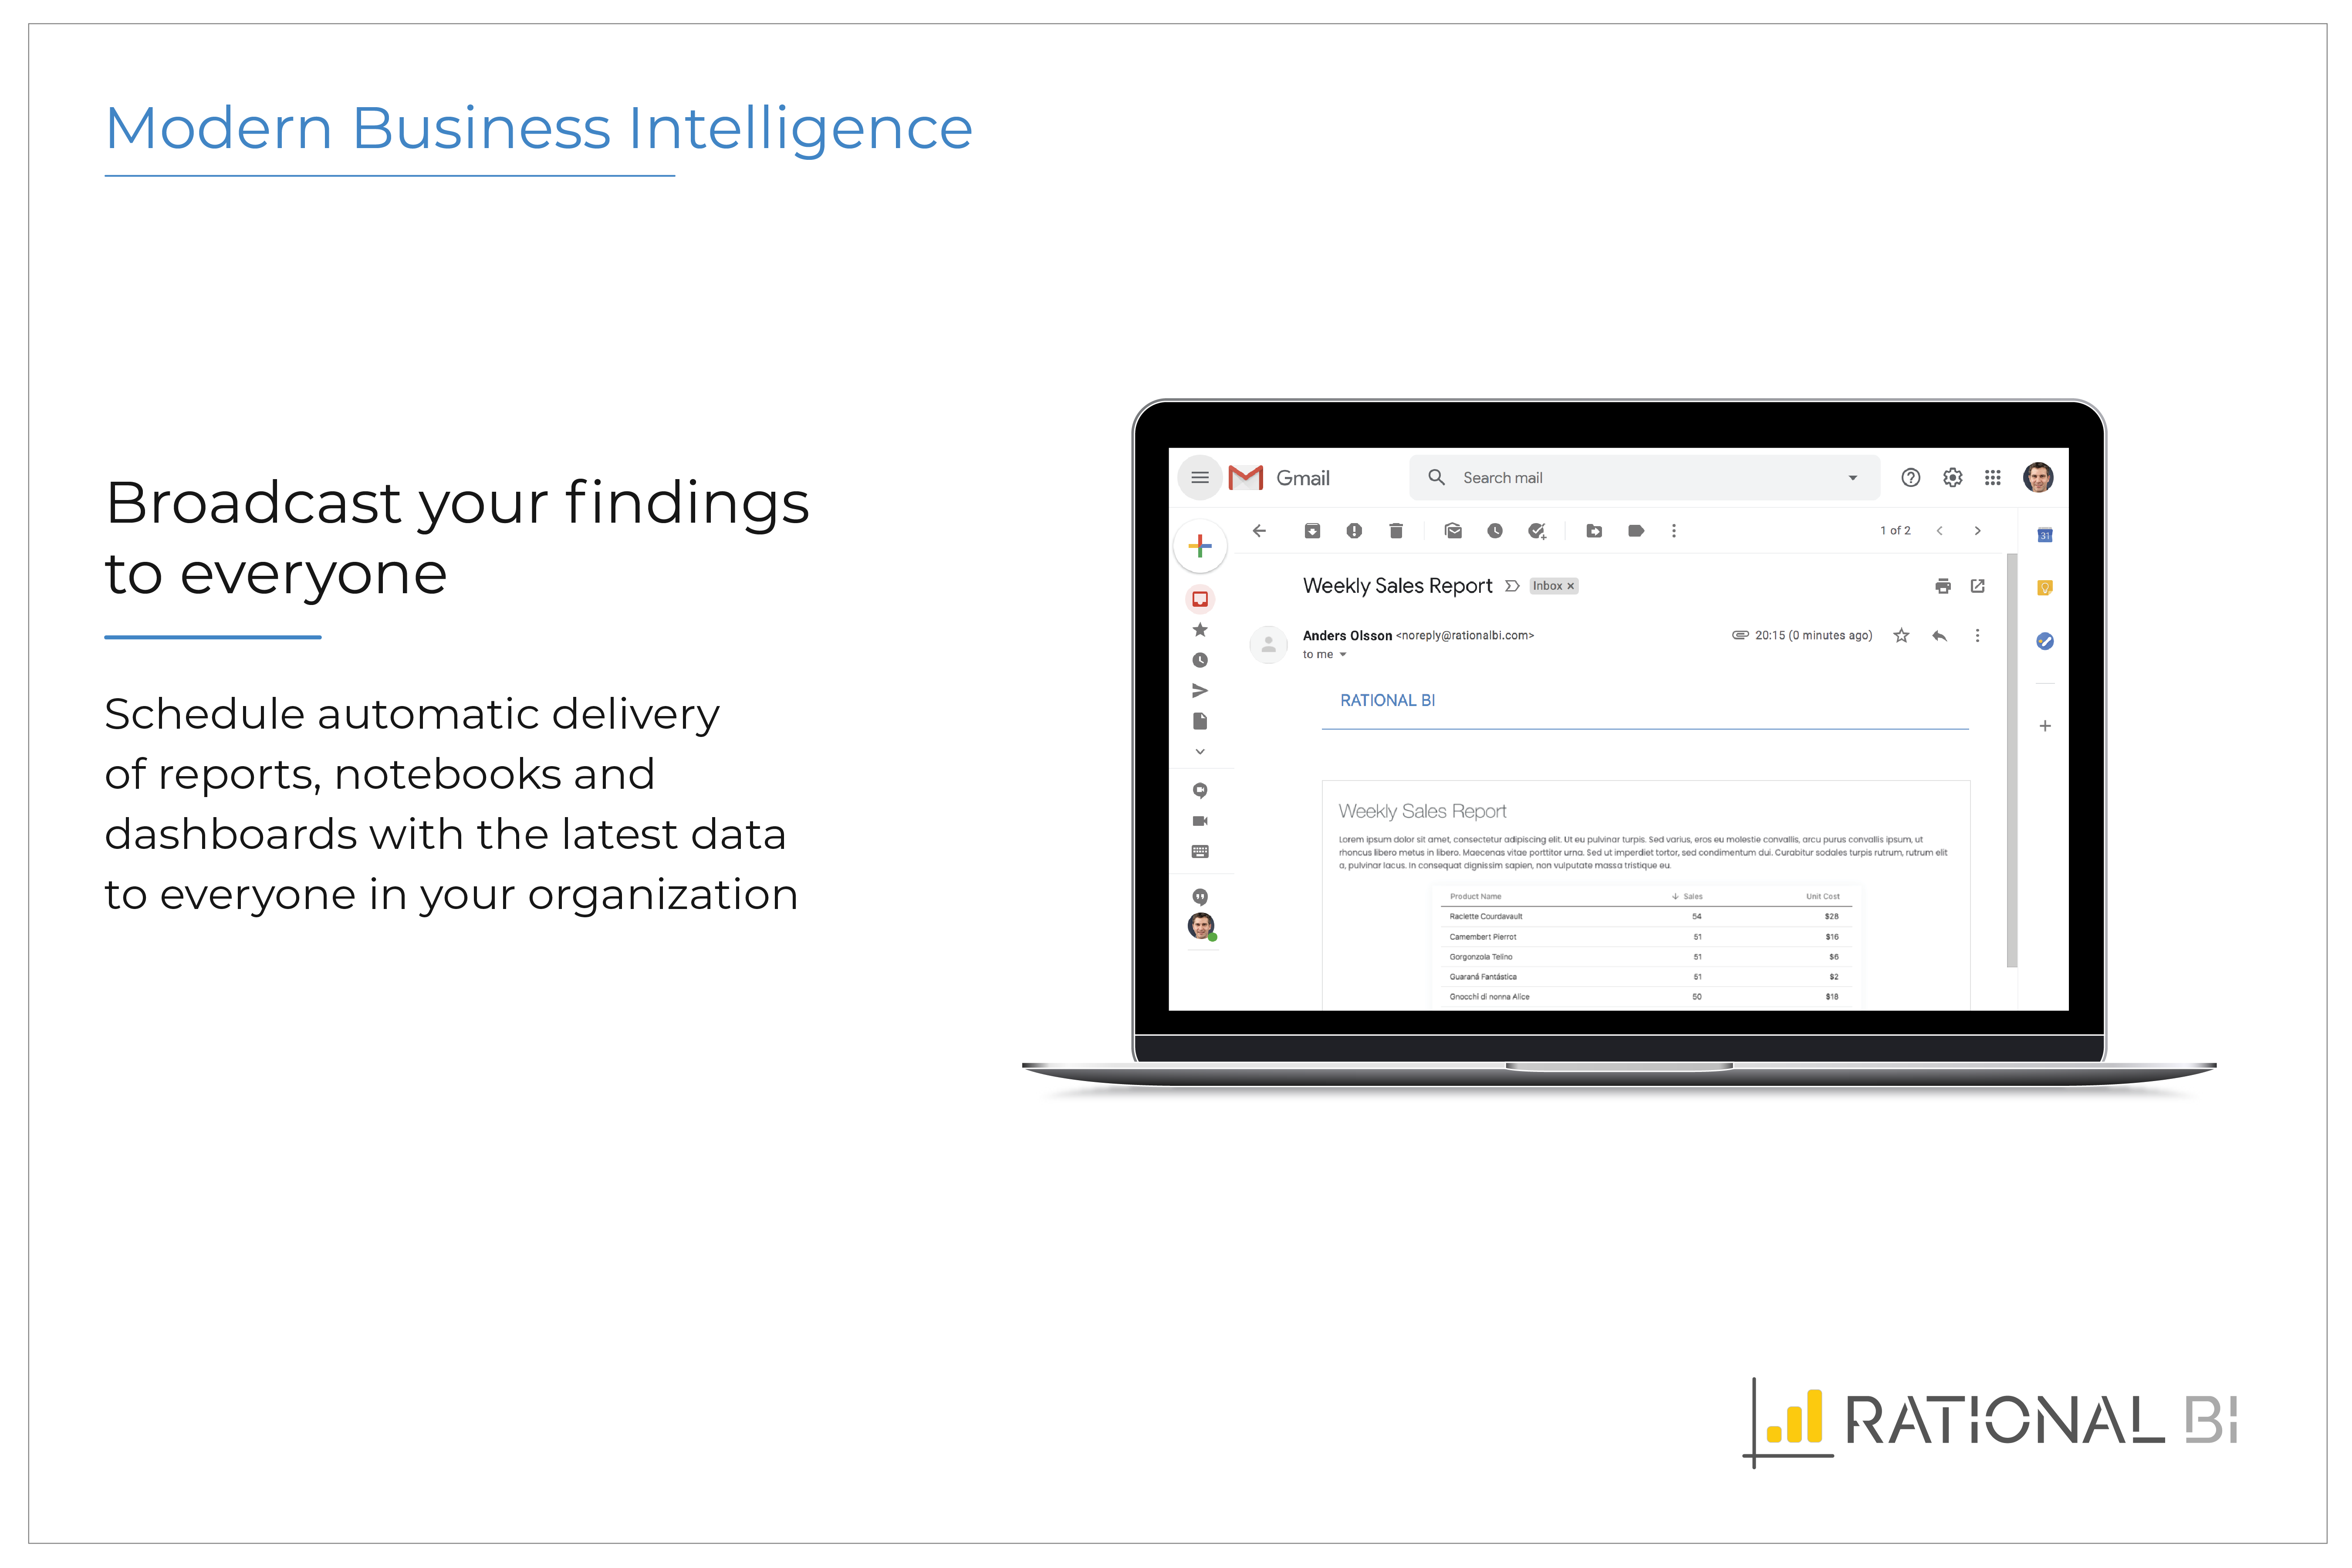 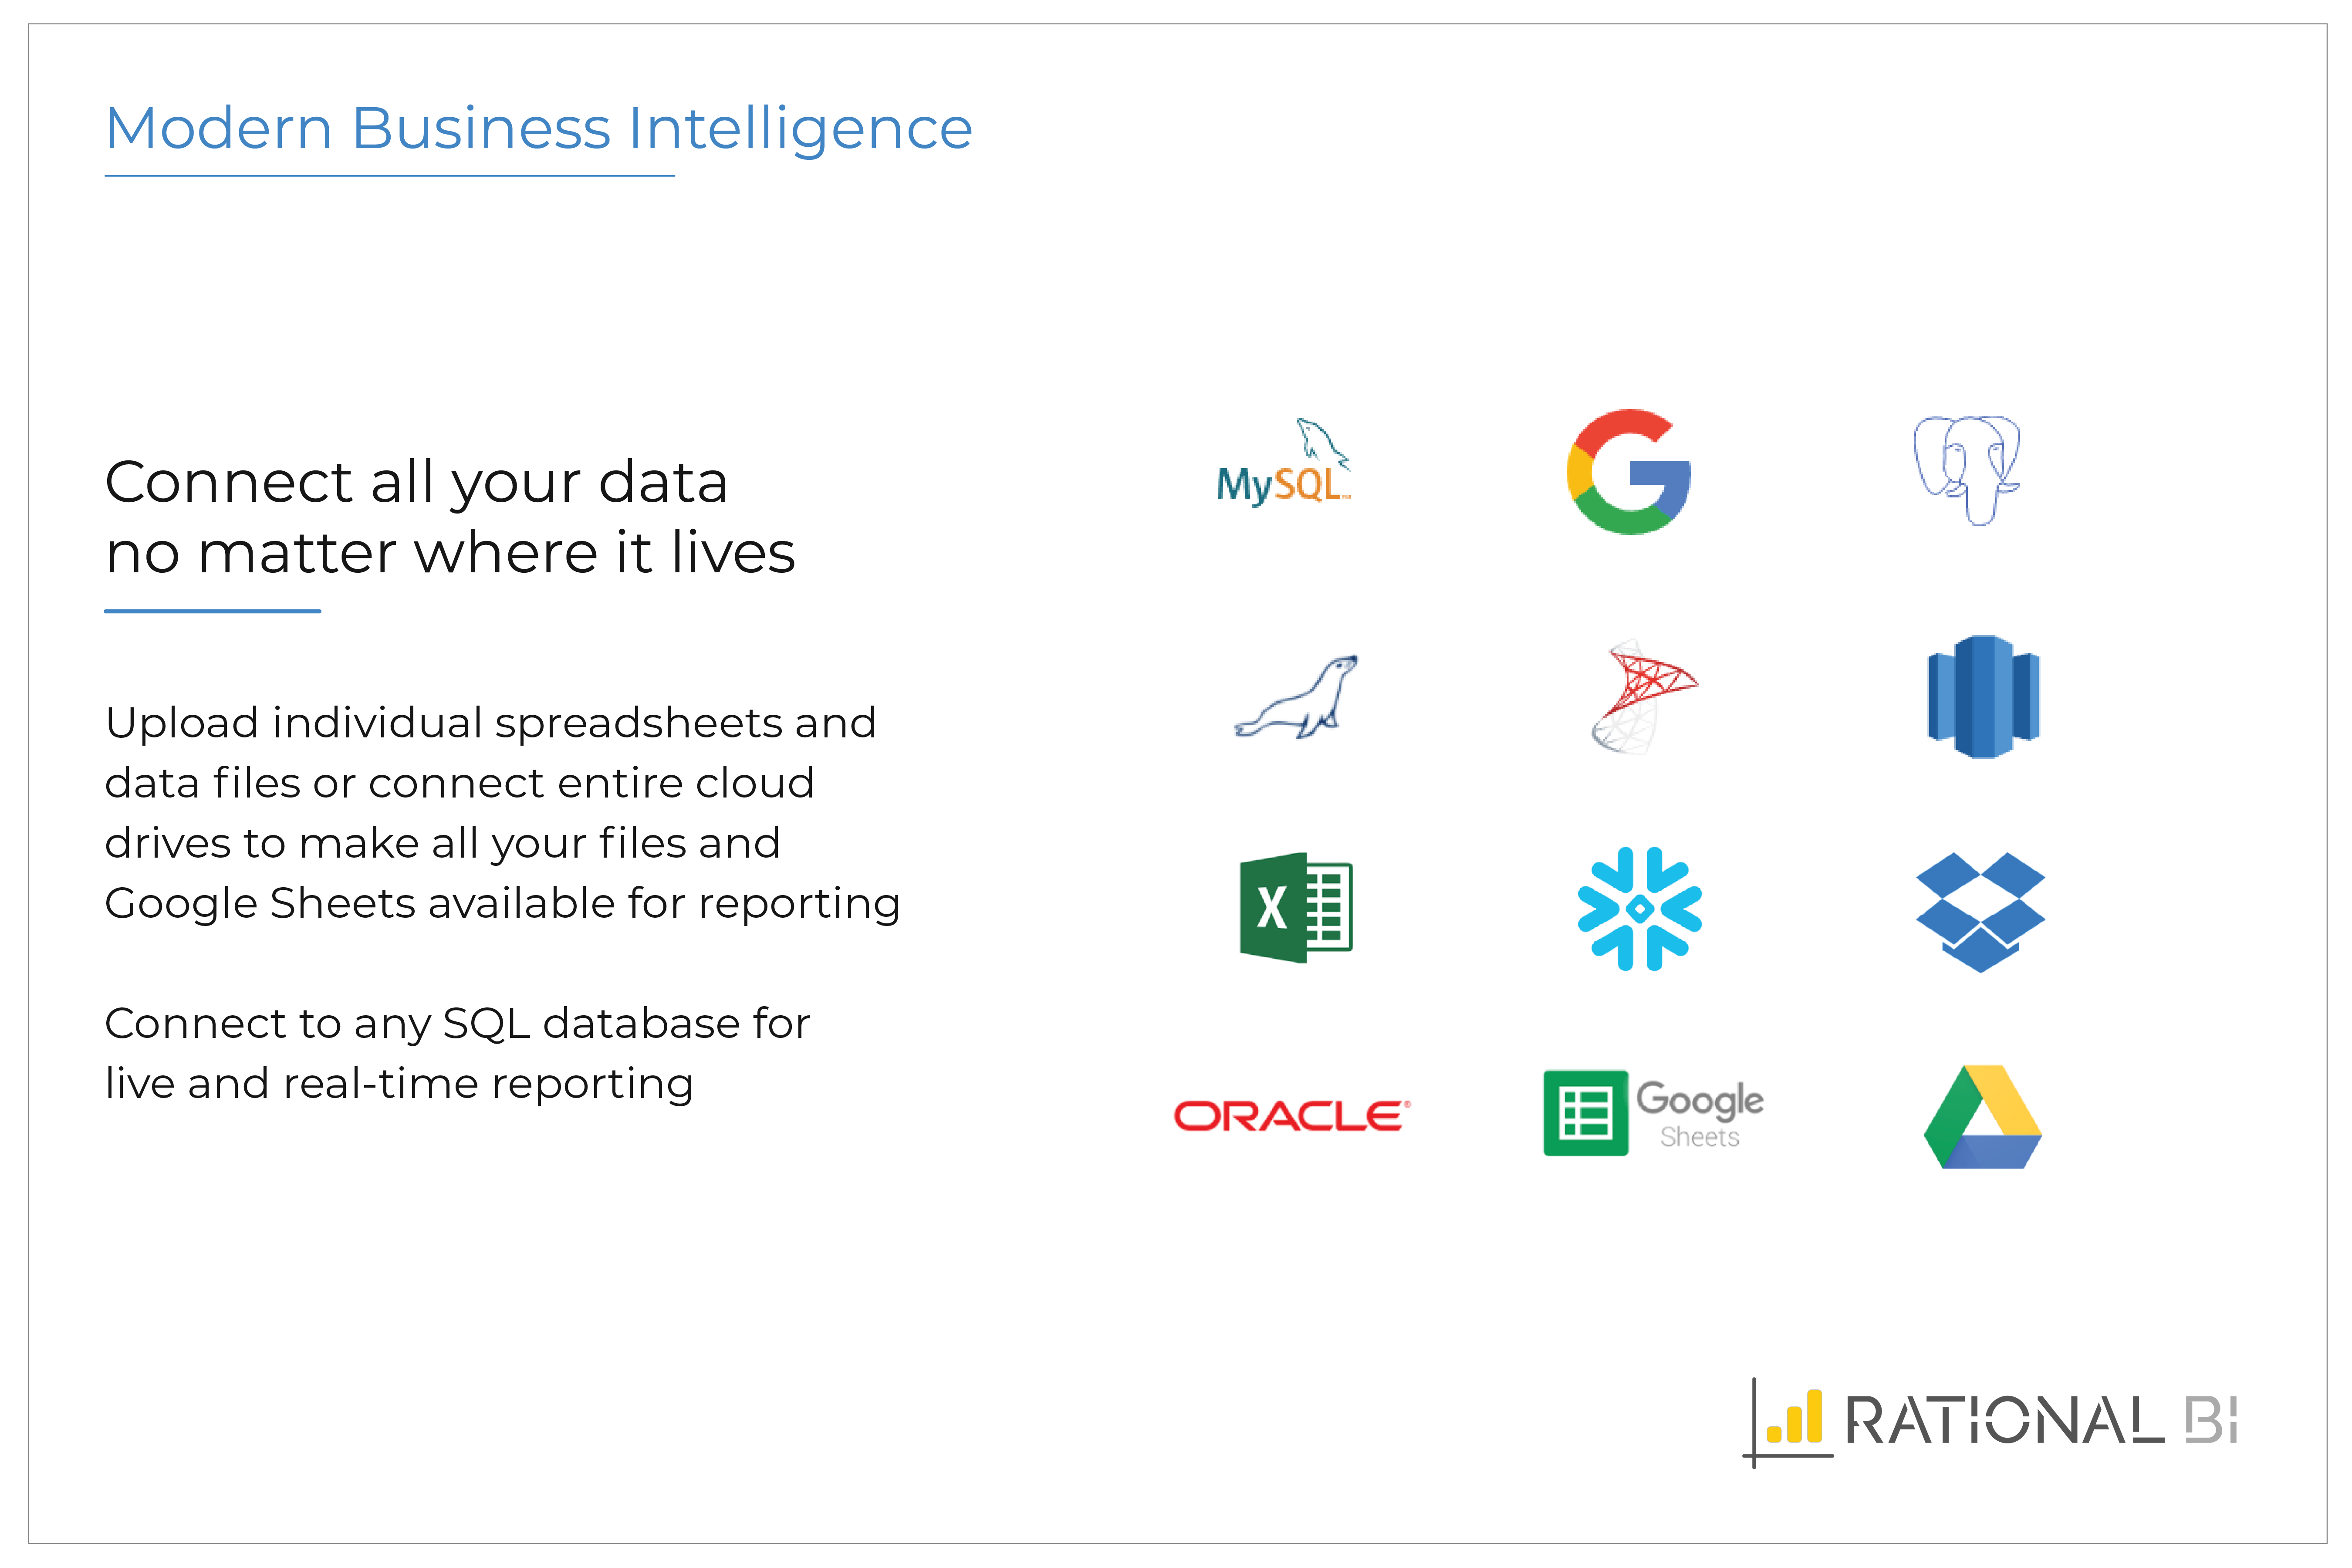 |