Grafana is a data visualization tool developed by Grafana Labs in New York. It is available open source, managed (Grafana Cloud), or via an enterprise edition with enhanced features. Grafana has pluggable data source model and comes bundled with support for popular time series databases like Graphite. It also has built-in support for cloud monitoring vendors like Amazon Cloudwatch, Microsoft Azure and SQL databases like MySQL. Grafana can combine data from many places into a single dashboard.
$0
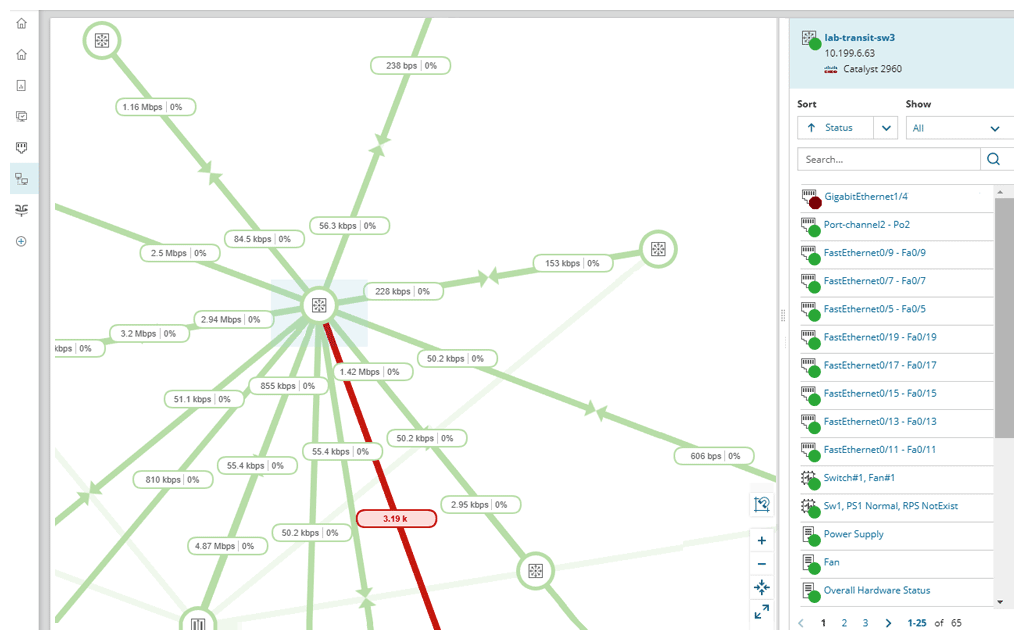
SolarWinds NPM
Score 7.8 out of 10
N/A
SolarWinds NPM is a monitoring and performance management platform. It provides performance troubleshooting support, auto network discovery, customizable thresholds, and can be rapidly deployed.
$1,638
per year
Pricing
Grafana
SolarWinds Network Performance Monitor (NPM)
Editions & Modules
Grafana Cloud - Pro
$8
per month up to 1 active user
Grafana Cloud - Free
Free
10k metrics + 50GB logs + 50GB traces up to 3 active users
Solarwinds can successfully combine pros of the other monitoring systems and be more user friendly, simple and intuitive. The list of NPM cons is not so big and most of its point can be compensated by customization (Solarwinds created a great expert community for it). The …
Just about any organization with more than one server and more than one cluster as it scales very well. Configuration of the application takes time and finesse to fine tune to where the balance of load time and getting data quickly meets. The plugins add load time but fine tuning for the application to meet demand needs nailed down at implementation
SolarWinds Network Performance Monitor (NPM) is excellent on node monitoring, for servers, switches, voice routers, etc. It also provides quick information on the dashboard, so you can take a look an in a few seconds determine is an entire site is down, if portions are down, and what may be causing the issue. We have experienced some difficulty when working with our wireless environment. It is less than natural when attempting to determine if a wireless access point is down itself, or if the switch feeding the access point is down, either port or switch. It does a very good job telling you if a switch is down, but troubleshooting the devices (specifically access points) it struggles.
The entire IT staff relies on NPM in its daily operations. It would be impossible for us to maintain our level of service without it. If SolarWinds gets to proud of their product and begins to over charge for it, we would be forced to reconsider and use a different product. But as it stands it is worth the price to renew it.
It is infinitely flexible. If you can imagine it, Grafana can almost certainly do it. Usability may be in the eye of the beholder however, as there is time needed to curate the experience and get the dashboards customized to how it makes sense to you. I know one thing they are working on are more templates, based on data sources
SolarWinds Network Performance Monitor (NPM) is quite an extensive product, covering all our bases and requirements. There are a lot of customizable options and features which you can work with for their alerting which is really useful. I haven't found anything yet which I thought SolarWinds Network Performance Monitor (NPM) could do, but it actually couldn't so overall it works nicely and does the job.
In all of the times that we called support, someone at SolarWinds had the answer for us in a timely manner. Through thwack and other internet searching, we have been able to resolve all of our issues that arose to our satisfaction. The support staff have always been knowledgeable of their products or had a fellow support staff member to rely on to get the needed answers.
The training is good but during the implementation, you can get situations not learned during the training. The trainer was very open to hearing the questions about use cases and always sharing his experience. I really recommend having official training to take advantage of all features that the NPM can bring.
Make sure your inventory is accurate. Stand up some virtual machines for testing prior to installation. Make sure your database and its credentials are setup. Think about things you want to monitor that may not be obvious - UPS units, Door hardware, PBX systems, Fabric Channel switches, firewalls, routers, switches. Try to setup SNMP on these devices and have an IP that you will assign to the new server. If you do that it will go well.
Grafana blows Nagios out of the water when it comes to customization. The ability to feed almost any data source makes it very versatile and the cost is great.
We use NPM along with PRTG Network Monitor. While NPM is great at monitoring network devices and network links and some aspects of the servers, PRTG provides more in-depth monitoring for Server systems, applications and application ports such as Web Ports etc. PRTG also provides a more comprehensive Root cause analysis.
SolarWinds allows us to proactively address hardware issues before they impact the business. We recently had a server that was experiencing issues sporadically and we were able to use the data from SolarWinds to track down and correct the issue before it tanked the server.
SolarWinds gives our IT department some piece of mind knowing that they'll be alerted of any issues real time.
We can use SolarWinds data to justify needed to replace or upgrade certain equipment that is key to our core business.