Formerly from Magnitude Software and now from Insightsoftware, Angles is a solution to accelerate the distribution of actionable, operational reports and analytics.
N/A
Jama Analyze (Discontinued)
Score8 out of 10
Mid-Size Companies (51-1,000 employees)
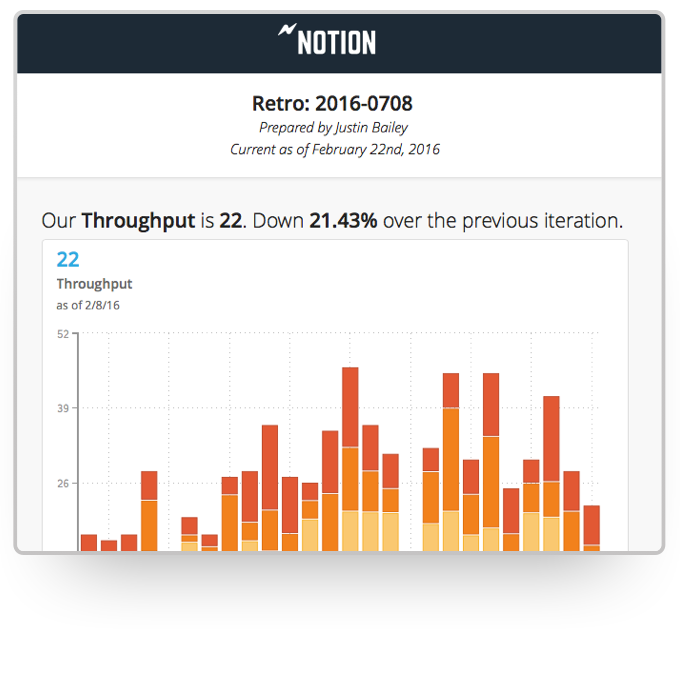
Jama Analyze (formerly called Notion) was a solution for quickly creating shareable, custom dashboards. However, the product is no longer available. Jama Software sunset the Analyze product in 2019. Some of the benefits of Jama Analyze included the ability to: Create custom metrics across all teams with data from any source with the intuitive metric builder. Experience self-serve BI with no coding and no IT to get started making custom dashboards.…
$23
per month
Pricing
Angles by Insightsoftware
Jama Analyze (Discontinued)
Editions & Modules
No answers on this topic
Starter Teams - 2 users
$23
per month
Small Teams - 5 users
$89
per month
Growing Teams - 10 users
$179
per month
Growing Teams - 15 users
$259
per month
Growing Teams - 20 users
$339
per month
Offerings
Pricing Offerings
Angles by Insightsoftware
Jama Analyze (Discontinued)
Free Trial
No
Yes
Free/Freemium Version
No
No
Premium Consulting/Integration Services
No
No
Entry-level Setup Fee
No setup fee
No setup fee
Additional Details
Contact vendor for pricing information.
—
More Pricing Information
Features
Angles by Insightsoftware
Jama Analyze (Discontinued)
BI Standard Reporting
Comparison of BI Standard Reporting features of Angles by Insightsoftware and Jama Analyze (Discontinued)
Feature
Angles by Insightsoftware
-
Ratings
Jama Analyze (Discontinued)
9.3
1 Ratings
13% above category average
Pixel Perfect reports
00 Ratings
9.01 Ratings
Customizable dashboards
00 Ratings
10.01 Ratings
Report Formatting Templates
00 Ratings
9.01 Ratings
Ad-hoc Reporting
Comparison of Ad-hoc Reporting features of Angles by Insightsoftware and Jama Analyze (Discontinued)
Feature
Angles by Insightsoftware
-
Ratings
Jama Analyze (Discontinued)
8.0
1 Ratings
0% below category average
Report sharing and collaboration
00 Ratings
8.01 Ratings
Report Output and Scheduling
Comparison of Report Output and Scheduling features of Angles by Insightsoftware and Jama Analyze (Discontinued)
Feature
Angles by Insightsoftware
-
Ratings
Jama Analyze (Discontinued)
7.0
1 Ratings
16% below category average
Publish to Web
00 Ratings
7.01 Ratings
Report Versioning
00 Ratings
7.01 Ratings
Data Discovery and Visualization
Comparison of Data Discovery and Visualization features of Angles by Insightsoftware and Jama Analyze (Discontinued)
If you desire to 'empower' employees to create or edit their own reports, Noetix is a great tool, though I am not particularly an 'empowerment' person. In my experience most people have enough work of their own, so to tell them they now have to create their own reports can cause problems. If someone is available, like I am, to create the reports based on user requirements, then the report can be shared with the user and they can make changes as needed. I have several users who use the same report over and over for slightly different applications, and they are happy to make the small alterations, but creating whole new reports can seem like a daunting task. I tell my users I don't want them to become frustrated. If they want to try on their own, fine, but don't waste more than half an hour, and if you start to get frustrated, stop and IM me. Ninety-nine times out of 100 I already have a report that will give them exactly what they need. I've done extensive training, and find it's quite easy for users to pick up
A de minimis incentive was given to thank the reviewer for their time. The incentive was not used to bias or drive a particular response, nor was the incentive contingent on a positive endorsement. More Info
The integration with JIRA is quite a handy tool to have. It allows for team progress to be easily tracked and visualized using the software while key metrics are brought to the forefront through the software's business intelligence. It makes presenting data and milestones achieved to non-technical management quite simple and can be extremely useful.
A de minimis incentive was given to thank the reviewer for their time. The incentive was not used to bias or drive a particular response, nor was the incentive contingent on a positive endorsement. More Info
Noetix makes reporting easy. Users can combine vtables (the Noetix term for its views), add or delete columns, add filters or parameters, sort, add totals to columns, all from an easy to use interface. It comes with a very large number of already written reports for all areas of Oracle reporting, but it also allows for custom vtables to be written, for Oracle or any database, to expand the number of available reports.
Noetix has an Excel add-in that is marvelous. It eliminates the need to run a report in the web application and export to Excel. The add-in can run very large reports, up to a million lines. Once a report is run in Excel, it can be saved, and then refreshed whenever needed. It's a really good tool.
Noetix is flexible. Joins can be added to existing Noetix vtables and also to custom vtables, to give users a large amount of data configurations to choose from. It also allows users to create calculated fields to any report.
Noetix is easy to administer. Users can be added or removed and grouped by the level of permission. Although, in our case, it validates against Oracle, the level of security is dictated by Noetix.
A de minimis incentive was given to thank the reviewer for their time. The incentive was not used to bias or drive a particular response, nor was the incentive contingent on a positive endorsement. More Info
This allows us to keep track of our team's work by integrating with our product boards on JIRA.
It allows us to create visualized reports for our team's progress.
It allows us to gain insights about things that are going well in our product pipeline as well as potential areas of concern based on the data that is collected.
A de minimis incentive was given to thank the reviewer for their time. The incentive was not used to bias or drive a particular response, nor was the incentive contingent on a positive endorsement. More Info
I like the fact that the output is standard, but I would like to be able to move columns around on the output screen, rather than having to go back to the editing screen, move the columns, then rerun the report.
Drag and drop of columns would be nice on the edit screen. Currently if you add a column to a report, it automatically goes to the bottom. Relocation of the column has to be done a line at a time. I would prefer to be able to grab the field I want from those available, and drop it into the report where I want it.
When adding a filter (or parameter), the available fields automatically come up in alphabetical order, but on the columns screen, they don't. They come up in the order they actually are in the query. That means, when creating custom vtables, to have the fields in alphabetical order, one must put them that way. It would be nice if Noetix put the fields in alphabetical order for the user.
A de minimis incentive was given to thank the reviewer for their time. The incentive was not used to bias or drive a particular response, nor was the incentive contingent on a positive endorsement. More Info
A de minimis incentive was given to thank the reviewer for their time. The incentive was not used to bias or drive a particular response, nor was the incentive contingent on a positive endorsement. More Info
I believe Noetix is much easier to use than either Crystal Reports or InfoMaker. When I worked with InfoMaker I used to say it took 5 minutes to get the data and 5 hours (and sometimes days) to make it look good. The same can be true for Crystal Reports. Noetix has a standard format, and most people export to Excel anyway. Who prints reports? So formatting is not all that important.
A de minimis incentive was given to thank the reviewer for their time. The incentive was not used to bias or drive a particular response, nor was the incentive contingent on a positive endorsement. More Info
Jama Analyze, as well as Asana, connect with JIRA to visualize milestone tracking and team progress. While Asana is cheaper, Jama Analyze provides better reports and visual data. Google Data Studio, through a bit of tinkering from your software development team, can achieve similar results, however, the charts and graphs leave a bit to be desired in terms of design. In all, Jama Analyze is great if you have few users and don't need to go for the licensing option. Otherwise, there are definitely cheaper options available but you may have to sacrifice on performance and look-and-feel.
A de minimis incentive was given to thank the reviewer for their time. The incentive was not used to bias or drive a particular response, nor was the incentive contingent on a positive endorsement. More Info