Formerly from Magnitude Software and now from Insightsoftware, Angles is a solution to accelerate the distribution of actionable, operational reports and analytics.
N/A
Panorama Necto
Score 8.0 out of 10
N/A
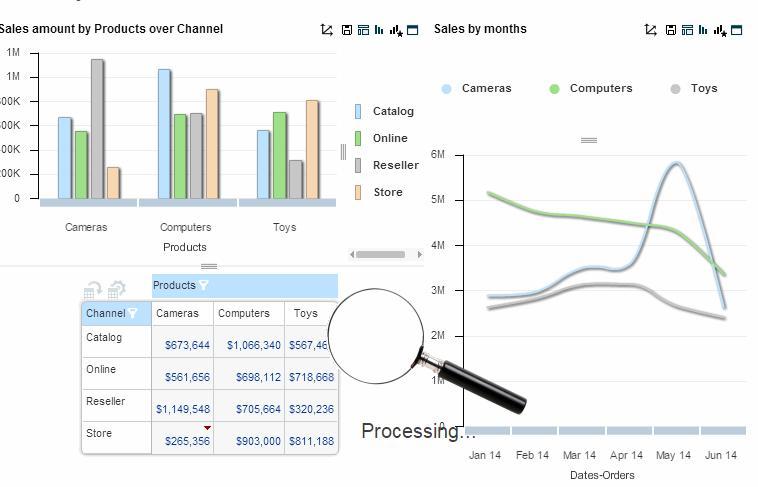
Panorama Necto is a business intelligence solution that provides enterprises with new ways to collaborate and create unique contextual connections. Some key features include: Workboards/Dashboards, Advanced Analytics, and Contextual Discovery.
I believe Noetix is much easier to use than either Crystal Reports or InfoMaker. When I worked with InfoMaker I used to say it took 5 minutes to get the data and 5 hours (and sometimes days) to make it look good. The same can be true for Crystal Reports. Noetix has a standard …
More visually enriched infographics and geo analytics and lower license cost means Panorama is a front runner in comparison to the tools mentioned above.
This is the next generation BI tool, which will be very helpful for small and medium businesses to kick start data exploration and visualization of their diverse databases, with less intervention from IT. This tool is more end user centric and gives way more power to the end …
Micro strategy and SAP business objects require building cubes. This requires lots of SQL language and a need to export them to a repository so they can be used to build ad hoc reports. They have to be scheduled to view or analyse the data in Excel or PowerPoint or PDF formats. …
One of the best tools in the market available today. I started getting attached to this tool recently and this never stops amazing me. I can connect to a variety of data sources and quickly analyze my data. The best part of this product is the built-in intelligence system which …
We can visualize the data right away in Necto. Where as we have to create reports in SAP Business Objects to present it to the business user. The reports have to be scheduled at particular time to get the presentation. We need to have additional SDK code for SAP Business …
We have evaluated few small vendor's BI tools for reporting purposes. Among other BI tools, we found Necto is quite easy to use and provides very good data visualization. Also it provides collaboration features which are least supported by other BI tools.
QA Lead & Test Analyst Disney Consumer Products for Satwic Inc
Chose Panorama Necto
In comparison with Pentaho Business Analytics, Panorama Necto 14 is providing similar features where it is distinguished through its provision of a suggestive analytics feature. This is fairly unique to the Panorama Necto 14 software where it analyzes information from various …
We are evaluating different data visualization tools and recently I tried Panorama Necto. I was really amazed with this product as it's a new age technology and powerful tool for visualizing data, creating reports. It comes with Infographics which is great and best unique …
All the above mentioned BI tools are complex from a maintenance perspective. They are not easy to learn. All those BI tools have limited cloud based reporting capability. Whereas Necto is a fully web based self service BI tool. It's collaborative capability makes it stack up …
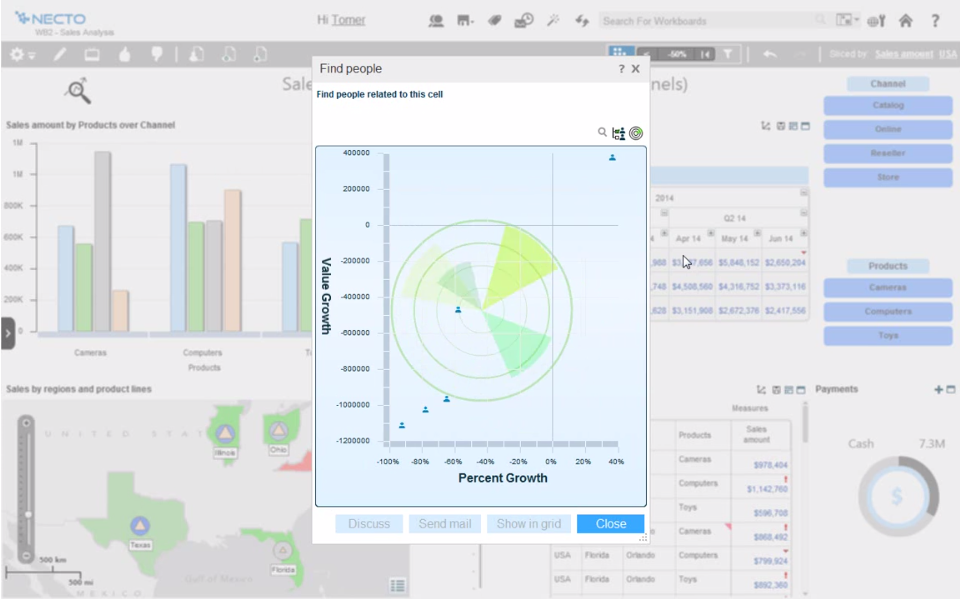
It provides attractive info-graphics according to user's interest. Their visual materiels are modern and stylish. You can use the same dashboard everywhere. Necto always keeps you up-to-date through mobile devices. It gives you many automated analysis and recommendations …
Collaboration on data is super powerful in the case of Necto and wins all the medals compared to other BI tools. The real time analysis for decision making is extremely easy and just a click away, which is really not a smooth case for other BI tools.
If you desire to 'empower' employees to create or edit their own reports, Noetix is a great tool, though I am not particularly an 'empowerment' person. In my experience most people have enough work of their own, so to tell them they now have to create their own reports can cause problems. If someone is available, like I am, to create the reports based on user requirements, then the report can be shared with the user and they can make changes as needed. I have several users who use the same report over and over for slightly different applications, and they are happy to make the small alterations, but creating whole new reports can seem like a daunting task. I tell my users I don't want them to become frustrated. If they want to try on their own, fine, but don't waste more than half an hour, and if you start to get frustrated, stop and IM me. Ninety-nine times out of 100 I already have a report that will give them exactly what they need. I've done extensive training, and find it's quite easy for users to pick up
How efficient is the tool for error handling capabilities? - In this case Panorama Necto has a unique feature of exceptional error handling capability and conditional error alerts that can be sent to stakeholders via email. An important question to ask while selecting any BI tool is, how good is the support? Panorama Necto has a group of highly knowledgeable and responsible support team members. The online video tutorials are very helpful and it's easy to learn this tool. This tool is very cost effective.
Noetix makes reporting easy. Users can combine vtables (the Noetix term for its views), add or delete columns, add filters or parameters, sort, add totals to columns, all from an easy to use interface. It comes with a very large number of already written reports for all areas of Oracle reporting, but it also allows for custom vtables to be written, for Oracle or any database, to expand the number of available reports.
Noetix has an Excel add-in that is marvelous. It eliminates the need to run a report in the web application and export to Excel. The add-in can run very large reports, up to a million lines. Once a report is run in Excel, it can be saved, and then refreshed whenever needed. It's a really good tool.
Noetix is flexible. Joins can be added to existing Noetix vtables and also to custom vtables, to give users a large amount of data configurations to choose from. It also allows users to create calculated fields to any report.
Noetix is easy to administer. Users can be added or removed and grouped by the level of permission. Although, in our case, it validates against Oracle, the level of security is dictated by Noetix.
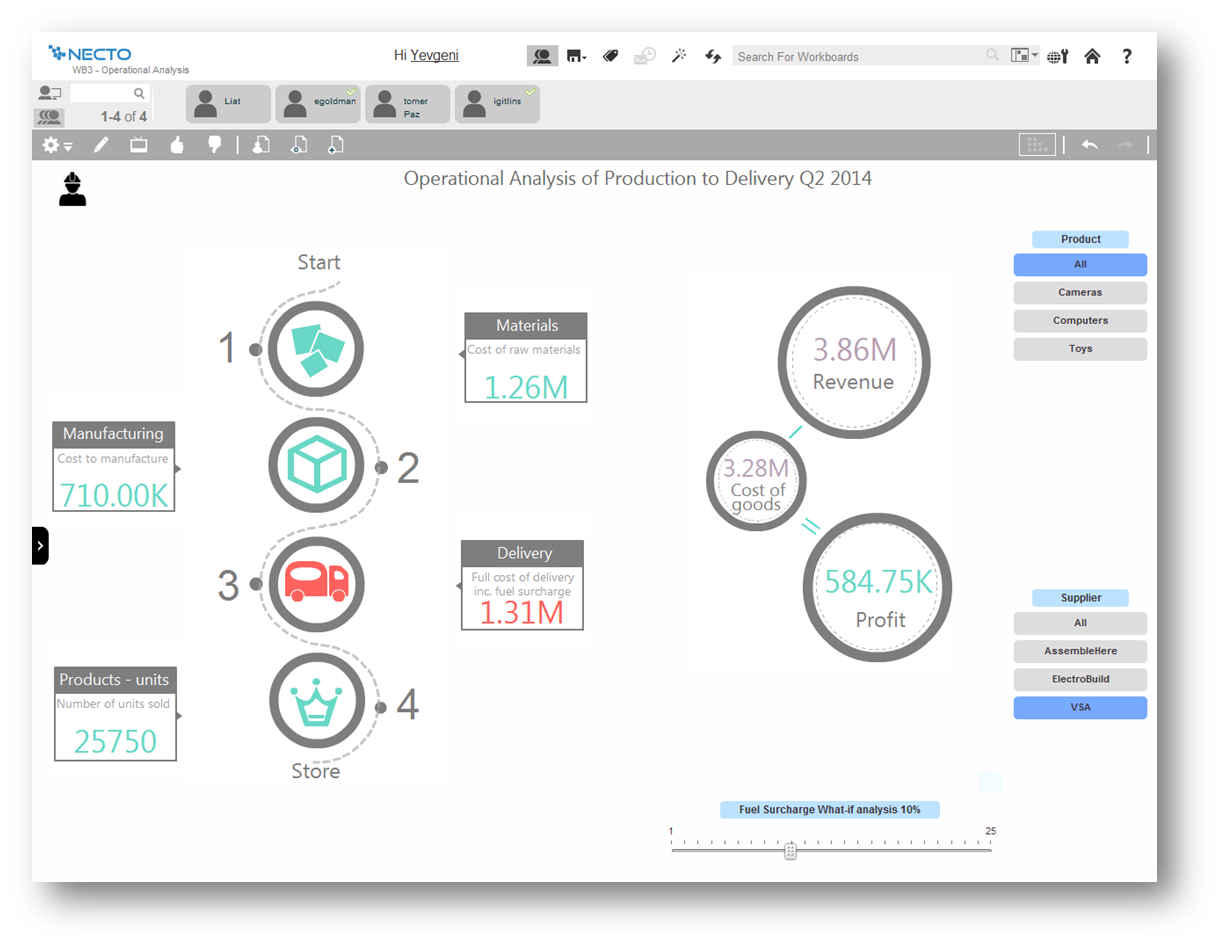
Comes with lot of option to modify and build the smart infographic. Uses innovative pictures and charts to create the dashboards
Helps you identify why you are succeeding and where you should shift your focus to.
The maps are amazing and they just don’t act as control points rather you can populate various measures on them making it really efficient to understand the business in geographical info graph
I like the fact that the output is standard, but I would like to be able to move columns around on the output screen, rather than having to go back to the editing screen, move the columns, then rerun the report.
Drag and drop of columns would be nice on the edit screen. Currently if you add a column to a report, it automatically goes to the bottom. Relocation of the column has to be done a line at a time. I would prefer to be able to grab the field I want from those available, and drop it into the report where I want it.
When adding a filter (or parameter), the available fields automatically come up in alphabetical order, but on the columns screen, they don't. They come up in the order they actually are in the query. That means, when creating custom vtables, to have the fields in alphabetical order, one must put them that way. It would be nice if Noetix put the fields in alphabetical order for the user.
Some features are very basic and sometimes you can't add your own SQL query for custom reports. For Macs and Blackberry users this application is not helpful. Non-languages are not supported in info-graphics. They need to improve their forecast analysis. Report sharing is limited among the portal users only
It provides all the features that are required and some that are not the basic requirements, but they represent a great additional capabilities, not available within the similar products
I believe Noetix is much easier to use than either Crystal Reports or InfoMaker. When I worked with InfoMaker I used to say it took 5 minutes to get the data and 5 hours (and sometimes days) to make it look good. The same can be true for Crystal Reports. Noetix has a standard format, and most people export to Excel anyway. Who prints reports? So formatting is not all that important.
In comparison with Pentaho Business Analytics, Panorama Necto 14 is providing similar features where it is distinguished through its provision of a suggestive analytics feature. This is fairly unique to the Panorama Necto 14 software where it analyzes information from various data sources and recommends solutions based on historical review