Logi Report vs. SAS Visual Analytics

Overview
ProductRatingMost Used ByProduct SummaryStarting Price
Logi Report
Score 9.0 out of 10
N/A
Logi Report (formerly JReport) is an embedded reporting platform provides developers and users with advanced pixel perfect, operational reporting capabilities for any data source. According to the vendor, JReport delivers insights for hundreds of thousands of users at over 10,000 installations worldwide. The vendor's goal is to empower ISVs and enterprise companies to embed the most sophisticated reports and dashboards into web applications. JReport developer Jinfonet…N/A
SAS Visual Analytics
Score 8.3 out of 10
Enterprise companies (1,001+ employees)
SAS Visual Analytics provides a complete platform for analytics visualization, enabling users to identify patterns and relationships in data that weren't initially evident. Interactive, self-service BI and reporting capabilities are combined with out-of-the-box advanced analytics so everyone can discover insights from any size and type of data, including text.
$0
Annual By Users: 5, 10, 20
Pricing
Logi ReportSAS Visual Analytics
Editions & Modules
No answers on this topic
SAS Visual Analytics for SAS Cloud
Annual By Users: 5, 10, 20
Offerings
Pricing Offerings
Logi ReportSAS Visual Analytics
Free Trial
YesYes
Free/Freemium Version
NoNo
Premium Consulting/Integration Services
YesYes
Entry-level Setup FeeOptionalNo setup fee
Additional Details—SAS Visual Statistics and SAS Office Analytics are also available as add-ons.
More Pricing Information
Features
Logi ReportSAS Visual Analytics
BI Standard Reporting
Comparison of BI Standard Reporting features of Product A and Product B
Logi Report
8.8
6 Ratings
21% above category average
SAS Visual Analytics
8.3
12 Ratings
1% above category average
Pixel Perfect reports8.55 Ratings8.012 Ratings
Customizable dashboards9.16 Ratings8.012 Ratings
Report Formatting Templates8.86 Ratings9.011 Ratings
Ad-hoc Reporting
Comparison of Ad-hoc Reporting features of Product A and Product B
Logi Report
9.4
6 Ratings
18% above category average
SAS Visual Analytics
8.8
13 Ratings
8% above category average
Drill-down analysis9.16 Ratings9.013 Ratings
Formatting capabilities9.16 Ratings8.013 Ratings
Report sharing and collaboration9.46 Ratings10.012 Ratings
Integration with R or other statistical packages00 Ratings8.011 Ratings
Data Discovery and Visualization
Comparison of Data Discovery and Visualization features of Product A and Product B
Logi Report
8.8
6 Ratings
13% above category average
SAS Visual Analytics
9.7
11 Ratings
18% above category average
Pre-built visualization formats (heatmaps, scatter plots etc.)9.56 Ratings10.010 Ratings
Location Analytics / Geographic Visualization9.25 Ratings10.011 Ratings
Predictive Analytics7.63 Ratings9.010 Ratings
Access Control and Security
Comparison of Access Control and Security features of Product A and Product B
Logi Report
9.3
6 Ratings
20% above category average
SAS Visual Analytics
8.3
12 Ratings
3% below category average
Multi-User Support (named login)9.66 Ratings9.012 Ratings
Role-Based Security Model9.66 Ratings8.011 Ratings
Multiple Access Permission Levels (Create, Read, Delete)9.66 Ratings8.012 Ratings
Single Sign-On (SSO)8.45 Ratings8.08 Ratings
Application Program Interfaces (APIs) / Embedding
Comparison of Application Program Interfaces (APIs) / Embedding features of Product A and Product B
Logi Report
9.3
5 Ratings
20% above category average
SAS Visual Analytics
9.2
6 Ratings
15% above category average
REST API10.01 Ratings10.05 Ratings
Javascript API9.14 Ratings9.05 Ratings
iFrames8.63 Ratings9.05 Ratings
Java API8.95 Ratings9.05 Ratings
Themeable User Interface (UI)00 Ratings9.05 Ratings
Customizable Platform (Open Source)00 Ratings9.03 Ratings
Report Output and Scheduling
Comparison of Report Output and Scheduling features of Product A and Product B
Logi Report
-
Ratings
SAS Visual Analytics
9.2
13 Ratings
10% above category average
Publish to Web00 Ratings9.012 Ratings
Publish to PDF00 Ratings9.013 Ratings
Report Versioning00 Ratings9.010 Ratings
Report Delivery Scheduling00 Ratings10.012 Ratings
Delivery to Remote Servers00 Ratings9.07 Ratings
Mobile Capabilities
Comparison of Mobile Capabilities features of Product A and Product B
Logi Report
-
Ratings
SAS Visual Analytics
8.3
10 Ratings
4% above category average
Responsive Design for Web Access00 Ratings10.010 Ratings
Mobile Application00 Ratings9.08 Ratings
Dashboard / Report / Visualization Interactivity on Mobile00 Ratings9.09 Ratings
Best Alternatives
Logi ReportSAS Visual Analytics
Small Businesses
BrightGauge
BrightGauge
Score 8.9 out of 10
BrightGauge
BrightGauge
Score 8.9 out of 10
Medium-sized Companies
Reveal
Reveal
Score 9.9 out of 10
Reveal
Reveal
Score 9.9 out of 10
Enterprises
Sigma
Sigma
Score 9.1 out of 10
Jaspersoft Community Edition
Score 9.7 out of 10
All AlternativesView all alternativesView all alternatives
User Ratings
Logi ReportSAS Visual Analytics
Likelihood to Recommend
9.0
(7 ratings)
9.0
(18 ratings)
Likelihood to Renew
-
(0 ratings)
9.3
(3 ratings)
Usability
-
(0 ratings)
6.0
(1 ratings)
Support Rating
-
(0 ratings)
8.0
(3 ratings)
User Testimonials
Logi ReportSAS Visual Analytics
Likelihood to Recommend
Insightsoftware, Inc
JReport is well suited to enterprise-wide deployment such as we deliver in our data warehouse solution JOHO OneSource(TM). It provides for a seamless end-user experience to enterprise-wide corporate data, maintain user-level security regardless of location or device used. Reporting elements are always "business-friendly", reducing confusion for the less sophisticated information consumer. Since JReport is highly scalable, it is hard to imagine a deployment where it would not be well suited. The only case I can think of is possibly one where there are limited or no reporting staff onsite to create report elements.
Read full review
SAS
I was in a meeting with the client and there I have to show them some analytic data to them. But I was confused about how I will manage to show big data to clients with accuracy. But then the SAS Visual Analytics software helps me in presenting accurate data at the moment and it was very presentable and through that, I got the deal for that business.
Read full review
Pros
Insightsoftware, Inc
  • Creates powerful reports and charts
  • Highly customizable and can fit multiple needs
  • Distributed Architecture offers higher reliability and avoids single point of failure
Read full review
SAS
  • Provides the flexibility to the end user to slice and dice the data.
  • Anyone can make predictive models with the help of in-built algorithms without the need to write a single line of code or knowledge of what's under the hood of algorithms.
  • The feature to simply ask a question related to data and getting a response in form of text, chart or graph is amazing.
Read full review
Cons
Insightsoftware, Inc
  • Initially, the product lacked some features but their support team reacted quickly to meet our needs.
  • The JReport desktop designer looks a bit dated, however, the Web GUI looks very modern.
Read full review
SAS
  • SAS is relatively expensive when compared to other BI tools and requires a large amount of upfront fee which becomes an issue for smaller organizations.
  • UI for the dashboards looks a little date in comparison to competitors like Tableau and Microstrategy.
  • Integration with other open source software like Python needs to be built in.
Read full review
Likelihood to Renew
Insightsoftware, Inc
No answers on this topic
SAS
SAS really is the cutting edge in Business Intelligence. That is all they do! They are constantly coming out with new products, product upgrades, and their tech support is second to none. In addition, their support of Education has made our ability to acquire their product possible.
Read full review
Usability
Insightsoftware, Inc
No answers on this topic
SAS
SAS BI is good for creating reports and dashboards and then sharing it with the users. It also has ability to manage access to the reports and dashboards but somehow with most of the world moving to open source languages R, Python and Julia, SAS BI feels to be archaic in terms of feature set and integrations it allow[s]. Also, comparing it with other Business Intelligence tools like Tableau and Microsoft BI, the functionality of SAS BI is very limited and doesn't justify the pricing.
Read full review
Support Rating
Insightsoftware, Inc
No answers on this topic
SAS
When you call tech support, you are immediately routed to a person who can answer your question. Often they can answer on the spot. However, if they cannot, you are given a track number and then followed up with. There have been times when I have had multiple track numbers open and they will actually TRACK YOU DOWN to ensure that your problem has been resolved. Issues do not fall into black holes with SAS. They are also willing to do a WebEx with you to diagnose the problem by seeing your environment, which is always helpful.
Read full review
Alternatives Considered
Insightsoftware, Inc
We have been using Logi Report for many years. We did review Microsoft PowerBI recently and are currently considering if it will meet our needs. We are still evaluating at the moment.
Read full review
SAS
SAS Business Intelligence is not the cream of the crop for business intelligence applications, but it is not far behind. The software is generally easier to apply than most other business intelligence software. Additionally, SAS Business Intelligence runs smoothly in the background when making real-time updates. With that said, the software is not as efficient of many of the other business intelligence software applications that have been on the market for longer than this one.
Read full review
Return on Investment
Insightsoftware, Inc
  • Handy dashboard
  • Create reports in various formats
  • Would like to see a longer listing of reports per screen on the scheduler in JReport Server/Admin Console as we have a lot of reports we run.
Read full review
SAS
  • SAS Visual Analytics licensing cost should be reduced to enable users to use it in mass scale.
  • More statistical and mathematical equations and theories should be converted into SAS functions for reusing.
  • Because of enriched ETL and reporting capabilities SAS Visual Analytics is most preferred by business users.
Read full review
ScreenShots

Logi Report Screenshots

Screenshot of Screenshot of Screenshot of Screenshot of Screenshot of Screenshot of

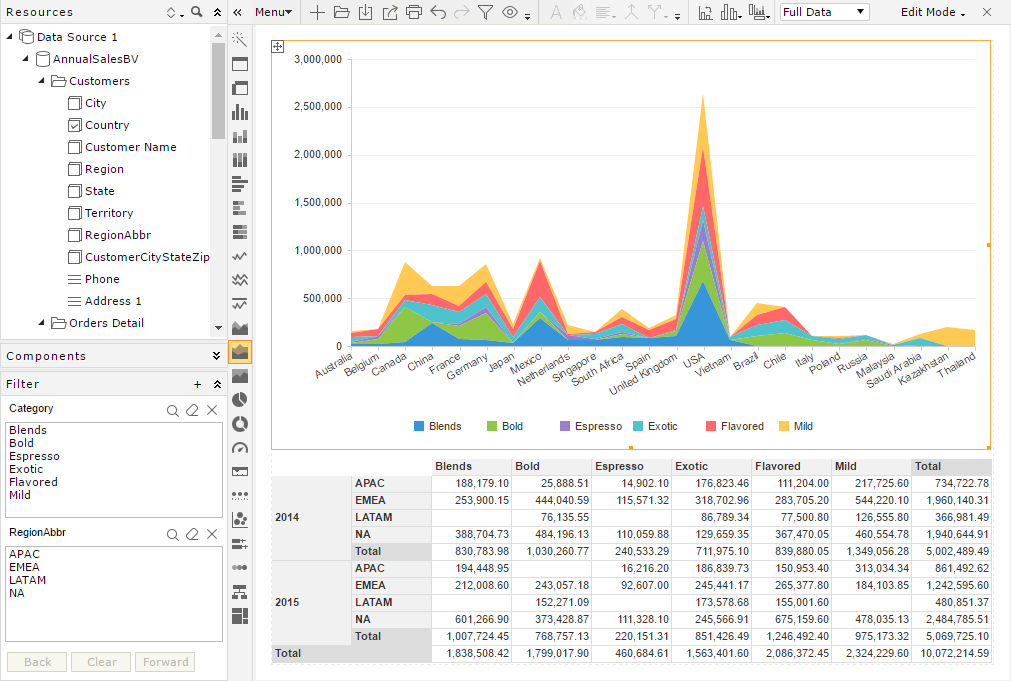
SAS Visual Analytics Screenshots

Screenshot of Explore your data using analytics and interactive data visualizations.