Microsoft Power BI Embedded vs. Watershed LRS
Microsoft Power BI Embedded vs. Watershed LRS
| Product | Rating | Most Used By | Product Summary | Starting Price |
|---|---|---|---|---|
 Microsoft Power BI Embedded | N/A | A solution from Microsoft to provide customer-facing reports, dashboards, and analytics in applications by using and branding Power BI as one's own. Designed to reduce developer resources by automating the monitoring, management, and deployment of analytics, while getting full control of Power BI features and intelligent analytics. | N/A | |
 Watershed LRS | N/A | Watershed LRS is a learning management software solution built to help employers identify skills and competencies. | $0 |
| Microsoft Power BI Embedded | Watershed LRS | |||||||||||||||
|---|---|---|---|---|---|---|---|---|---|---|---|---|---|---|---|---|
| Editions & Modules | No answers on this topic |
| ||||||||||||||
| Offerings |
| |||||||||||||||
| Entry-level Setup Fee | No setup fee | Optional | ||||||||||||||
| Additional Details | — | — | ||||||||||||||
| More Pricing Information | ||||||||||||||||
| Microsoft Power BI Embedded | Watershed LRS |
|---|
| Microsoft Power BI Embedded | Watershed LRS | |||||||||||||||||||||
|---|---|---|---|---|---|---|---|---|---|---|---|---|---|---|---|---|---|---|---|---|---|---|
| BI Standard Reporting |
| |||||||||||||||||||||
| Ad-hoc Reporting |
| |||||||||||||||||||||
| Data Discovery and Visualization |
| |||||||||||||||||||||
| Access Control and Security |
| |||||||||||||||||||||
| Application Program Interfaces (APIs) / Embedding |
| |||||||||||||||||||||
| Report Output and Scheduling |
| |||||||||||||||||||||
| Mobile Capabilities |
|
| Microsoft Power BI Embedded | Watershed LRS | |
|---|---|---|
| Small Businesses |  Yellowfin Score 8.7 out of 10 | Yellowfin Score 8.7 out of 10 |
| Medium-sized Companies |  Reveal Score 10.0 out of 10 | Reveal Score 10.0 out of 10 |
| Enterprises |  Infor Birst Score 6.4 out of 10 |  Kyvos Semantic Layer Score 9.5 out of 10 |
| All Alternatives | View all alternatives | View all alternatives |
| Microsoft Power BI Embedded | Watershed LRS | |
|---|---|---|
| Likelihood to Recommend | 8.7 (11 ratings) | 9.0 (1 ratings) |
| Usability | - (0 ratings) | 9.0 (1 ratings) |
| Support Rating | - (0 ratings) | 10.0 (1 ratings) |
| Microsoft Power BI Embedded | Watershed LRS | |
|---|---|---|
| Likelihood to Recommend | Microsoft
| Watershed Systems, Inc
|
| Pros | Microsoft
| Watershed Systems, Inc
|
| Cons | Microsoft
| Watershed Systems, Inc
|
| Usability | Microsoft
| Watershed Systems, Inc
|
| Support Rating | Microsoft No answers on this topic | Watershed Systems, Inc
|
| Alternatives Considered | Microsoft
 Aryan Ambani Architectural Intern | Watershed Systems, Inc No answers on this topic |
| Return on Investment | Microsoft
| Watershed Systems, Inc
|
| ScreenShots | Watershed LRS Screenshots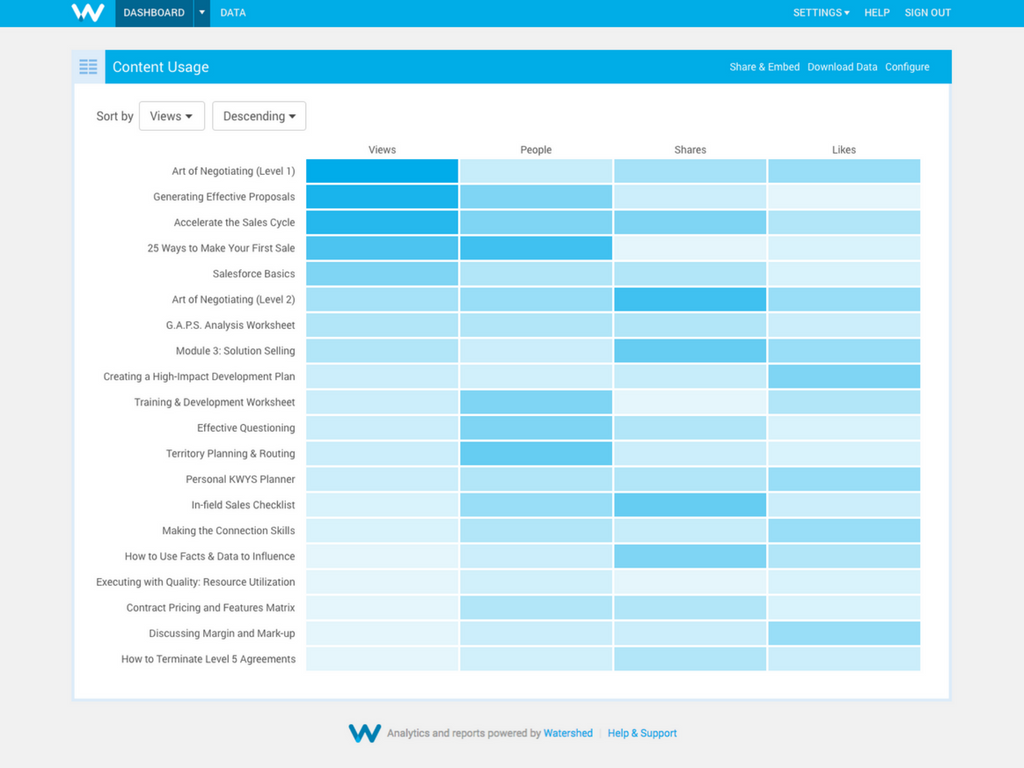   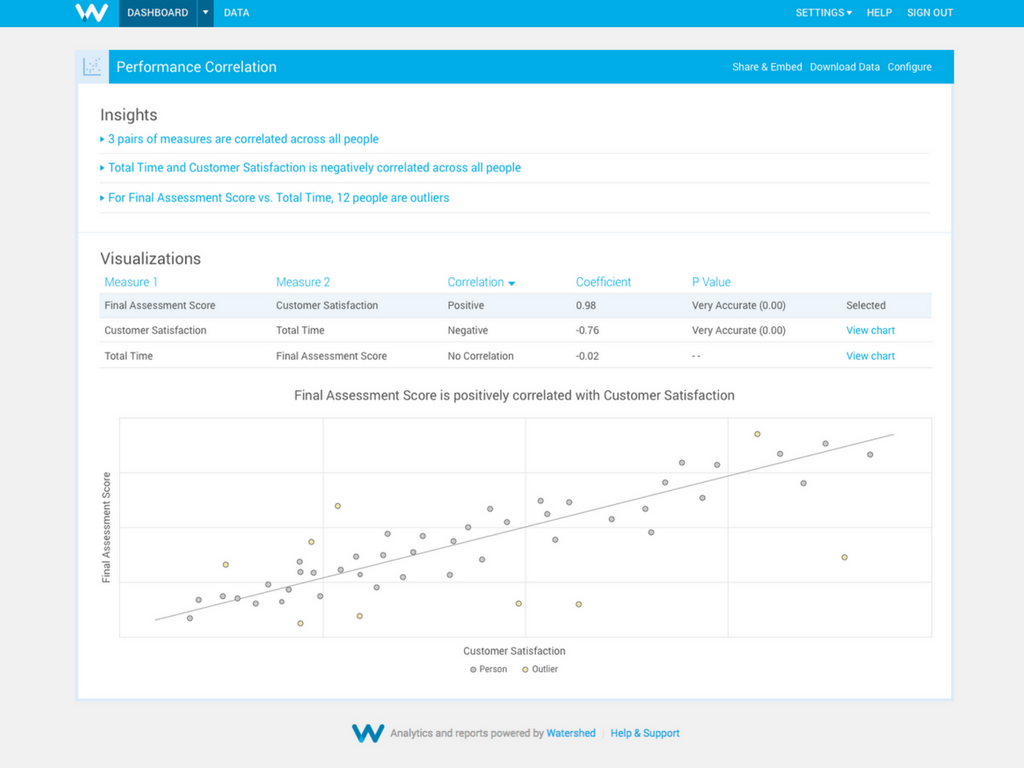  |