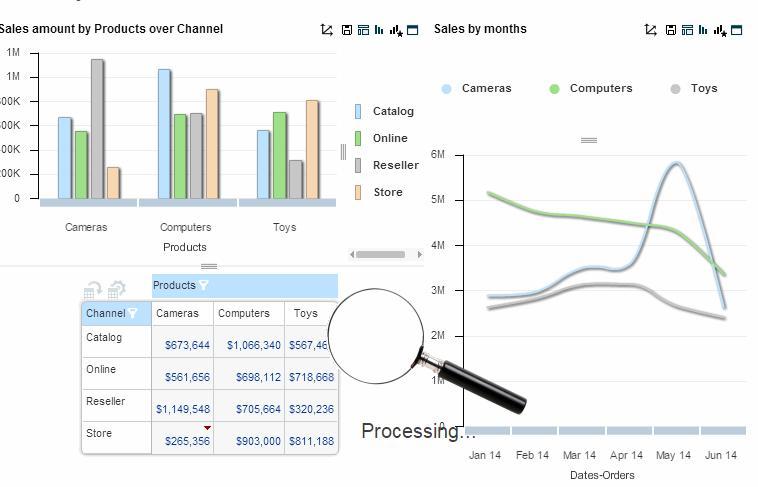
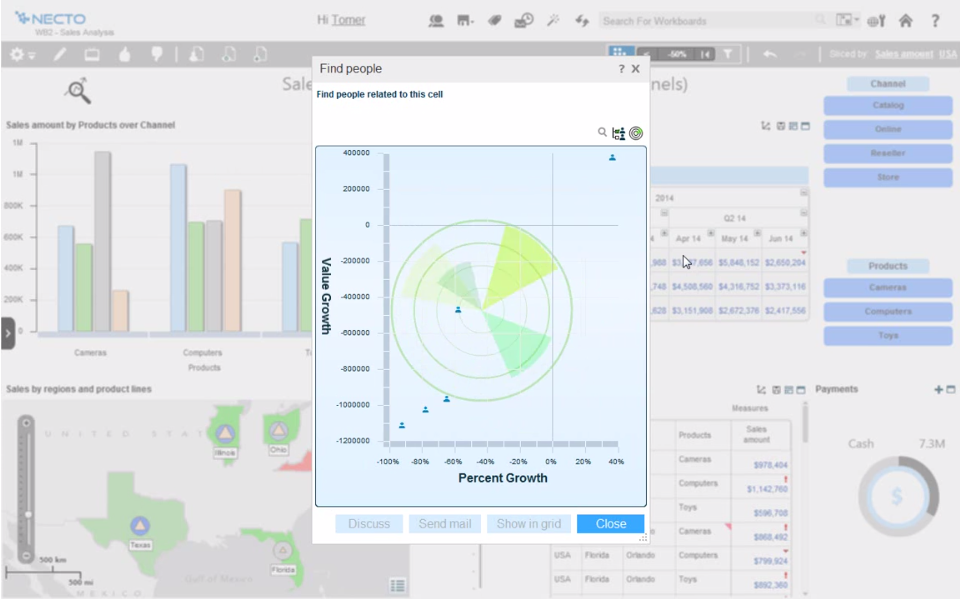
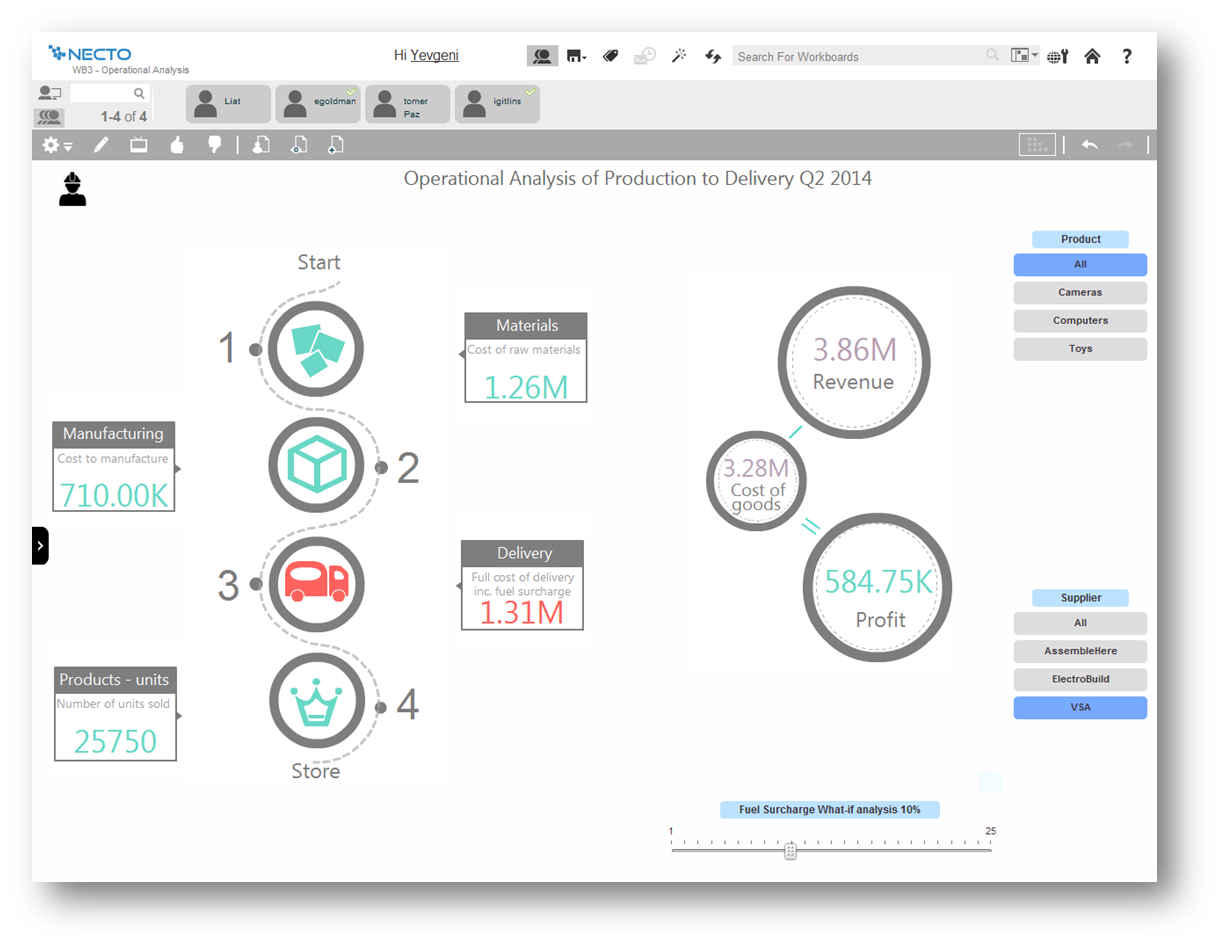
Panorama Necto is a business intelligence solution that provides enterprises with new ways to collaborate and create unique contextual connections. Some key features include: Workboards/Dashboards, Advanced Analytics, and Contextual Discovery.
N/A
Zendesk Explore
Score8.1 out of 10
N/A
Zendesk offers Explore, a business intelligence and customer analytics tool which integrates with the Zendesk suite featuring ticket analytics, custom fields, dashboards, and other features. Zendesk is migrating customers of the BIME analytics product, which is approaching end of support, to Zendesk Explore in 2019.
Panorama Necto 14 is well suited where BI is built to support social collaboration so that its analytics features can be shared to improve decision making by incorporating various organizational input. Additionally it supports an infographic display for information review which is unlike most of its competitors.
Zendesk Explore is well suited for tracking ticket flow, agent performance, and customer satisfaction providing valuable insights into response and resolution time, workload and support quality. Particularly useful for monitoring ticket handling for different teams. Helps ensure accountability by tracking how long tickets remain assigned before being reassigned to another group. Drill down capability helps identify support bottlenecks. However, it is less appropriate for real time monitoring as it lacks real time data updates making it unsuitable for instant decision making.
A de minimis incentive was given to thank the reviewer for their time. The incentive was not used to bias or drive a particular response, nor was the incentive contingent on a positive endorsement. More Info
Comes with lot of option to modify and build the smart infographic. Uses innovative pictures and charts to create the dashboards
Helps you identify why you are succeeding and where you should shift your focus to.
The maps are amazing and they just don’t act as control points rather you can populate various measures on them making it really efficient to understand the business in geographical info graph
A de minimis incentive was given to thank the reviewer for their time. The incentive was not used to bias or drive a particular response, nor was the incentive contingent on a positive endorsement. More Info
This tool is relatively new to the current competitive BI market. Many organizations or business analyst are not yet aware of it's eye catching features.
Need more enhancement for predictive analysis.
Publishing reports as email attachment and mail server configuration is a little complicated process.
Some aspects of Zendesk, in general, are not super intuitive. The same goes for Zendesk Explore. And, while you can google answers and hope you find something helpful, there isn't a great way to learn to get the full potential out of the product unless you want to pay for someone from your team to take a class (which costs several hundred dollars).
To piggyback off the last point, if you would prefer to get help from a Zendesk expert, you'll find that there is almost no customer support available to you. For a company that aims to help other companies help their customers, this has always struck me as odd. Again, Google is your friend and beyond that, you're mostly out of luck.
A de minimis incentive was given to thank the reviewer for their time. The incentive was not used to bias or drive a particular response, nor was the incentive contingent on a positive endorsement. More Info
Some features are very basic and sometimes you can't add your own SQL query for custom reports. For Macs and Blackberry users this application is not helpful. Non-languages are not supported in info-graphics. They need to improve their forecast analysis. Report sharing is limited among the portal users only
It provides all the features that are required and some that are not the basic requirements, but they represent a great additional capabilities, not available within the similar products
I rate Zendesk Explore 8 out of 10 for it's overall usability because it offers powerful reporting and analytics with an easy to navigate interface and intuitive dashboards. It helps improve customer satisfaction by providing valuable insights into ticket handling, agent performance and customer satisfaction. Though the complex query builder can be challenging for non technical users.
A de minimis incentive was given to thank the reviewer for their time. The incentive was not used to bias or drive a particular response, nor was the incentive contingent on a positive endorsement. More Info
Support for all of Zendesk has exceeding my expectations. This company will always get a 10 out of 10 in my book. Any question you have they make sure you have the answer plus a step-by-step guide on how to do each step so you are set up for success!
A de minimis incentive was given to thank the reviewer for their time. The incentive was not used to bias or drive a particular response, nor was the incentive contingent on a positive endorsement. More Info
This is the next generation BI tool, which will be very helpful for small and medium businesses to kick start data exploration and visualization of their diverse databases, with less intervention from IT. This tool is more end user centric and gives way more power to the end user to perform data analysis
I selected Zendesk Explore only to provide an easy and quick access for my managers and supervisors regading metrics and volume trends. Is not the most flexible nor complete data visualization tool, but works well for day-to-day follow ups. You need to use another tool if you want to see long-term patterns (e.g. month over month volume trends) and you need another platform if you want your interaction metrics to interact with other important factors of the business
A de minimis incentive was given to thank the reviewer for their time. The incentive was not used to bias or drive a particular response, nor was the incentive contingent on a positive endorsement. More Info