
PingPlotter vs. UVexplorer by UVnetworks
| Product | Rating | Most Used By | Product Summary | Starting Price |
|---|---|---|---|---|
 PingPlotter | Score8.7 out of 10 | N/A | PingPlotter is a graphical traceroute and ping tool that visualizes network performance in a way that makes identifying the source of problems quicker and easier for everyone from online gamers and video streamers to VoIP admins and IT pros. Features for remote deployment, network monitoring, scripting, and a web interface are included along with several additional capabilities. | $0 per user |
 UVexplorer | N/A | N/A | UVnetworks' focus is to provide simple solutions that help IT administrators identify, track, and troubleshoot their IT infrastructure. UVexplorer automatically discovers information about the devices on a network and the connections between them. It can be used to monitor the status of critical devices and services, and users can receive notifications when problems arise, tracking the network's performance using UVexplorer's Ping monitors, CPU monitors, Disk monitors, and Web Site monitors. | $1,795 per year 2500 Network Interfaces |
| PingPlotter | UVexplorer | |||||||||||||||
|---|---|---|---|---|---|---|---|---|---|---|---|---|---|---|---|---|
| Editions & Modules |
|
| ||||||||||||||
| Offerings |
| |||||||||||||||
| Entry-level Setup Fee | No setup fee | $1,000 one-time fee per installation | ||||||||||||||
| Additional Details | — | Volume tier available above 2,500 network interfaces. | ||||||||||||||
| More Pricing Information | ||||||||||||||||
| PingPlotter | UVexplorer | |
|---|---|---|
| Considered Both Products | No answer on this topic | No answer on this topic |
| Key User Insights | ||
| Would buy again | ||
100% Would buy again 33 Answers | No answers on this topic | |
| Delivers good value for the price | ||
96% Delivers good value for the price 24 Answers | No answers on this topic | |
| Happy with the feature set | ||
100% Happy with the feature set 33 Answers | No answers on this topic | |
| Lived up to sales and marketing promises | ||
100% Lived up to sales and marketing promises 21 Answers | No answers on this topic | |
| Implementation went as expected | ||
100% Implementation went as expected 31 Answers | No answers on this topic | |
| PingPlotter | UVexplorer | |||||||||||||||||||
|---|---|---|---|---|---|---|---|---|---|---|---|---|---|---|---|---|---|---|---|---|
| Network Performance Monitoring |
| |||||||||||||||||||
| PingPlotter | UVexplorer | |
|---|---|---|
| Small Businesses |  Auvik Score8.8 out of 10 | No answers on this topic |
| Medium-sized Companies |  Paessler PRTG Score8.4 out of 10 |  SolarWinds Network Configuration Manager (NCM) Score8.3 out of 10 |
| Enterprises |  Nmap Score8.7 out of 10 | SolarWinds Network Configuration Manager (NCM) Score8.3 out of 10 |
| All Alternatives | View all alternatives | View all alternatives |
| PingPlotter | UVexplorer | |
|---|---|---|
| Likelihood to Recommend | 8.8 | - |
| Usability | 9.1 | - |
| Support Rating | 9.0 | - |
| PingPlotter | UVexplorer | |
|---|---|---|
| Likelihood to Recommend |
| No answers on this topic |
| Pros |
| No answers on this topic |
| Cons |
| No answers on this topic |
| Usability |
| No answers on this topic |
| Support Rating |
| No answers on this topic |
| Alternatives Considered |
| No answers on this topic |
| Return on Investment |
| No answers on this topic |
| ScreenShots | PingPlotter Screenshots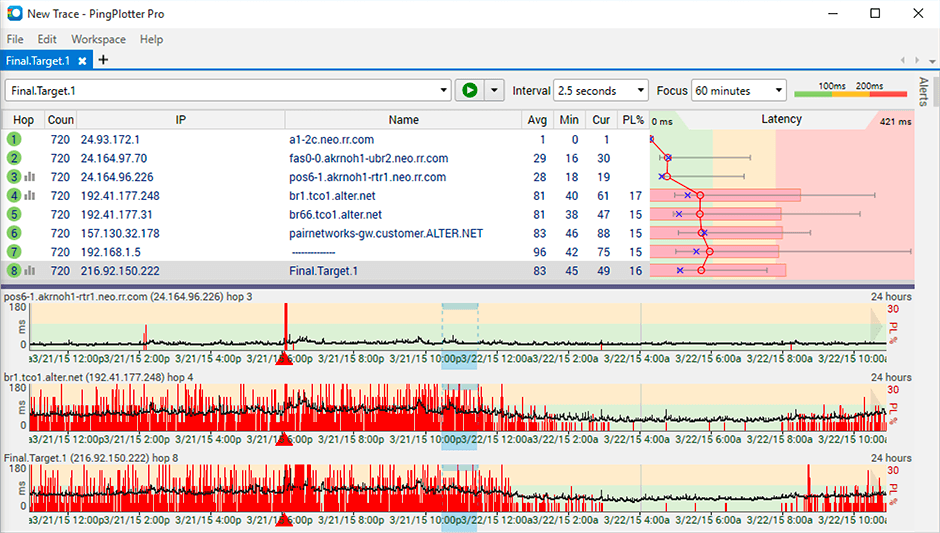   | UVexplorer Screenshots      |



