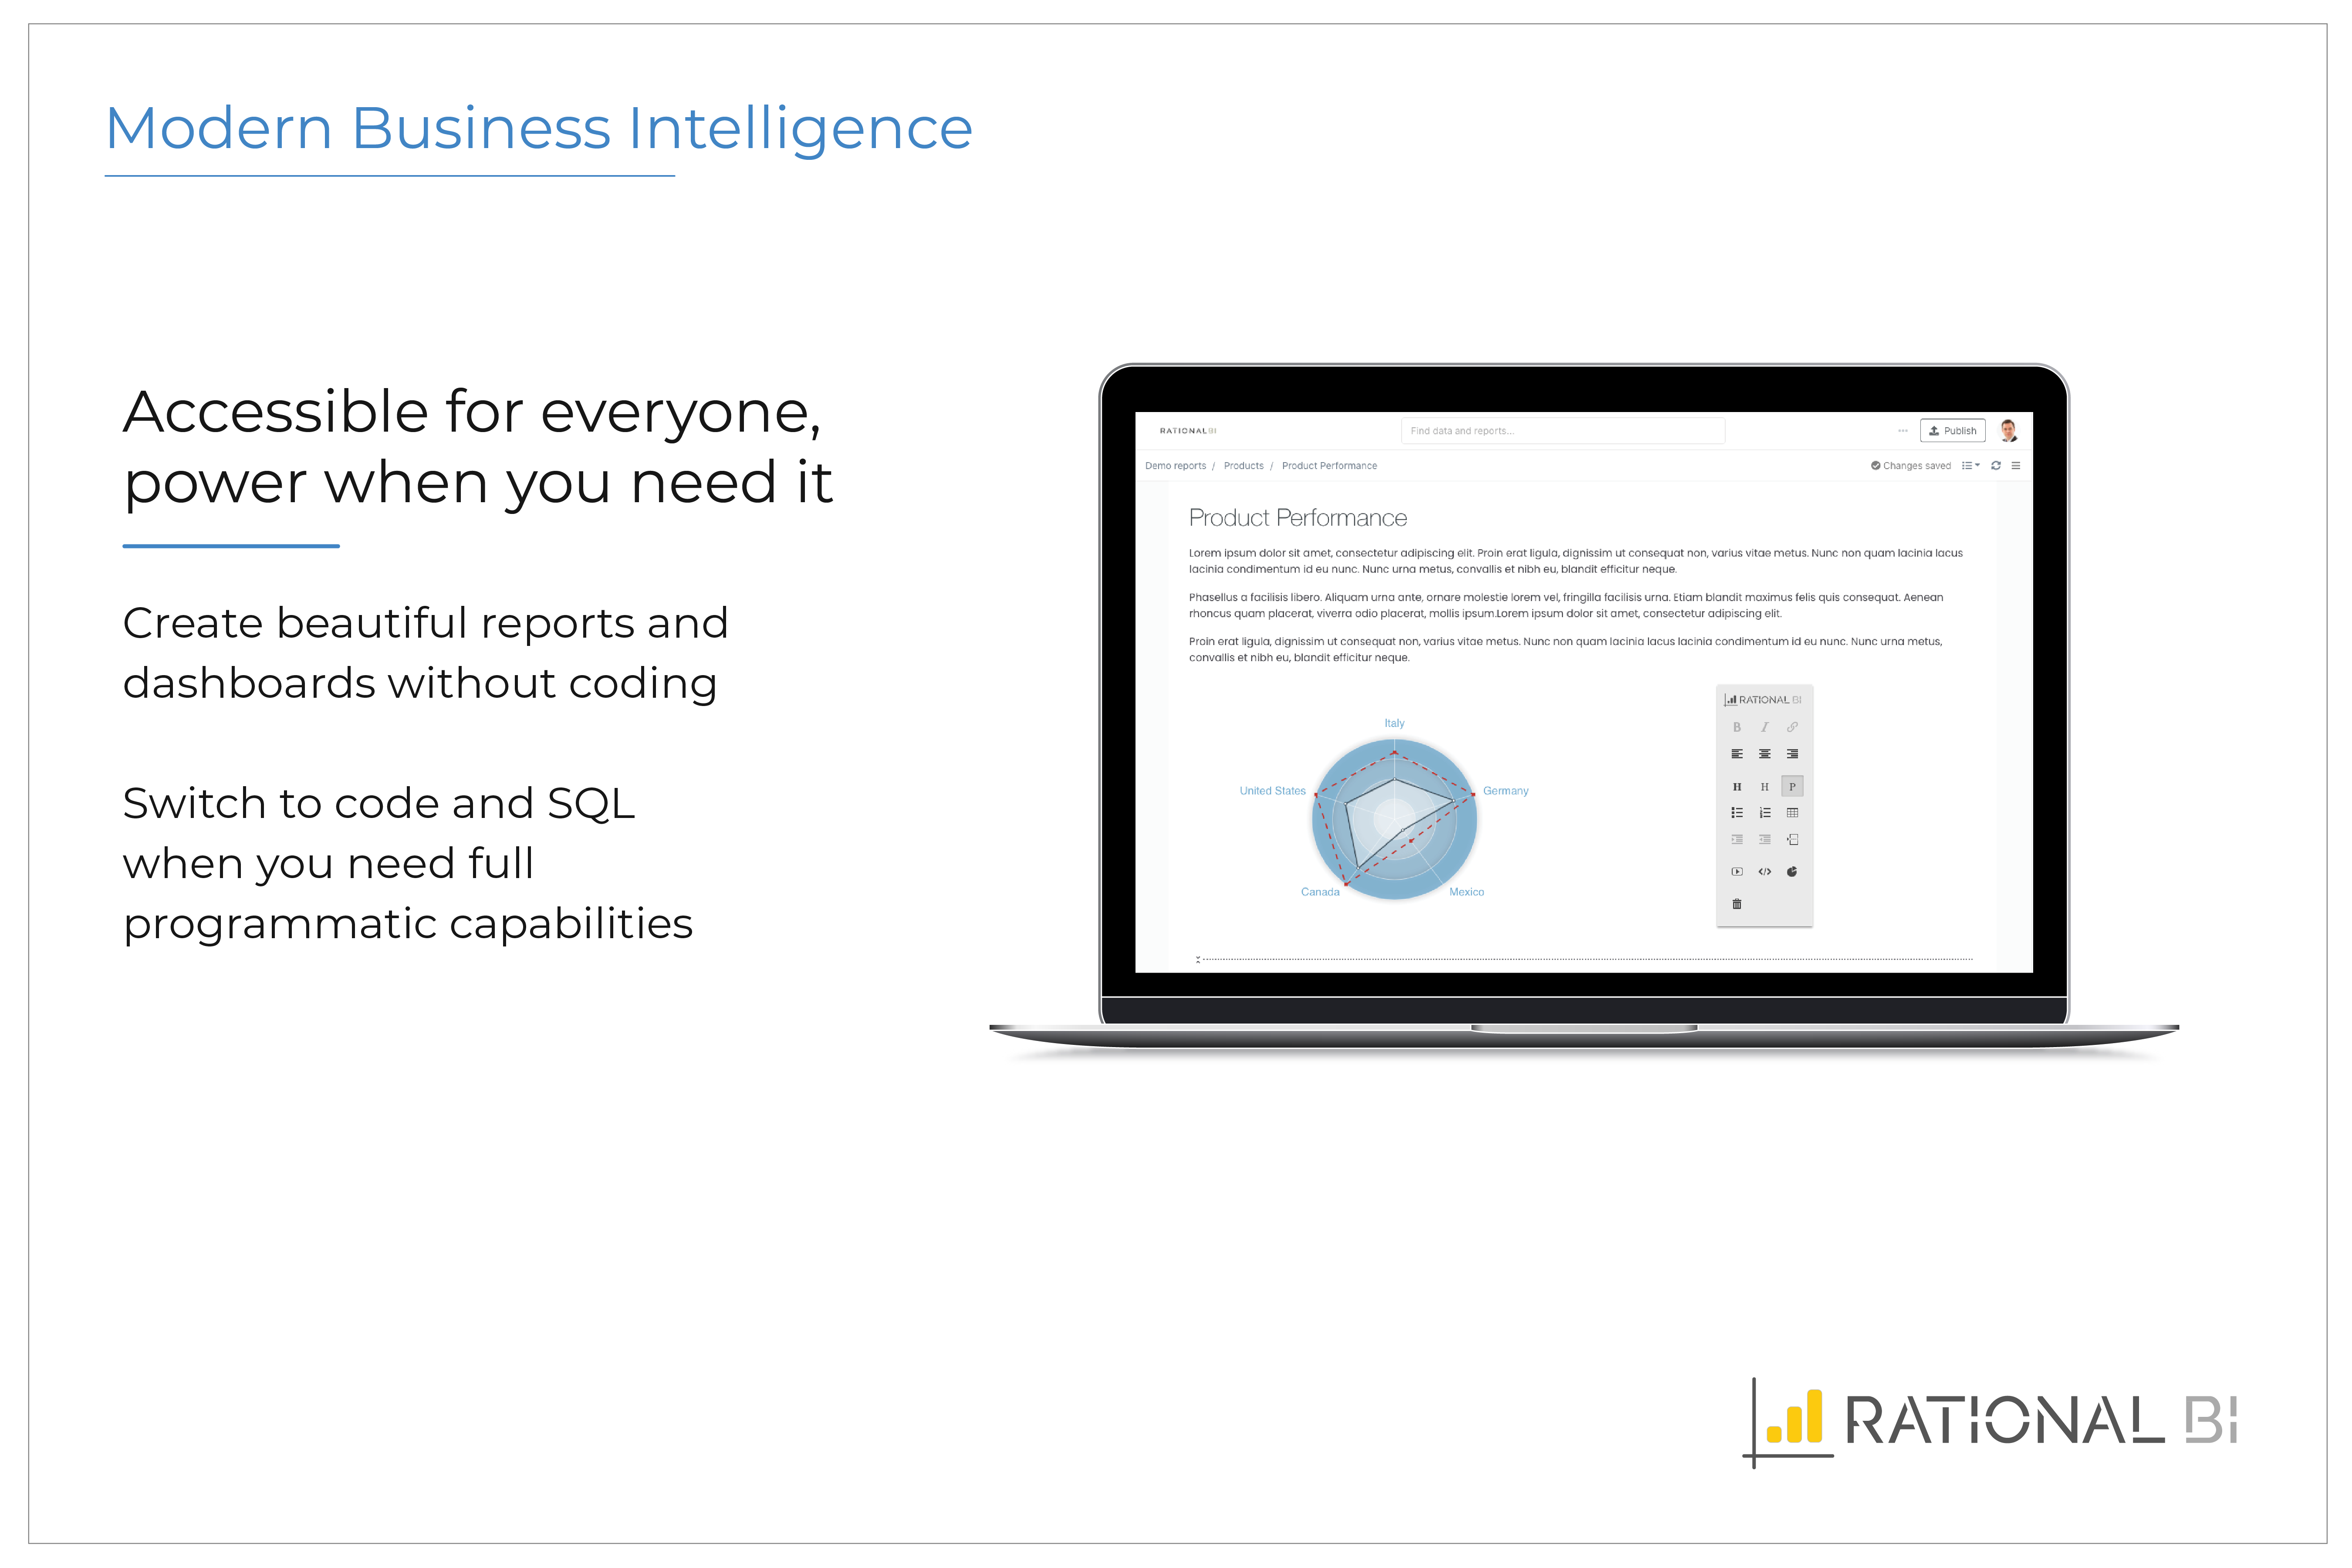
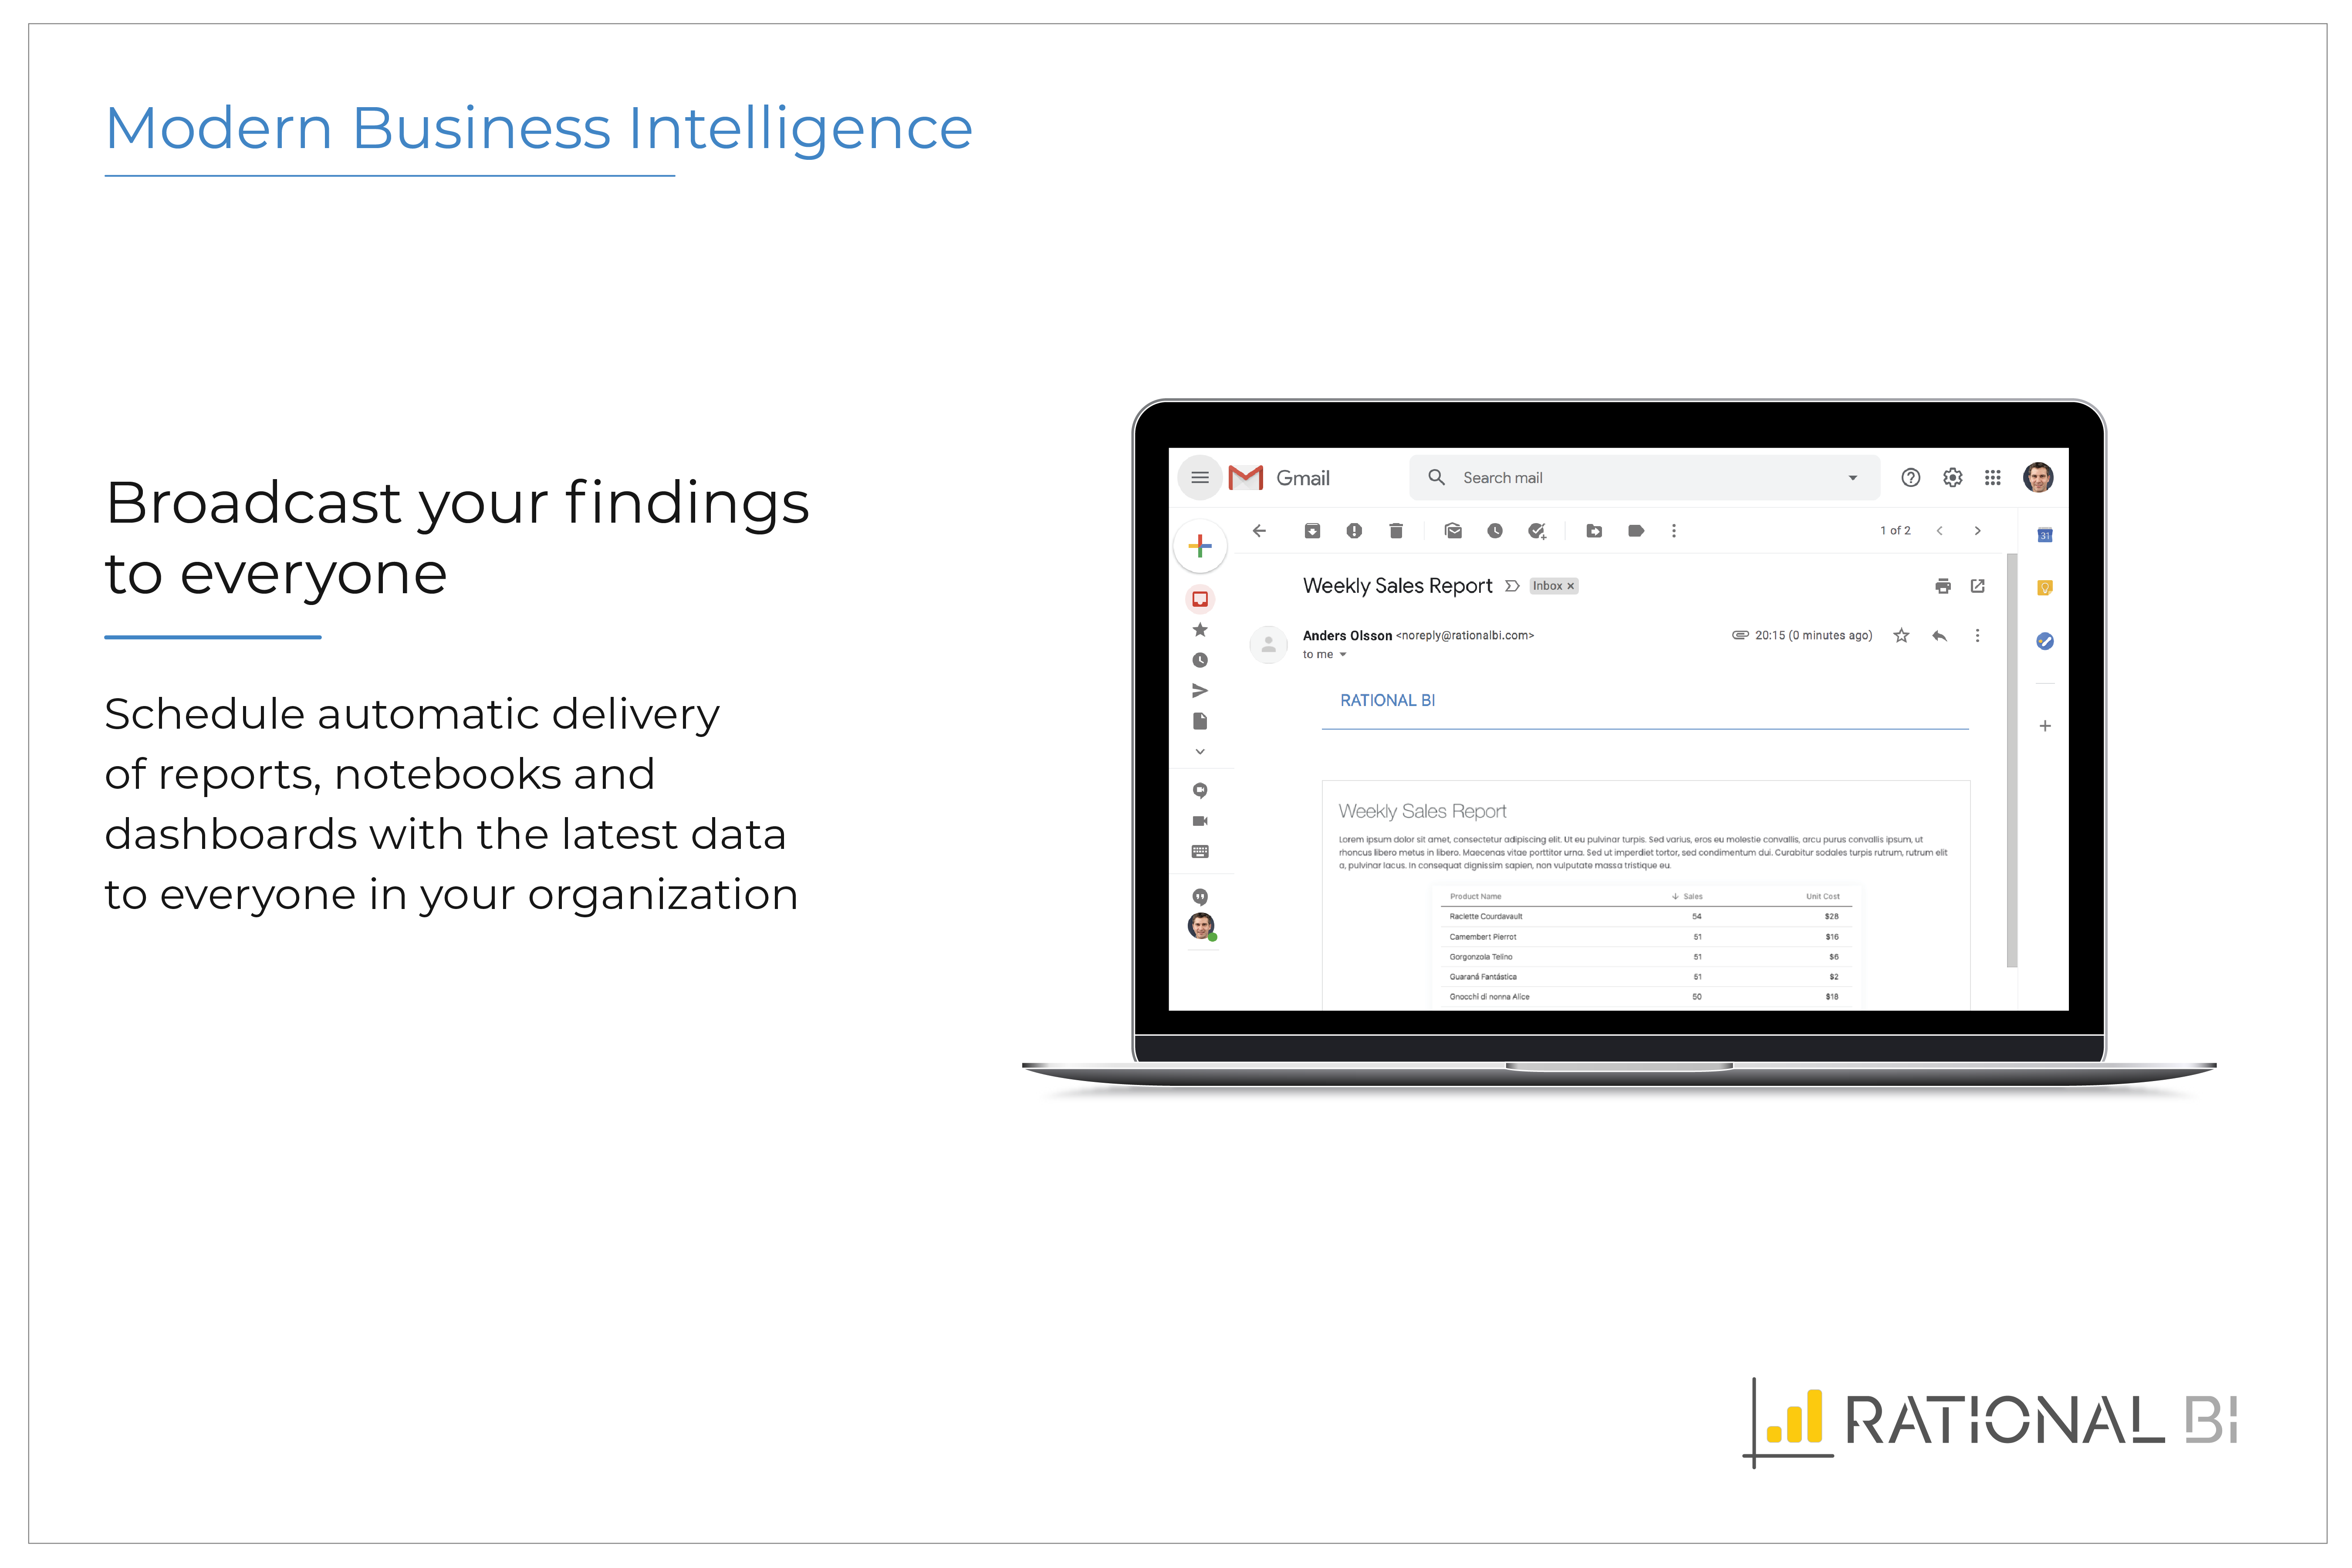
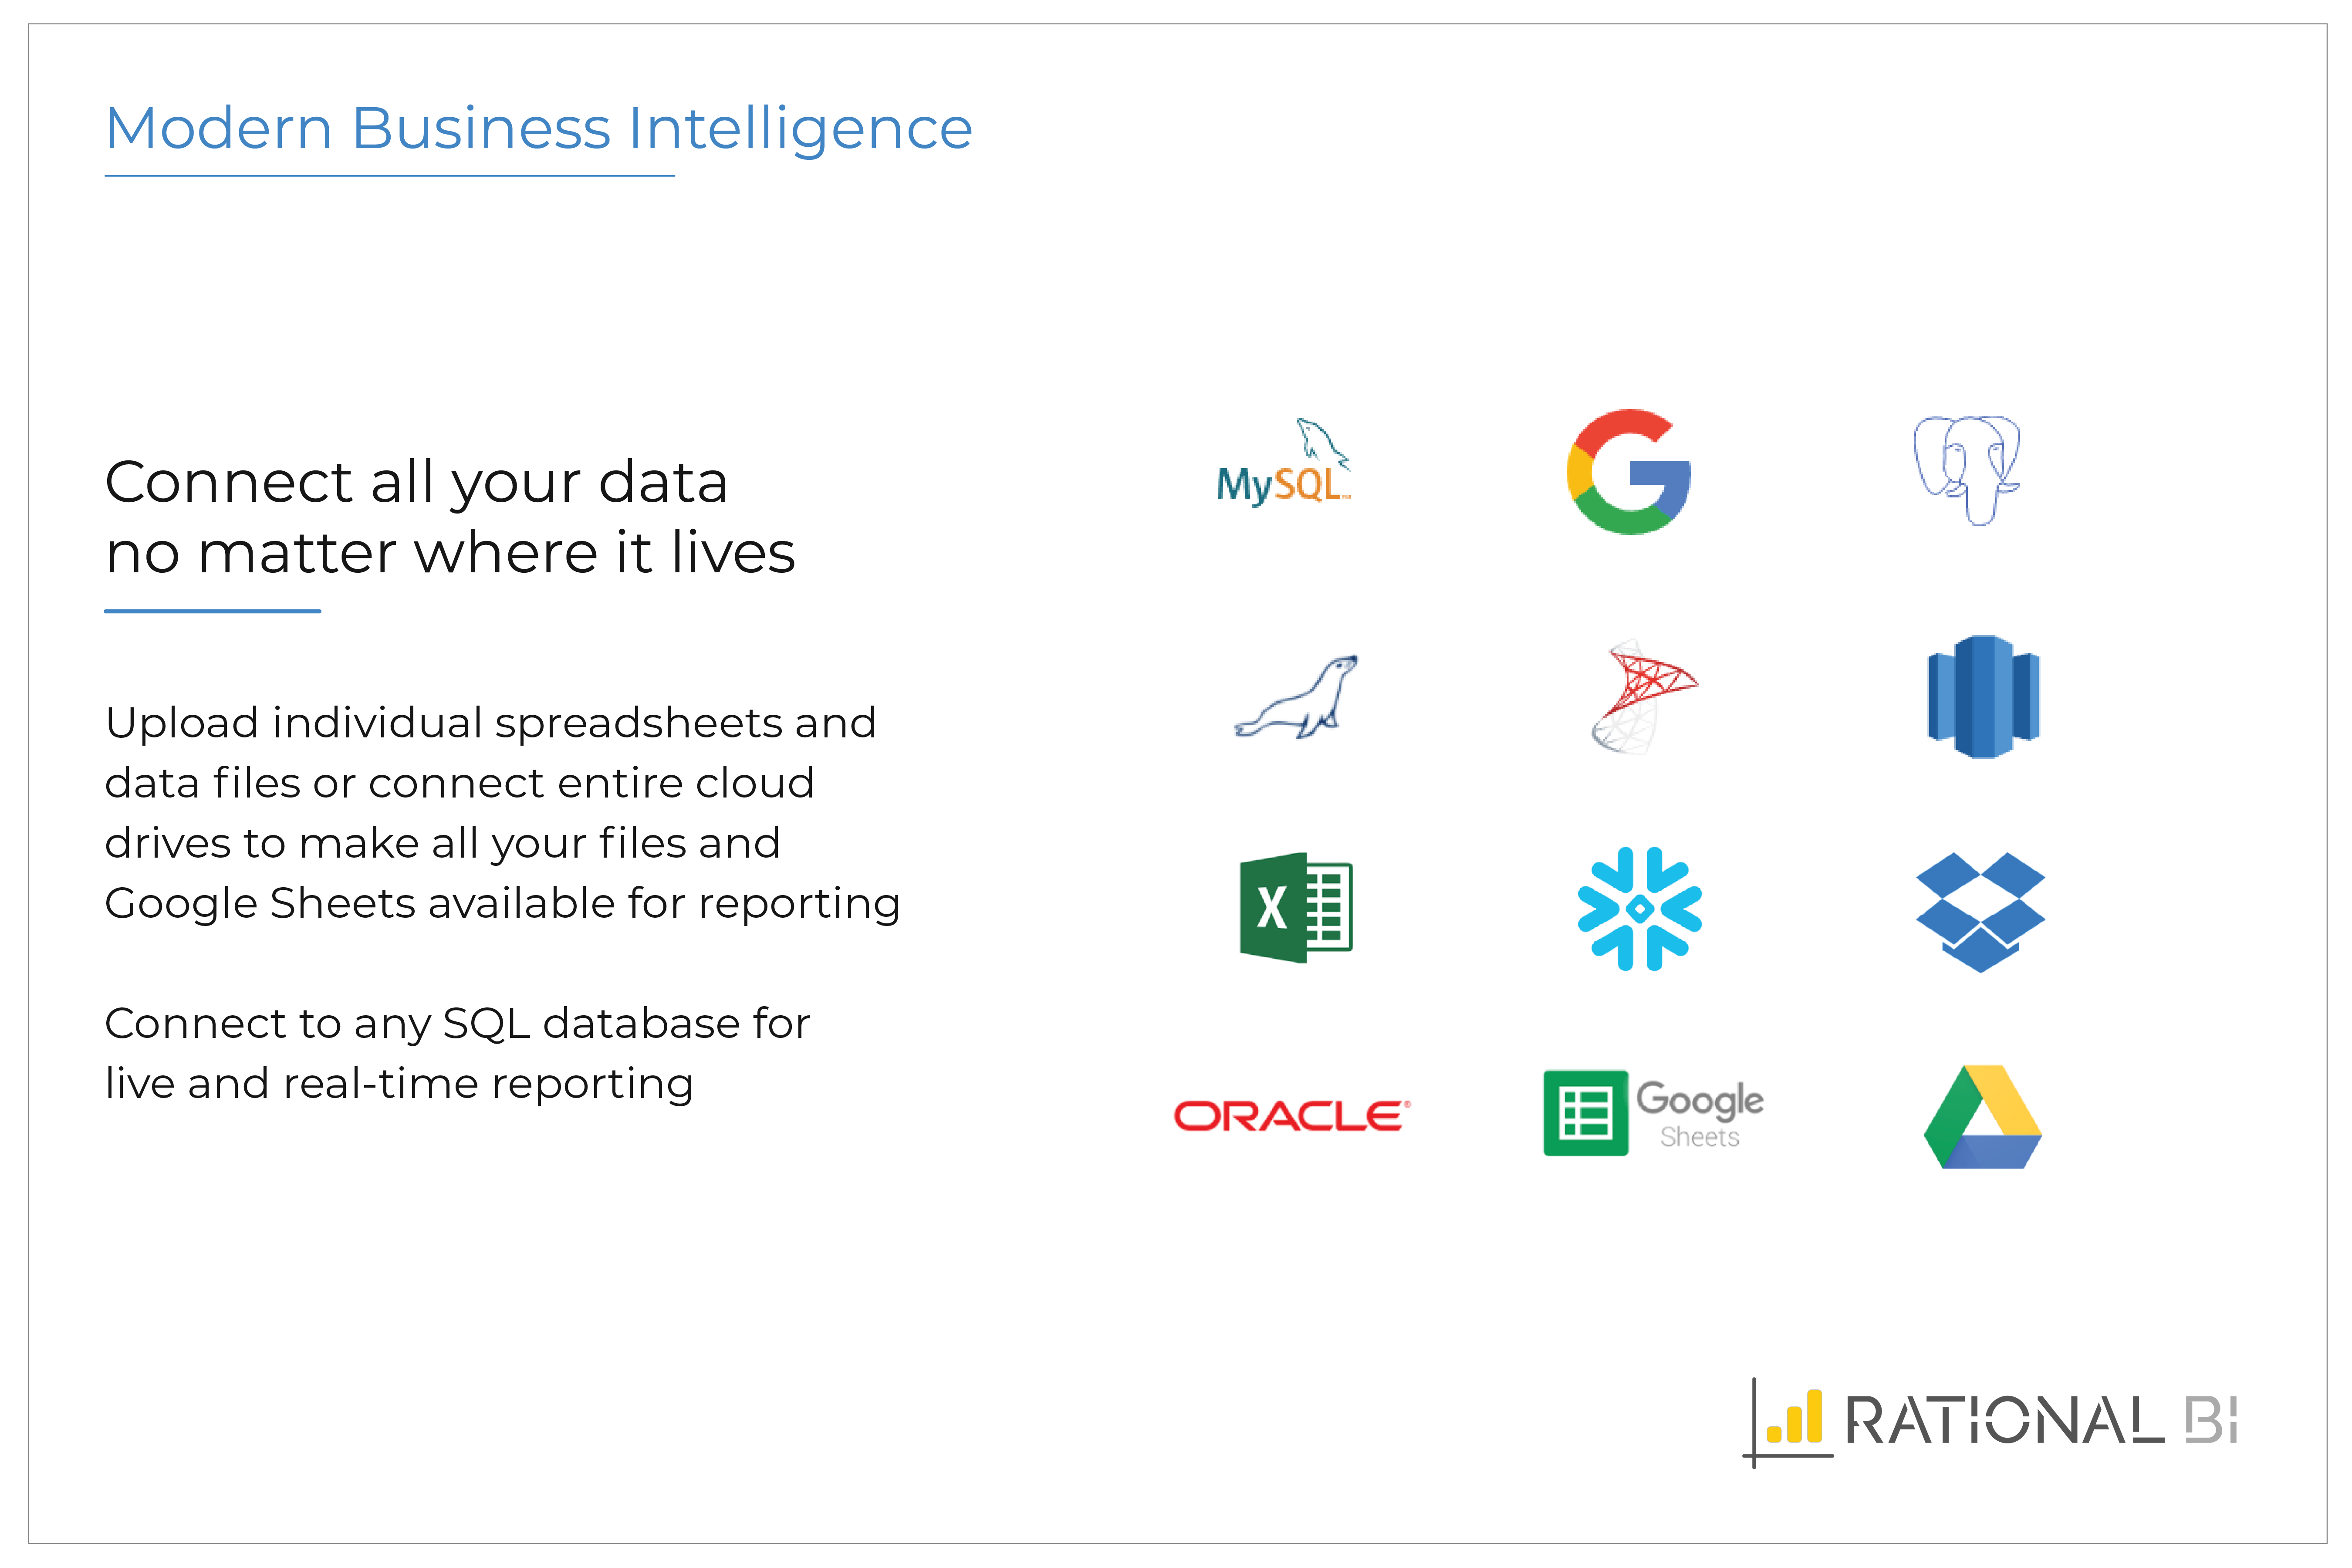
Rational BI provides analytics, data science and business intelligence in an analytical platform that connects to databases, data files and cloud drives including AWS and Azure data sources, enabling users to explore and visualize data. Users can build real-time notebook-style reports directly in a web browser with JavaScript and SQL with direct and live connections to data. Filter and query data with an SQL database embedded in the client, without network…
$0
single user
Visual KPI
Score8.2 out of 10
N/A
Visual KPI
is a business intelligence software offering from Transpara.
N/A
Pricing
Rational BI
Visual KPI
Editions & Modules
Free
$0
single user
Professional
$129
single user
Enterprise
Varies
single user
No answers on this topic
Offerings
Pricing Offerings
Rational BI
Visual KPI
Free Trial
Yes
No
Free/Freemium Version
Yes
No
Premium Consulting/Integration Services
Yes
No
Entry-level Setup Fee
Optional
No setup fee
Additional Details
Additional cost per extra user (varies by edition)
—
More Pricing Information
Features
Rational BI
Visual KPI
BI Standard Reporting
Comparison of BI Standard Reporting features of Rational BI and Visual KPI
Feature
Rational BI
8.3
4 Ratings
3% above category average
Visual KPI
8.2
2 Ratings
0% above category average
Pixel Perfect reports
7.63 Ratings
7.32 Ratings
Customizable dashboards
8.74 Ratings
9.12 Ratings
Report Formatting Templates
8.54 Ratings
8.22 Ratings
Ad-hoc Reporting
Comparison of Ad-hoc Reporting features of Rational BI and Visual KPI
Feature
Rational BI
8.3
4 Ratings
6% above category average
Visual KPI
8.4
2 Ratings
5% above category average
Drill-down analysis
7.73 Ratings
9.12 Ratings
Formatting capabilities
8.24 Ratings
9.12 Ratings
Integration with R or other statistical packages
8.03 Ratings
8.22 Ratings
Report sharing and collaboration
9.24 Ratings
7.32 Ratings
Report Output and Scheduling
Comparison of Report Output and Scheduling features of Rational BI and Visual KPI
Feature
Rational BI
9.0
4 Ratings
10% above category average
Visual KPI
8.2
2 Ratings
0% below category average
Publish to Web
9.03 Ratings
9.12 Ratings
Publish to PDF
9.04 Ratings
9.12 Ratings
Report Versioning
8.63 Ratings
8.22 Ratings
Report Delivery Scheduling
9.24 Ratings
8.22 Ratings
Delivery to Remote Servers
9.33 Ratings
6.42 Ratings
Data Discovery and Visualization
Comparison of Data Discovery and Visualization features of Rational BI and Visual KPI
Definitely well suited for small companies, but again many of their competitors are also well suited in this segment. We were in general happy with the solution provided, but I'm not blown away by their solution or support. If you want to get more data-driven visual boards with data displayed in nice graphics is in my opinion a good start, and here Rational BI delivers what it should.
A de minimis incentive was given to thank the reviewer for their time. The incentive was not used to bias or drive a particular response, nor was the incentive contingent on a positive endorsement. More Info
[Visual KPI is well suited for:] 1. Maintenance or field worker in oil & gas/chemical/ process industry mostly; machines status on the map & functionality for tracing exact location of the machines. 2. Key personnel of the site is always in move within the site/plant; useful for monitoring key performance indicators of the plant 3. KPIs to be built based on multiple data sources as well as integration with ERP tool
A de minimis incentive was given to thank the reviewer for their time. The incentive was not used to bias or drive a particular response, nor was the incentive contingent on a positive endorsement. More Info
A de minimis incentive was given to thank the reviewer for their time. The incentive was not used to bias or drive a particular response, nor was the incentive contingent on a positive endorsement. More Info
A de minimis incentive was given to thank the reviewer for their time. The incentive was not used to bias or drive a particular response, nor was the incentive contingent on a positive endorsement. More Info
A de minimis incentive was given to thank the reviewer for their time. The incentive was not used to bias or drive a particular response, nor was the incentive contingent on a positive endorsement. More Info
A de minimis incentive was given to thank the reviewer for their time. The incentive was not used to bias or drive a particular response, nor was the incentive contingent on a positive endorsement. More Info
Overall Rational BI is a valuable enterprise reporting tool for any data driven organization. It offers great depth and breadth of features for reporting and analytics that can lead to better business outcomes. Its easy to use and highly configurable to evolve to changing reporting needs of organizations of any scale.
A de minimis incentive was given to thank the reviewer for their time. The incentive was not used to bias or drive a particular response, nor was the incentive contingent on a positive endorsement. More Info
1. At large it was successful implementation. - [Users] are empowered to find out performance measures easily - issues like machine downtime, trend analysis, location specific downtime information, roll out functionalities, up time of the machines or area, alert based on run hour of the machines/ pumps, manual data entry to capture reason code for any downtime
A de minimis incentive was given to thank the reviewer for their time. The incentive was not used to bias or drive a particular response, nor was the incentive contingent on a positive endorsement. More Info
I haven't used the support myself, but my colleagues have been satisfied with the support. As I have understood from my colleagues the support is as you could expect. Still, the documentation could be better and that could avoid the need to contact their support, but overall we're still happy with the support as well.
A de minimis incentive was given to thank the reviewer for their time. The incentive was not used to bias or drive a particular response, nor was the incentive contingent on a positive endorsement. More Info
A de minimis incentive was given to thank the reviewer for their time. The incentive was not used to bias or drive a particular response, nor was the incentive contingent on a positive endorsement. More Info
Rational BI allows a deeper data analysis with respect to the other software I experimented with. The velocity to perform the analysis is similar to the other one. The predictive analysis could be very useful, but at the moment I do not use it in my activities. Dashboards are nice and easy to understand.
A de minimis incentive was given to thank the reviewer for their time. The incentive was not used to bias or drive a particular response, nor was the incentive contingent on a positive endorsement. More Info
Most of these products serve as the master source for managing data, but they all seem to have their own focus for what kind of data and metrics they monitor, visualize and analyze. I think Visual KPI holds its own against the competition because it serves so many purposes for so many departments at your organization.
A de minimis incentive was given to thank the reviewer for their time. The incentive was not used to bias or drive a particular response, nor was the incentive contingent on a positive endorsement. More Info
A de minimis incentive was given to thank the reviewer for their time. The incentive was not used to bias or drive a particular response, nor was the incentive contingent on a positive endorsement. More Info
A de minimis incentive was given to thank the reviewer for their time. The incentive was not used to bias or drive a particular response, nor was the incentive contingent on a positive endorsement. More Info