
SAS Visual Analytics vs. Viewpoint Analytics
| Product | Rating | Most Used By | Product Summary | Starting Price |
|---|---|---|---|---|
 SAS Visual Analytics | Score7.9 out of 10 | Enterprise companies (1,001+ employees) | SAS Visual Analytics provides a complete platform for analytics visualization, enabling users to identify patterns and relationships in data that weren't initially evident. Interactive, self-service BI and reporting capabilities are combined with out-of-the-box advanced analytics so everyone can discover insights from any size and type of data, including text. | N/A |
 Viewpoint Analytics | Score9 out of 10 | N/A | Viewpoint Analytics provides access to analytics that help contractors make sense of data, and helps users make the most informed decisions based on data integrated from across tech stacks to create simple, drag-and-drop reports that are easily assembled and shared. Viewpoint Analytics makes ERP data accessible across the organization, pulling construction data from Spectrum or Vista to share across with project teams and the field as well as making it accessible in an easy-to-use web interface. | N/A |
| SAS Visual Analytics | Viewpoint Analytics | |||||||||||||||
|---|---|---|---|---|---|---|---|---|---|---|---|---|---|---|---|---|
| Editions & Modules |
| No answers on this topic | ||||||||||||||
| Offerings |
| |||||||||||||||
| Entry-level Setup Fee | No setup fee | No setup fee | ||||||||||||||
| Additional Details | SAS Visual Statistics and SAS Office Analytics are also available as add-ons. | — | ||||||||||||||
| More Pricing Information | ||||||||||||||||
| SAS Visual Analytics | Viewpoint Analytics | ||||||||||||||||||||||
|---|---|---|---|---|---|---|---|---|---|---|---|---|---|---|---|---|---|---|---|---|---|---|---|
| BI Standard Reporting |
| ||||||||||||||||||||||
| Ad-hoc Reporting |
| ||||||||||||||||||||||
| Report Output and Scheduling |
| ||||||||||||||||||||||
| Data Discovery and Visualization |
| ||||||||||||||||||||||
| Access Control and Security |
| ||||||||||||||||||||||
| Mobile Capabilities |
| ||||||||||||||||||||||
| Application Program Interfaces (APIs) / Embedding |
| ||||||||||||||||||||||
| SAS Visual Analytics | Viewpoint Analytics | |
|---|---|---|
| Small Businesses |  Cyfe Score4 out of 10 | Cyfe Score4 out of 10 |
| Medium-sized Companies |  Zendesk Explore Score8.1 out of 10 | Zendesk Explore Score8.1 out of 10 |
| Enterprises |  Sisense Score6.7 out of 10 | Sisense Score6.7 out of 10 |
| All Alternatives | View all alternatives | View all alternatives |
| SAS Visual Analytics | Viewpoint Analytics | |
|---|---|---|
| Likelihood to Recommend | 9.0 | - |
| Likelihood to Renew | 9.3 | - |
| Usability | 6.0 | - |
| Support Rating | 8.0 | - |
| Data Sharing and Collaboration | 9.6 | - |
| Data Sources | 9.8 | - |
| SAS Visual Analytics | Viewpoint Analytics | |
|---|---|---|
| Likelihood to Recommend |
| No answers on this topic |
| Pros |
| No answers on this topic |
| Cons |
| No answers on this topic |
| Likelihood to Renew |
| No answers on this topic |
| Usability |
| No answers on this topic |
| Support Rating |
| No answers on this topic |
| Alternatives Considered |
| No answers on this topic |
| Return on Investment |
| No answers on this topic |
| ScreenShots | SAS Visual Analytics Screenshots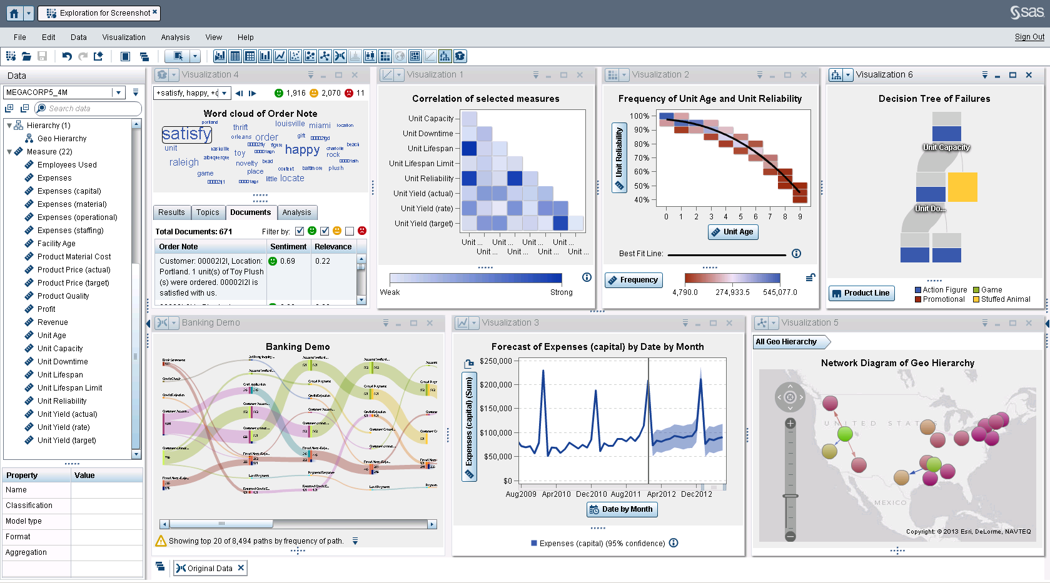 | Viewpoint Analytics Screenshots  |


