Sentry provides engineering teams with tools to detect and solve user-impacting bugs and other issues.
$26
per month
SonarQube
Score 8.0 out of 10
N/A
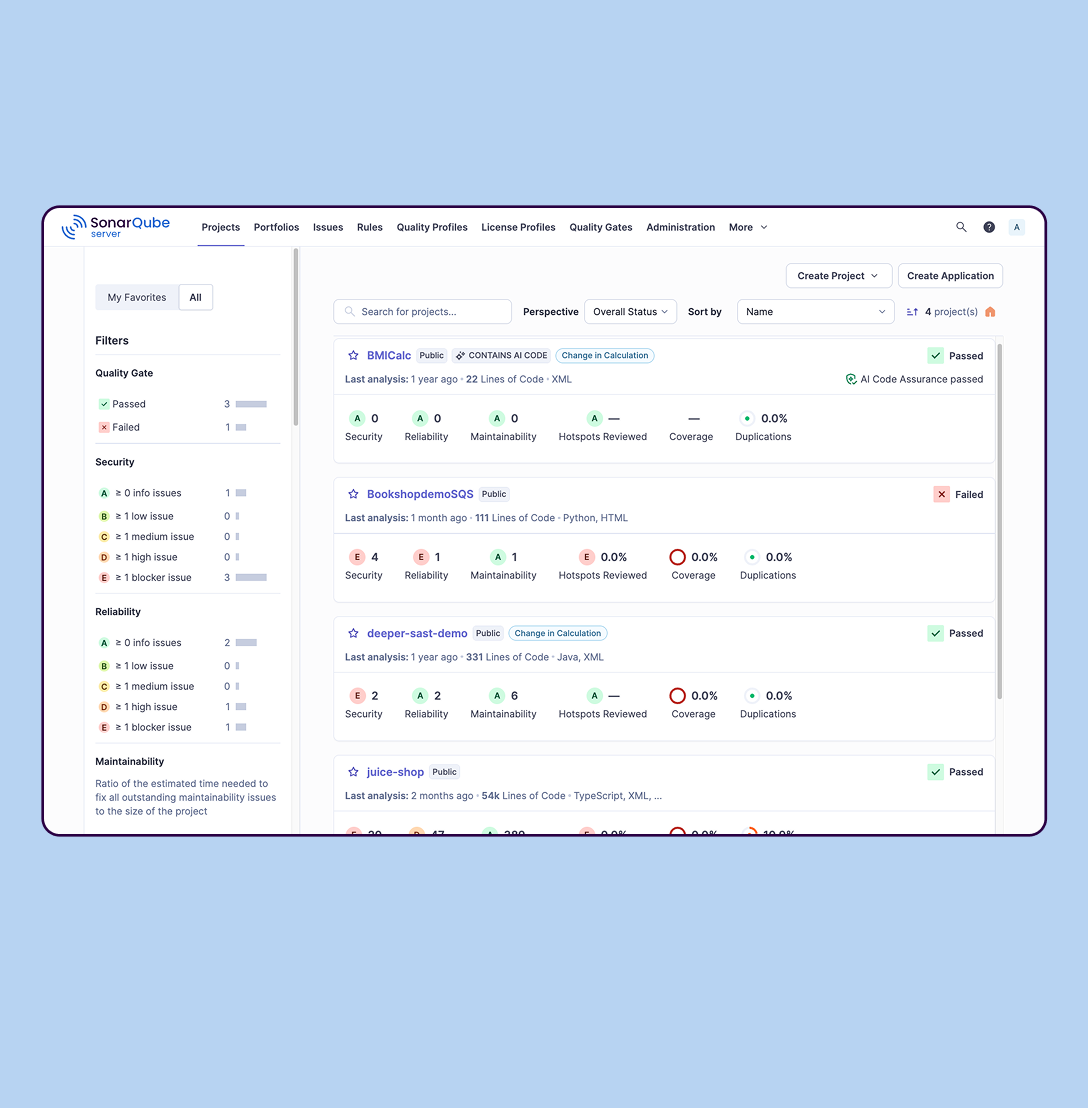
SonarQube is an automated code review solution, serving as the verification layer for code quality and SDLC security. SonarQube is used to ensure that code is secure, reliable, and maintainable. It is available through SaaS or self-managed deployment.
Great for standard web application performance monitoring, analytics and error reporting. Shows line level code errors, gives insight into performance issues (plugins, API issues, etc.). Automation and scheduled scanning in production gives client visibility into 'after deployment' value. Also lets a relatively small number of developers keep tabs on a handful of different site/applications without needing a bunch of tools. The UI is pretty complicated and can be overwhelming for new users. Documentation could be better for the learning curve,
SonarQube is excellent if you start using it at the beginning when developing a new system, in this situation you will be able to fix things before they become spread and expensive to correct. It’s a bit less suitable to use on existing code with bad design as it’s usually too expensive to fix everything and only allows you to ensure the situation doesn’t get worse.
Great web interface. Lots of data available in a really clean format, with filtering options and more.
Per-user exception tracking. User is complaining about something being broken? Look up their account ID in Sentry and you can see if they've run into any exceptions (with device information included, of course).
Source map uploading. Took a little while to figure this out but now we have our deploy script upload sourcemaps to Sentry on each deployment, meaning we get to see stack traces that aren't obfuscated!
Very generous free tier – 10,000 events per month. We're nowhere near that yet.
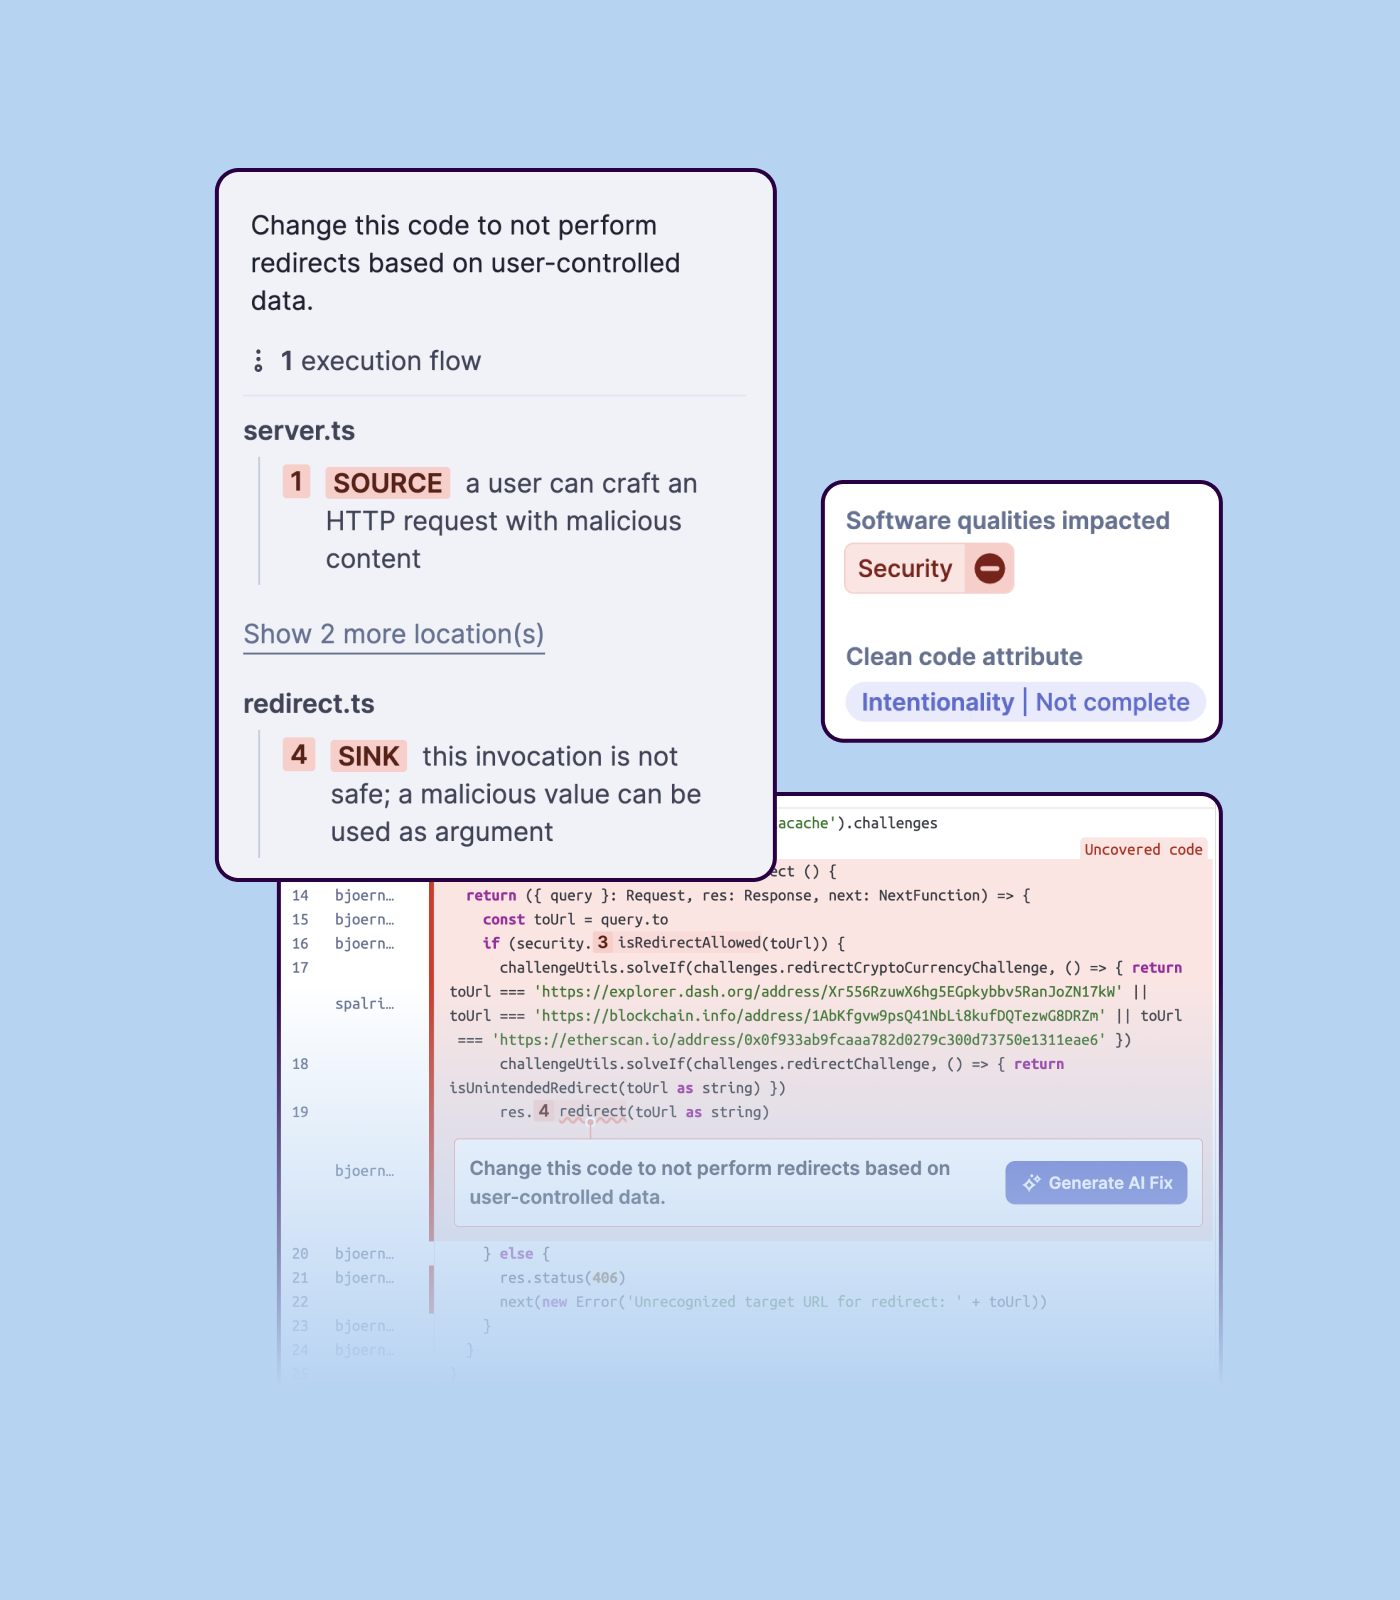
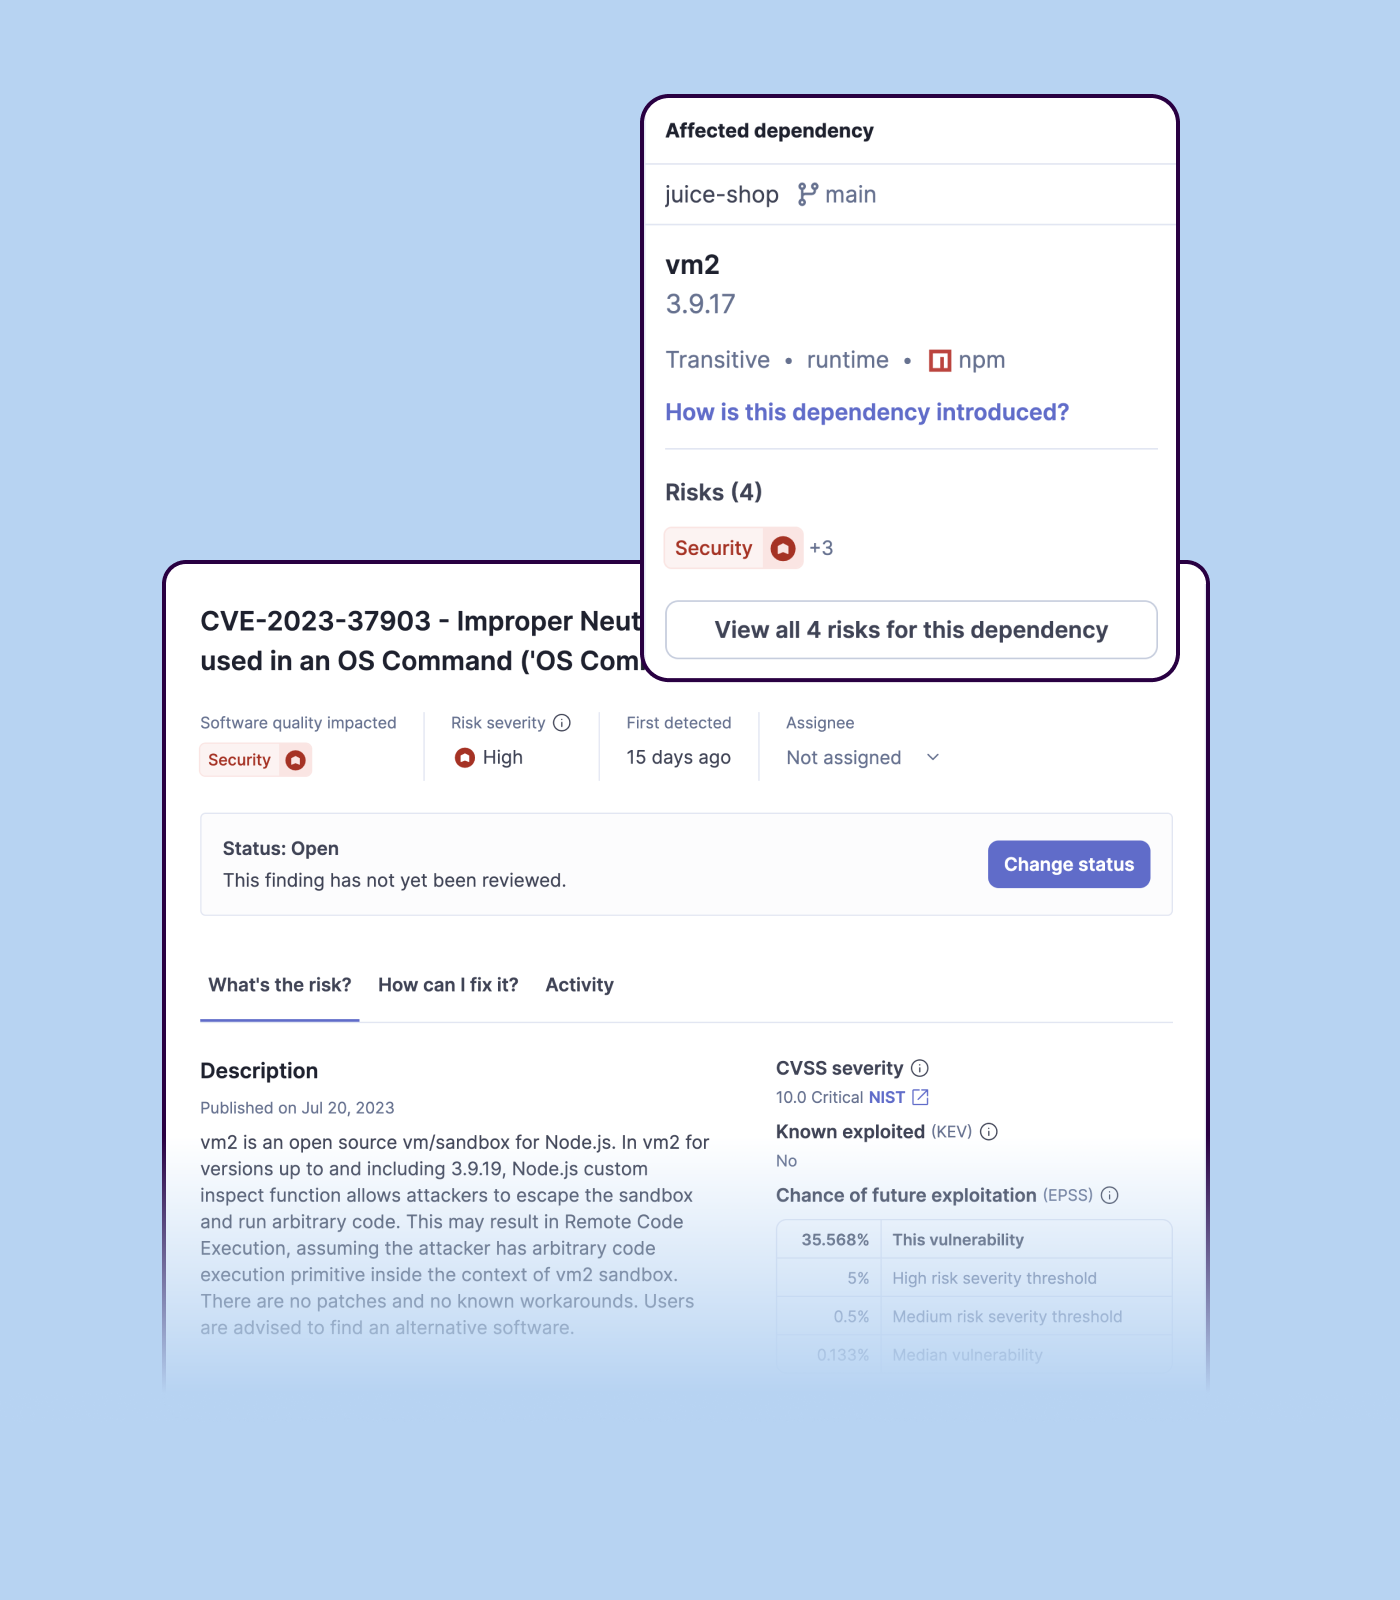
Detecting bugs and vulnerabilities: SonarQube can identify a wide range of bugs and vulnerabilities in code, such as null pointer exceptions, SQL injection, and cross-site scripting (XSS) attacks. It uses static analysis to analyze the code and identify potential issues, and it can also integrate with dynamic analysis tools to provide even more detailed analysis.
Measuring code quality: SonarQube can measure a wide range of code quality metrics, such as cyclomatic complexity, duplicated code, and code coverage. This can help teams understand the quality of their code and identify areas that need improvement.
Providing actionable insights: SonarQube provides detailed information about issues in the code, including the file and line number where the issue occurs and the severity of the issue. This makes it easy for developers to understand and address issues in the code.
Integrating with other tools: SonarQube can be integrated with a wide range of development tools and programming languages, such as Git, Maven, and Java. This allows teams to use SonarQube in their existing development workflow and take advantage of its powerful code analysis capabilities.
Managing technical debt: SonarQube provides metrics and insights on the technical debt on the codebase, enabling teams to better prioritize issues to improve the quality of the code.
Compliance with coding standards: SonarQube can check the code against industry standards like OWASP, CWE and more, making sure the code is compliant with security and coding standards.
Importing a new custom quality profile on SonarQube is a bit tricky, it can be made easier
Every second time when we want to rerun the server, we have to restart the whole system, otherwise, the server stops and closes automatically
When we generate a new report a second time and try to access the report, it shows details of the old report only and takes a lot of time to get updated with the details of the new and fresh report generated
Its incredibly versatile, but that leads to complexity for the uninitiated, which can be intimidating. Nevertheless its a well polished product, in our case leading to only using it for a focus on frontend is still more cost effective than buying a one-to-rule-them-all tool...
We we easily able to integrate the SonarQube steps into our TFS process via the Microsoft Marektplace, we didn't have the need to call SonarQube support. We've used their online documentation and community forum if we ran into any issues.
It is cheaper and offers better support for front-end applications for enterprise large environments with more then 30 scrum teams and hundreds of micro frontend applications. The configuration options, both with the agent and from the user interface, are superior to other tools, and the documentation is also very easy to use.
SonarQube is an open-source. It's a scalable product. The costs for this application, for the kind of job it does, are pretty descent. Pipeline scan is more secured in SonarQube. Its a very good tool and its support multiple languages. Its main core competency is of static code analysis and that is why SonarQube exists and it does it exceedingly well. The quality of scan on code convention, best practices, coding standards, unit test coverage etc makes them one of the best competent tool in the market
Positive ROI from the standpoint of flagging several issues that would have otherwise likely been unaddressed and caused more time to be spent closer to launch
Slightly positive ROI from time-saving perspective (it's an automated check which is nice, but depending on the issues it finds, can take developers time to investigate and resolve)