Overview
What is ScienceLogic SL1?
ScienceLogic is a system and application monitoring and performance management platform. ScienceLogic collects and aggregates data across and IT ecosystems and contextualizes it for actionable insights with the SL1 product offering.
My review after working so closely with ScienceLogic SL1 as monitoring tool.
SL1 in a Managed IT Services Environment
Monitoring Suite that lags way behind for Modern Use Cases
Apart from …
Sl1 Review
Feedback on ScienceLogic
***Wonders of SL1***
One-Stop Solution - ScienceLogic SL1
SL1 has been stronger partner to work with
ScienceLogic SL1 in my views
Insights of ScienceLogic monitoring tool
Science Logic : Journey from Better to Best
ScienceLogic SL1 Top Notch Monitoring Platform
How ScienceLogic SL1 Differs From Its Competitors
Impact on Infrastructure Visibility
Using ScienceLogic to Support New Business
ScienceLogic Integration
Impact on Infrastructure Visibility
Using ScienceLogic to Support New Business
ScienceLogic Integration
Impact on Infrastructure Visibility
Using ScienceLogic to Support New Business
ScienceLogic Integration
Impact on Infrastructure Visibility
I recommend to buy this platform. Also some development skills will need if some features are not comming in the standard product, this will also imply …
Using ScienceLogic to Support New Business
In most of the cases works quite good. Nowadays, for new …
Impact on Infrastructure Visibility
Using ScienceLogic to Support New Business
ScienceLogic Integration
Impact on Infrastructure Visibility
Using ScienceLogic to Support New Business
ScienceLogic Integration
Using ScienceLogic to Support New Business
ScienceLogic Integration
Impact on Infrastructure Visibility
Using ScienceLogic to Support New Business
ScienceLogic Integration
Impact on Infrastructure Visibility
Using ScienceLogic to Support New Business
ScienceLogic Integration
Using ScienceLogic to Support New Business
ScienceLogic Integration
Impact on Infrastructure Visibility
Using ScienceLogic to Support New Business
ScienceLogic Integration
Impact on Infrastructure Visibility
Using ScienceLogic to Support New Business
ScienceLogic Integration
Impact on Infrastructure Visibility
Using ScienceLogic to Support New Business
ScienceLogic Integration
Impact on Infrastructure Visibility
Using ScienceLogic to Support New Business
ScienceLogic Integration
Impact on Infrastructure Visibility
This has improved as SL1 offers deeper levels of monitoring and also easier management of the platform (Ease of management is important as changes are more likely to get done. If I make an improvement to a …
Using ScienceLogic to Support New Business
ScienceLogic Integration
Impact on Infrastructure Visibility
When moving to ScienceLogic we gained a deeper insight into our infrastructure, its functionality and health alongside providing us with a more in-depth dashboarding tool-set.
We are also hoping with the move to service orientated dashboarding this will provide us with better visibility of …
Using ScienceLogic to Support New Business
ScienceLogic Integration
Previously we used ScienceLogic to be a trigger point on our automated self-healing pipeline, but we have recently started testing the out of the box features within SL1 to automate system recovery.
It plugs in well/integrates well with other tooling we use which is assisting us to remove the …
Impact on Infrastructure Visibility
Using ScienceLogic to Support New Business
ScienceLogic Integration
Impact on Infrastructure Visibility
Using ScienceLogic to Support New Business
ScienceLogic Integration
Impact on Infrastructure Visibility
Using ScienceLogic to Support New Business
ScienceLogic Integration
Impact on Infrastructure Visibility
Using ScienceLogic to Support New Business
ScienceLogic Integration
Impact on Infrastructure Visibility
Using ScienceLogic to Support New Business
ScienceLogic Integration
Impact on Infrastructure Visibility
Using ScienceLogic to Support New Business
ScienceLogic Integration
These are the benefits we noticed for automating our monitoring through ScienceLogic:
- Improved security and compliance. Automatically record and audit all employee actions within a workflow, safeguard vital data, restrict access and roles of users and alert project owners when any problems arise.
- Cen…
Awards
Products that are considered exceptional by their customers based on a variety of criteria win TrustRadius awards. Learn more about the types of TrustRadius awards to make the best purchase decision. More about TrustRadius Awards
Reviewer Pros & Cons
Video Reviews
1 video
Pricing
What is ScienceLogic SL1?
ScienceLogic is a system and application monitoring and performance management platform. ScienceLogic collects and aggregates data across and IT ecosystems and contextualizes it for actionable insights with the SL1 product offering.
Entry-level set up fee?
- Setup fee required
Offerings
- Free Trial
- Free/Freemium Version
- Premium Consulting/Integration Services
Would you like us to let the vendor know that you want pricing?
3 people also want pricing
Alternatives Pricing
What is StackState?
StackState is an observability solution that helps enterprises decrease downtime and prevent outages by breaking down the silos between existing monitoring tools and tracking changes in dependencies, relationships, and configuration over time. The system relates these changes to incidents,…
What is IBM AIOps Insights?
IBM AIOps Insights is a solution for event and incident management that offers central IT operations teams a comprehensive view of their managed IT environment, providing holistic context in a single pane of glass. AIOps Insights uses intelligent automation and AI to aggregate information by…
Product Details
- About
- Integrations
- Competitors
- Tech Details
- Downloadables
- FAQs
What is ScienceLogic SL1?
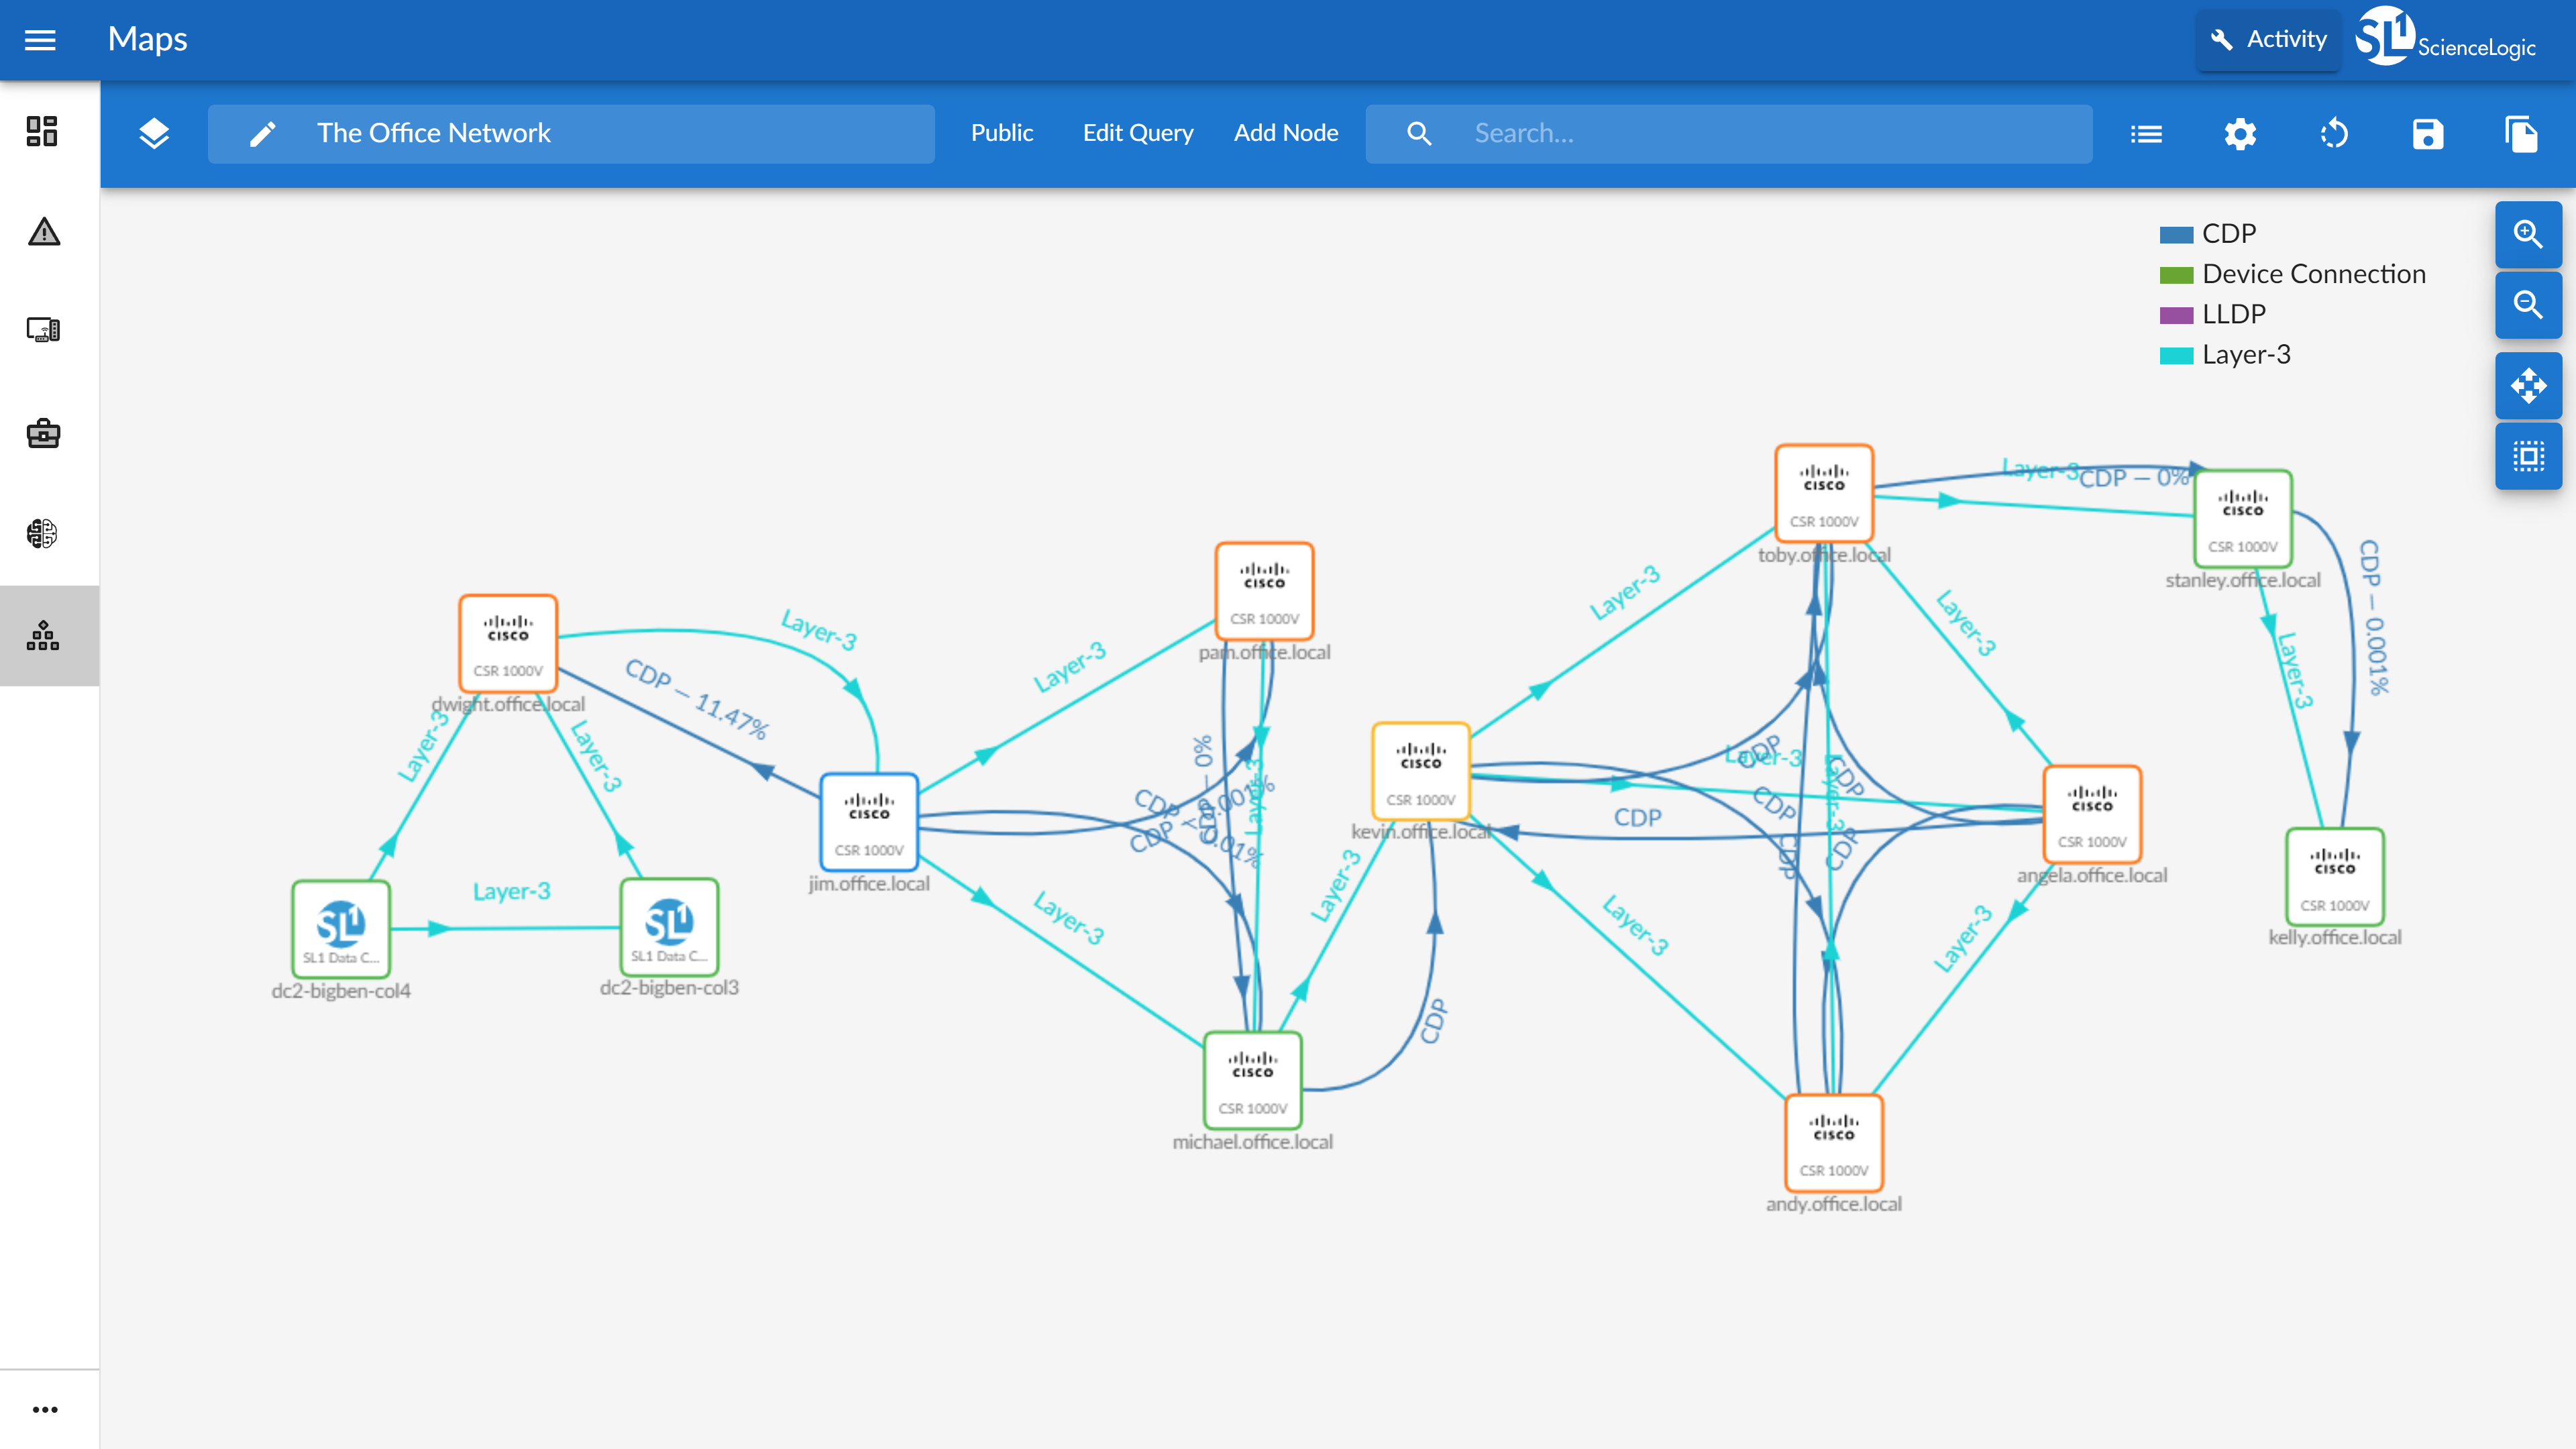
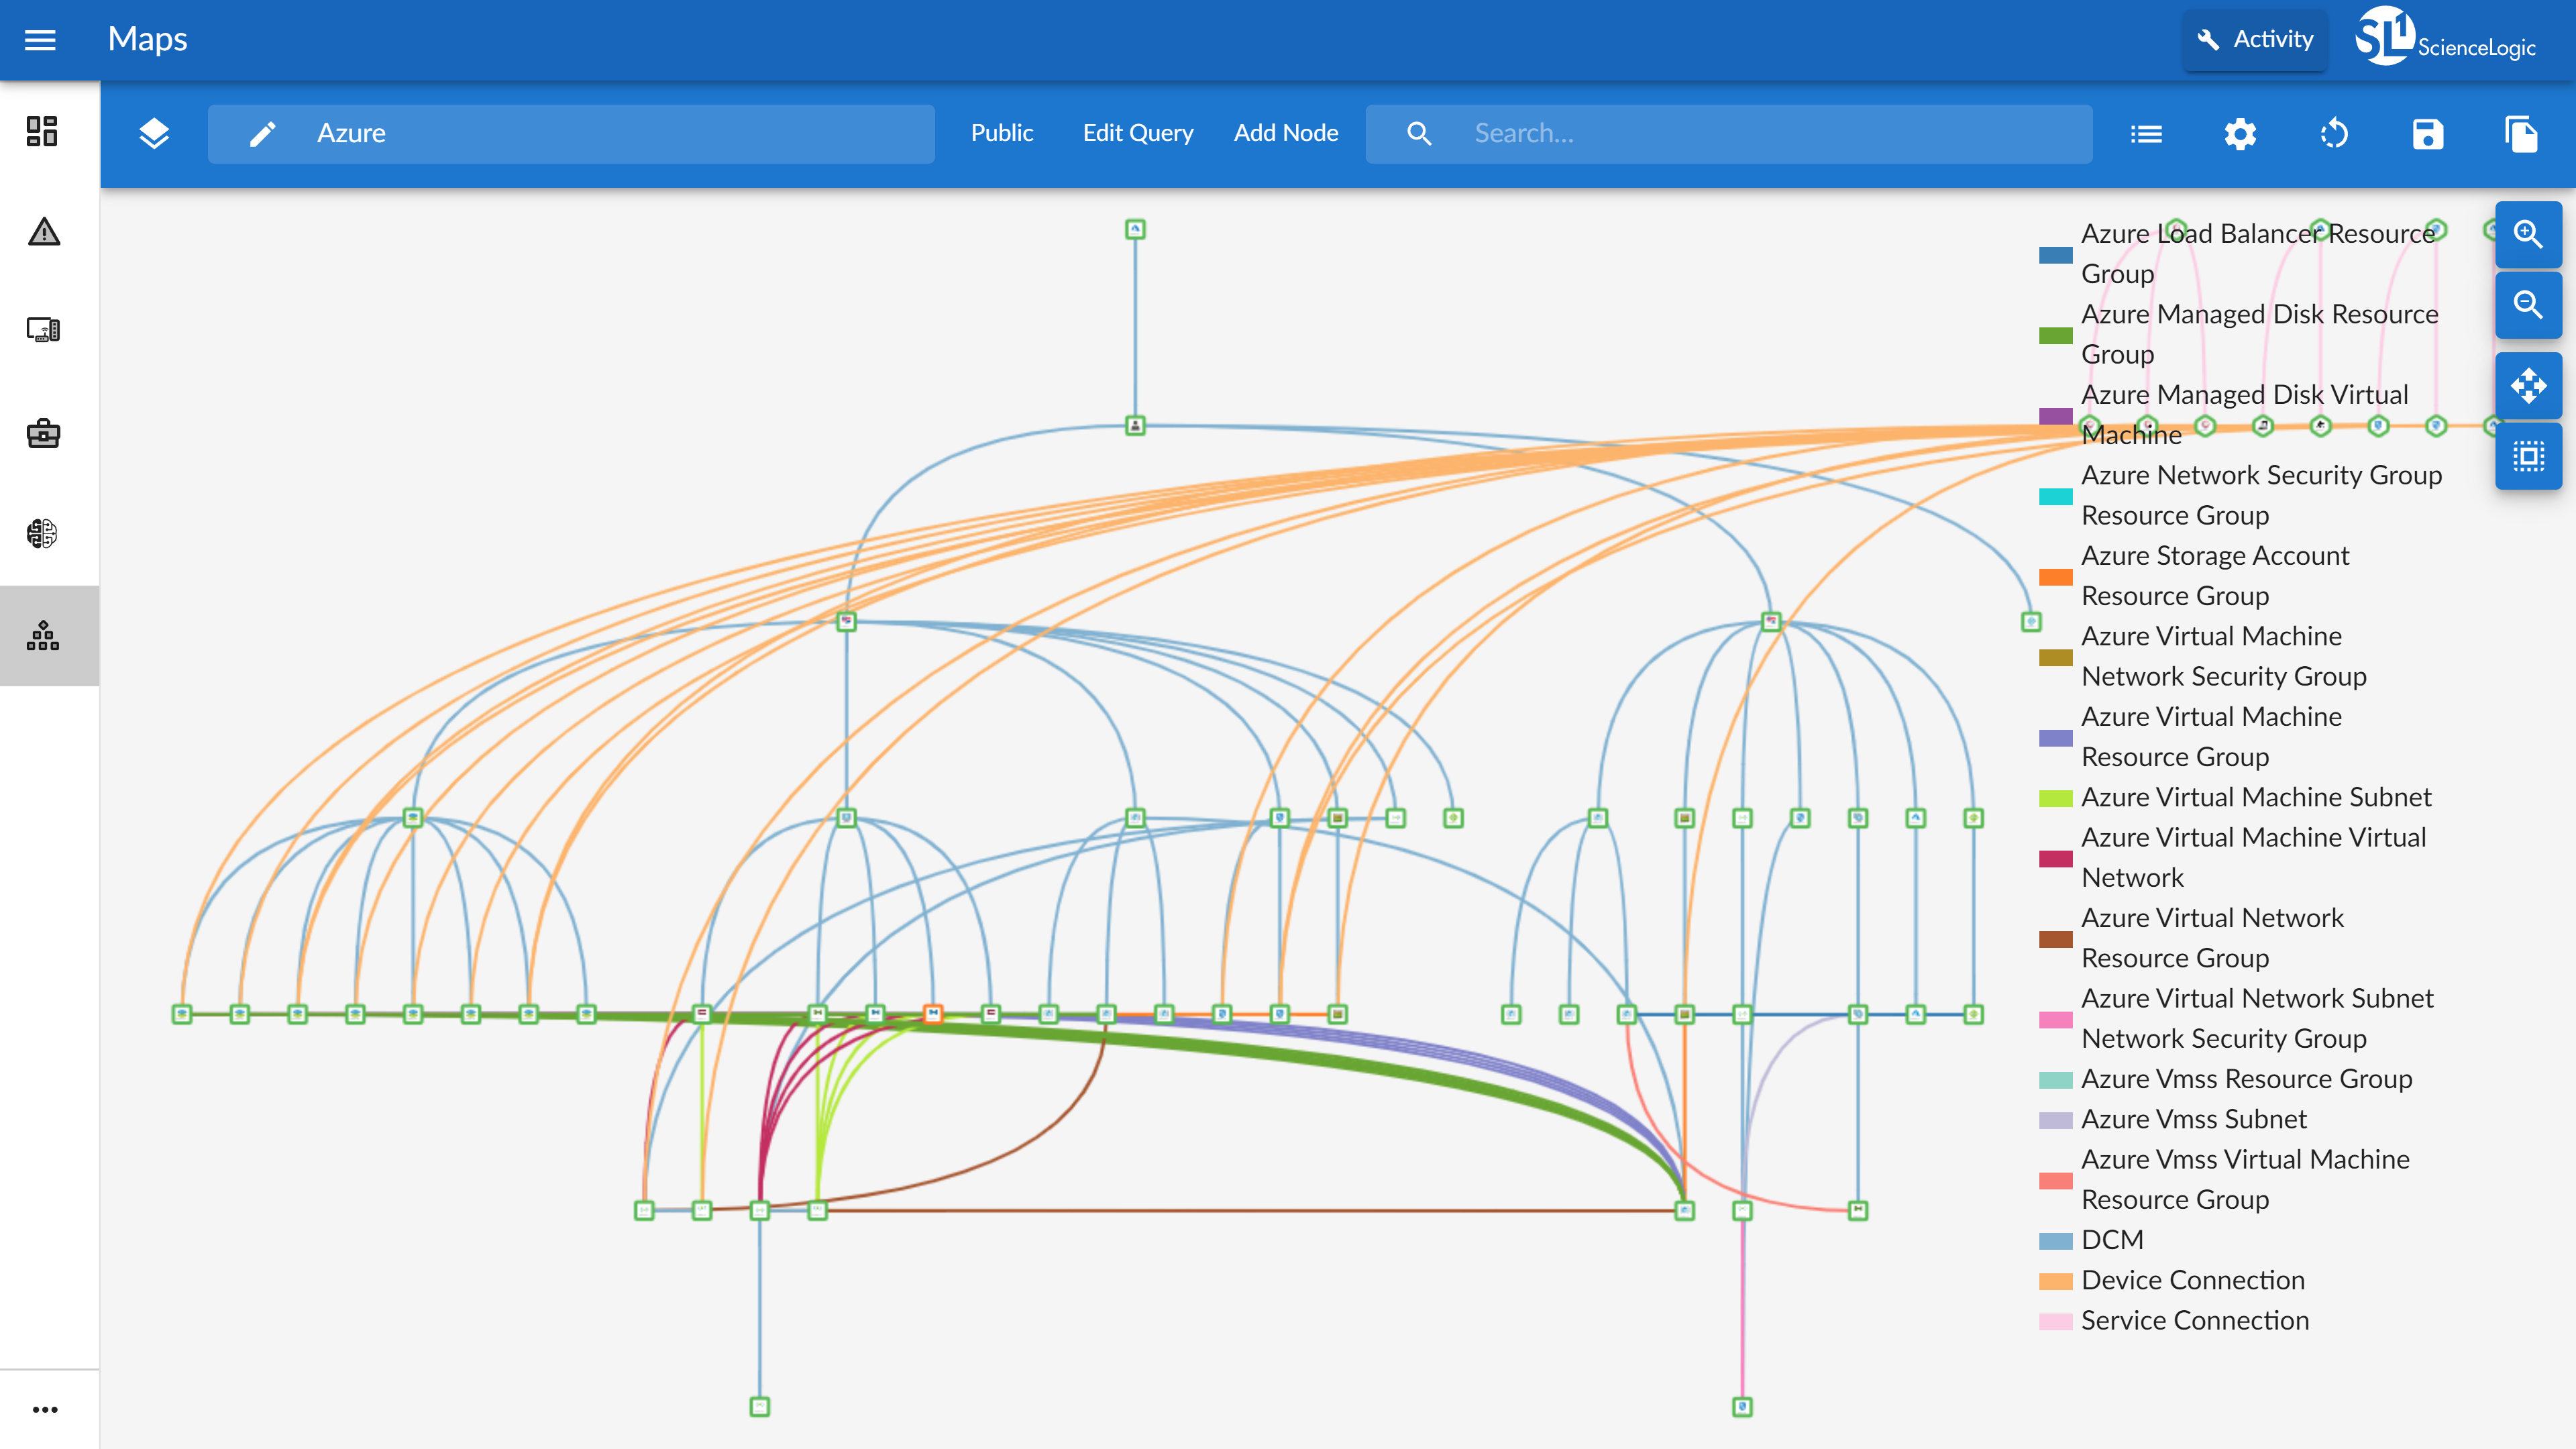
The ScienceLogic SL1 platform aims to enable companies to digitally transform themselves by removing the difficulty of managing complex, distributed IT services. SL1 uses patented discovery techniques to find everything in a network, so users get visibility across all technologies and vendors running anywhere in data centers or clouds. SL1 is that it collects and analyzes millions of data points across an IT universe (made up of infrastructure, network, applications, and business services), to help users make sense of it all, share data, and automate IT processes.
With SL1, the user can:
- See everything across cloud and distributed architectures. Discover all IT components—–across physical, virtual, and cloud. Collect, merge, and store a variety of data in a clean, normalized data lake.
- Contextualize data through relationship mapping and machine learning (ML) for actionable insights. Use this context to understand the impact of infrastructure and applications on business service health and risk, accelerate root cause analysis, and execute recommended actions.
- Act on data that is shared across technologies and IT ecosystem in real time. Apply multi-directional integrations to automate workflows at cloud scale.
ScienceLogic SL1 Features
- Supported: Infrastructure Monitoring (Cloud, Container, Server, Storage, Agent-Based, Network, Application, Database, UC/Video, Synthetic)
- Supported: Closed-Loop Automations (Digital Experience Monitoring, CMDB & Inventory, Incident & Notifications, NetFlow, Configuration and Change Management, Troubleshooting & Remediation
- Supported: Topology-Driven Event Correlation
- Supported: Full-Stack Topology Mapping
- Supported: Business Service Monitoring
- Supported: Behavioral Correlation (Events, Changes, Anomalies, Topology)
- Supported: Analytics - ML-Based Anomaly Detection
- Supported: Incident Automation - Event Forwarding & Email
- Supported: Dynamic Baselining Analytics
- Supported: Manage Workflow Health & Endpoints
- Supported: Dashboards and Reporting
- Supported: Log Collection
- Supported: 400+ Pre-Built Monitoring Integrations
ScienceLogic SL1 Screenshots
ScienceLogic SL1 Videos
Watch Eliminating Visibility Gaps While Driving Tool Consolidation
Watch Diagnosing and Resolving Service Impacting Issues with Behavioral Correlation
Watch Automating Troubleshooting for Faster Root Cause Analysis
Watch CMDB Accuracy With Real-time Synchronization of Monitored Environment
Watch Understanding Infrastructure Impact on Apps with AppDynamics
ScienceLogic SL1 Integrations
- Kubernetes
- Cisco HyperFlex (discontinued)
- Nimble
- Hyper-V
- MySQL
- Dynatrace
- New Relic
- OpenStack
- Cloud -AWS
- Azure
- Google Cloud
- IBM Cloud
- Aliyun
- CloudStack
- etc.
- Cloud Services – Amazon EKS
- ECS
- Fargate; Azure AKS; etc.
- Containers – Docker
- etc.
- Software-defined Networks/WAN – Cisco
- VMware
- etc.
- Network - Cisco
- F5
- Juniper
- Meraki
- Riverbed
- Aruba
- Avaya
- Fortinet
- HP
- etc.
- Storage - Dell EMC
- NetApp
- HPE
- Hitachi
- Nutanix
- Pure Storage
- etc.
- Hypervisors – VMware
- Xen
- KVM
- etc.
- Operating Systems - Unix
- Windows
- Linux
- Business Applications
- Databases - Microsoft
- SAP
- Office 365
- MS SQL Server
- Oracle
- IBM DB2
- etc.
- APM - AppDynamics
- etc.
- etc.
- Storage - Dell EMC
- NetApp
- Pure
- HP/Nimble
- etc.
- Cloud -AWS
- Azure
- IBM
- Aliyun
- etc.
- Applications -Microsoft
- SAP
- etc.
- Compute -VMWare
- Microsoft Hyper-V
- KVM
- Linux
- Unix
- Converged -Nutanix
- Unified Communications and video - Cisco
- Polycom
- Tandberg
ScienceLogic SL1 Competitors
ScienceLogic SL1 Technical Details
Deployment Types | On-premise, Software as a Service (SaaS), Cloud, or Web-Based |
---|---|
Operating Systems | Windows, Linux, Mac, UNIX |
Mobile Application | No |
Supported Countries | Americas, EMEA, APAC |
Supported Languages | English |
ScienceLogic SL1 Downloadables
Frequently Asked Questions
ScienceLogic SL1 Customer Size Distribution
Consumers | 0% |
---|---|
Small Businesses (1-50 employees) | 0% |
Mid-Size Companies (51-500 employees) | 0% |
Enterprises (more than 500 employees) | 100% |
Comparisons
Compare with
Reviews and Ratings
(380)Attribute Ratings
- 9.3Likelihood to Renew19 ratings
- 9.9Availability13 ratings
- 8Performance13 ratings
- 9.5Usability13 ratings
- 6.3Support Rating18 ratings
- 8.6Online Training5 ratings
- 8.3In-Person Training5 ratings
- 8.2Implementation Rating78 ratings
- 10Configurability7 ratings
- 8Product Scalability1 rating
- 7.7Ease of integration14 ratings
- 7.7Vendor pre-sale4 ratings
- 8.5Vendor post-sale5 ratings
- 8.5ScienceLogic Infrastructure Visibility Rating68 ratings
Reviews
(1-5 of 5)SL1 in a Managed IT Services Environment
- Event Monitoring
- Dashboards and creating custom Dashboards
- Device Discovery
- More freedom to create custom dashboards as on the previous versions we could do much more
- The Performance TAB windows is too small and cannot be resized or maximized when looking at reports for "Overview", "File System" and any of those items.
- There are not enough widgets to create stunning dashboard in AP2
- The reporting feauture is a very untouched area.
- Monitoring and Alerting
- 100%10.0
- Performance Analytics
- 100%10.0
- Incident Management
- 100%10.0
- Service Desk Integration
- 100%10.0
- Root Cause Analysis
- 100%10.0
- Capacity Planning Tool
- 100%10.0
- Configuration and Change Management
- 100%10.0
- Automated Remediation
- 100%10.0
- Collaboration and Communication
- 100%10.0
- Threat Intelligence
- 100%10.0
- Better visibility into different customer infrastructures if you are a Managed IT Services Provider
- Offers a "One Tool One Product Solution" to manage all of our customers infrastructures environments. Trend analyses enables us to collate event trends throughout all the customers and easily identify problems that may arise on other customers environments.
- Reporting on devices and software have become much more faster and takes the guess work out of what is in the environment
- BMC Truesight - Wee feed data into BMC TrueSight for our Capacity Management Team
- We have integrated with our customers VMware environments to all info to report on without the need of having to access the vCenter Servers.
- We have also integrated with our customers Citrix environments
- We also integrated with our customers Azure environments without any issues.
- Amazon Web Services
- Service Now
We are standardizing our systems and Service Now is one of those systems that we will be integrating. ScienceLogic has the ability to feed information into the system, that will make our life's so much easier.
- File import/export
- API (e.g. SOAP or REST)
- Implemented in-house
- Increased CPU utilization on overall VmWare infrastructure
- Interference from customer Antivirus product
- Dashboards to have an over all view of our customers infrastructure health
- Data provided by SL1 to BMC TrueSight for Capacity Management
- Event Monitoring of different customer environments
- Dashboards for specific Technologies like the Exchange team, the Wintel Team, the SQL team
- There are a lot of built in monitoring tools that we have not utilized
- We have also just touched the tip of the iceberg when it comes to building a dashboard and we will be catering to the specific needs of our teams
- Auto restart feature in Sl1 will allow us to get event when those crucial services has not started after server reboots and also minimize the P1's that we have as a result of that.
- We created a dashboard that shows the highest process untilisation to identify what was the major cause of High CPU usage in one of our customers.
- We also created custom dashboards to fullfill each individual teams need to be able to perform their daily tasks.
- Cloud Solutions
- Scalability
- Integration with Other Systems
- Ease of Use
- Online Training
- In-Person Training
- The Device Search Functionality
- The Device Investigator
- The Device Reporting function
- Trying to run a report under the report section. Most of our reports do not work and the interface is quite shocking
- Powerpacks
- Scheduling
- Monitoring
- Runbook automation
- Grainularity
- Access cli on web ui
- More clear way on creating custom dynamic applications
- Better visibility
- Metrics are available
- servicenow
- Okta
- We have no other systems we would use to integrate with SL1
- API (e.g. SOAP or REST)
- Implemented in-house
- I was not on the team when implementation was started/completed
- monitoring
- SSL cert monitoring
- reports
- BGP monitoring
- automation
The ease of use as well as the capabilities of SL1 when it comes to monitoring is mostly there. There are some features that would make supporting it easier.
- Scalability
- Integration with Other Systems
- Ease of Use
- Online Training
- In-Person Training
- No Training
- discovering devices
- removing devices
- maintenance windows
- dynamic application creation
- event creation
- granular event suppression
- Less phone home collector down issues.
- Application performance
My ScienceLogic Review
- It monitors our devices and reports on the detections we have created.
- monitors web endpoints
- can handle bespoke complex monitors
- discovery of devices automatically
- Most of the things I can think of have now been addressed in this new release.
- Documentation could be less ambiguous sometimes
- More active to detecting system alerts and having them sorted before we have need to inform them SAAS
- We have built our own Hornbill ticketing integration
- we have also integrates SL1 into firing jobs of on Rundeck
- It tells us when things have gone wrong or are going wrong which helps us to fix things quickly and inform our clients before they inform us.
- AWS Cloud Platform Linux and Windows Servers
- Azure Cloud Platform Linux and Windows Servers
- Onsite Linux and Windows Servers
- Mashery
- Hornbill
- Rundeck
- pager duty
- Kubernetes
- File import/export
- Single Signon
- API (e.g. SOAP or REST)
- Javascript widgets
- Implemented in-house
- None
- detection in our racing services, this is our largest revenue service and is global, we use science logic to ensure we have this service up 24/7 so we do not have financial penalties for going over our pre defined SLA's
- Content, this ensures that images from reporters around the work can get pictures and stories of breaking new globally, Science logic reports to us about any issues between when the reported connect up to send us there story all the way to our editing rooms.
- Stream, we use ScienceLogic to ensure that streaming sports video footage is working globally across our platforms and that our delivery websites are working and not going over capacity.
- We car looking at moving into Kubernetes and we have now started to system test this monitoring
- integrating zebrum to scan logfiles
- Integration with Other Systems
- Ease of Use
- Online Training
- In-Person Training
That said we have always found a way to get through, and the basic level of support and documentation has always been sufficient for us to work things out.
- monitoring of endpoints
- monitoring of standard metrics
- the ability to set threshold's on metrics
- importing of power packs
- Discovering new devices
- Bespoke Dynamic Apps
- Discovering AWS Could services and devices and disabling what you do not require to save licenses
- My List is small for what I find cumbersome
We have very few issues.
- Bug Fix Issues
- More functionality
- Oracle Linux 8 support
- monitors been able to use TLS 3
- AWS service detecting cache working correctly
- Kubernetes monitoring
ScienceLogic - Enterprise Considerations
- Deep monitoring across infrastructure components and with 8.12 across application layers
- Device discovery which builds infrastructure components
- ServiceNow Integration for CMDB driven device discovery as well as event-to-incident integration and automation
- Runbook Automation controlling notification as well as leading to remediation capabilities
- Event richness enabling detection of leading events which occur prior to a failure
- 12 introduces #multitenancy support which enables Enterprise with many Organizations to share (read-only) properties and performance data across Organizations without compromising credentials with inappropriate access. This is the first release of this feature and we are only now evaluating the well-communicated delivery against our requirements. This has been communicated as only being applicable via the new UI.
- Monitor thyself. We have found data gappiness issues which stem from incomprehensible / non-actionable system messages. The system is unable to communicate SIGTERM when used as a timeout (implying capacity issues) and SIGTERM when actually used as a fault (implying something non-actionable). The advisory services team is going to help, but this needs to be productized and shipped rather than be made available by customer success manager engagement. Things that SHOULD have results but do not should throw a under-collected event by the type of collection which is under reported. This should have a dynamic part of the event giving specific numbers not bland / generic statements that have to be interpreted. The platform team should immediately recognize the fault because the numbers are relevant. These events should be actionable, either referencing KB articles or some other specific remediation plan.
- Data collector load v. capacity planning in both a vertical (cpu, memory, disk) and horizontal (more collectors). The data collector specs are very stale. 4x24G is recommended for 1000 devices but customers frequently view that as individual devices, not the DCM trees found during discovery. Those tend to be my expect N (<= 1000) devices + M (which are barely understood records and which are typically treated as zero, when in fact these devices are what blow through the assumed 4x24G capacity spec). Need a horizontal-infra-scaling event as well as a vertical-capacity-limit event to be thrown when more collectors are needed.
- Actionable events. My end users barely understand the events. Referencing a KB article by URL might help users and admins in remediation. If you already understand the events they are obvious. If you don't, such as timeouts, having an article which helps people identify standard remediation steps will help close outages faster. Most events are contextual. Pointing users at that context will help.
- For us, the ROI has been positive, but the specific ROI isn't the money spent on ScienceLogic itself, it is the money invested in the skills of the engineers who now leverage the platform to maintain our high standards of availability and performance monitoring while trending over years (5-10+). Those resource costs and investments far outweigh the cost of ScienceLogic and not only retention but valuation of those skills more the covers the specific ROI on ScienceLogic itself.
- Coming from a history of two decades of homegrown build (e.g. free), the cost of ScienceLogic feels like a questionable value, but when measured across the resources educated to use the ScienceLogic platform, the ability to quickly ramp up those same resources on technologies they may have scant knowledge of and be successful is incalculable.
- This question is ambiguous. As stated, it suggests that we might have found an unexpected or innovative way which ScienceLogic (the platform) is used which surprises us. The reality is that we are driving how ScienceLogic is used and we are surprising ScienceLogic (the company) with our scale and Enterprise Use Case specifications and articulations. The remainder of the questions will answer from a company perspective, not a product perspective.
- #multitenancy - Enterprise Use Case wants to share many data elements in a read-only way to the IT world. As originally deployed, 8.3 > 8.11 suffers from Managed Service Provider Use Case where Organizations are expected to be 100% independent from each other with no read rights and no world implications. 8.12 delivers our first glimpse of how we will allow a more seamless Enterprise Use Case experience by allowing configuration of a WORLD rights permission that grants read (but not write; as is the case in 8.9 and prior) permissions to device configuration and performance data.
- We have 467 Organizations with some 2200 users. Many in multiple organizations.
- IT Services have been how we folded our host clusters onto Science Logic stacks. We've been involved in early discussions about Device Services and Business Services and as those become tangible in the platform we will provide our feedback based on issues we find due to our scale.
- Given 467 Organizations and some 2200 Users, we found that pre-generating Critical Ping Failure and Availability runbook automations and actions and external contacts so that all of our teams had a starting point in the platform was a surprise to use as a mechanism whereby we provide base training to our end-users in the RBA space. Our statement is these are yours. Play with them. Learn from them. Delete them if you need clean copies and we will regenerate those for you.
- Our use of ServiceNow as our upstream CMDB with monitoring configuration paint being applied downstream has been a great boon to us. This allows our operations teams to force a repaint to clean up problem configurations without concern to multi-master issues. We consistently find that SyncServer and Integration Server use cases are inverted for us in that ScienceLogic pushes to ServiceNow and a hand-wave on whether or not ServiceNow does its own discovery (thereby creating a multi-master problem).
- Implemented in-house
- Undersizing the central database file system. 1.2TB was consumed surprisingly quickly. Default data retentions surprised us significantly and we had to scramble to ratchet down the data retentions until we could rebuild to 4TB internationally and 26TB (domestically). The engineering recommendations was 3-5TB "for someone our size". We no longer believe them at our scale and we feel much more comfortable with 10TB+ than we do with 4TB. (We're not concerned with one of our 4TB stacks, but we're keeping the data retention limited on our other 4TB stack because it is heavily used; a surprise based on our user consumption patterns.)
- Disparity between the way we used to count and the way that ScienceLogic counts. They are not the same. You won't know until you start discovering devices how off your estimates are because the DCM trees balloon quickly and surprisingly.
- This has implications on data collector sizing. Are you using large vCenters? Large routers? Large storage arrays?
- Your resiliency strategy should inform how you should view your RAID configurations. We started at RAID-6 and rebuilt to RAID-10, then dropped to RAID-0 because we use a DR configuration. The starting point of RAID-6 was found to not be healthy for a heavy-write MySQL database. A RAID-10 did moderately well. The RAID-0 (with a DR config) actually performs very nicely, with all that this configuration means.
Our global / internal monitoring foot print is 8 production stacks in dual data centers with 50% collection capacity allocated to each data center with minimal numbers of collection groups.
General Collection is our default collection group.
Special Collection is for monitoring our ASA and other hardware that cannot be polled by a large number of IP addresses, so this collection group is usually 2 collectors).
Because most of our stacks are in different physical data centers, we cannot use the provided HA solution. We have to use the DR solution (DRBD + CNAMEs).
We routinely test power in our data centers (yearly).
Because we have to use DR, we have a hand-touch to flip nodes and change the DNS CNAME half of the times when there is an outage (by design). When the outage is planned, we do this ahead of the outage so that we don't care that the Secondary has dropped away from the Primary.
Hopefully, we'll be able to find a way to meet our constraints and improve our resiliency and reduce our hand-touch in future releases. For now, this works for us and our complexity. (I hear that the HA option is sweet. I just can't consume that.)
ScienceLogic SL1 at 8.12 provides a wealth of monitoring data. This comes at a cost as you scale up.
Can you consume the wealth of monitoring data?
Can you consume the wealth of warnings and errors that being to get generated as you scale up?
There are challenges, most of which are due to our deployment design choices and scale.
We are working with ScienceLogic to introduce Priority as a first-class data element. We've added this as a Custom Attribute for all of our CIs. We use this to distinguish between the failure of a development host vs the failure of our production website.
The score represents the known opportunity for improvement that we see on our joint roadmaps.
We have many routers at work.
Almost all of them have 10K interfaces on each one.
Creating dashboards which present many different views of many different, large routers can create undue database load. (We're actively discouraging their use as a long-running process because each dashboard widget gets its own database connection, not a shared database connection.) We will kill all long running queries in the database if they run longer than 30 minutes.
The database schema design makes interesting trade-off decisions (optimizing for ease of write at the expense of complex / cross-device reads).
The new GraphQL schema model looks promising, but we're still waiting for that to begin to appear in the SL1 core functionality.
Given enough hardware and budget, you can go a long ways before you start pushing the boundaries of the platform architecture.
Being conservative in what you monitor for the vast majority of your CIs allows you to retain compute capacity for dashboards, runbook engines and the like.
Having large routers or vCenters will require an upscaling of your data collector sizings just to complete the Device Component Map data collection.
We introduced Custom Device Attributes to contain the standardized meta data from our ServiceNow CMDB. We have 22 attributes in play, which includes CI priority, ServiceNow SYS_ID (we have a few distinct types, so multiple attributes) and last sync-type (very crucial to know that the monitoring configuration data is current with our CMDB data).
Being disciplined about what elements of configuration we encourage our end-users to consume is a key to managing the complex offering from ScienceLogic.
- Have your CMDB be upstream from your monitoring system(s). Allows you the benefit of repainting the configuration when you feel it is bad, including deletion and recreation (at the cost of lost of historical data, which you should be pulling out and centralizing somewhere else if you're on multiple stacks).
- Use CI Priority to allow you to distinguish between Critical (Severity) events and know which one to focus on first.
- For on-premise deployments, deploy half of your capacity to two(2) regionally close data centers, if you have them. Plan to be the last-to-fail and the first-to-recover.
- Use ActiveDirectory groups to authorize access. Use your access control systems to populate those AD groups.
- Limit the amount of distinct rights (Access Hooks) which you deploy. (We use 3; Operators (default rights); Leads (slighly elevated from Operators); and Admins.)
- If you have multiple teams with differing responsibilities, pregenerate their default runbook automations and runbook actions so that they can just "turn their stuff on" (because it already exists).
- Look at Business Services, IT Services and Device Services as you model your "behind-the-load-balancer" cluster availability monitoring and capacity. Make this as simple as possible for your end-users to consume from their CMDB definitions. Do the math for your customers in the IT Service configuration.
- In the old UI, we have added Custom Navigation to allow users to get from a Device > Registry > (wrench) page to the following page types:
- IT Services when the current CI is a member of an IT Service.
- The "default" Run Test (it varies by device class for us) but the canonical button allows our users to ignore those differences and have a single place in the UI to go trigger that monitor.
- Links to our independent test transaction verification UI (is ScienceLogic broken? Or is your CI really down?)
- We have not yet seen the new UI, so we don't know how these limited navigational aids will be rendered there.
- Several of our larger teams have created dashboards to help them understand their fleets.
We have done extensive off-box integrations and audits and range the following gamut:
- User account injection and Secondary Organization Alignment based on external access group definitions.
- SyncServer Discovery Session Template generation based on end-user Device Template existence.
- CMDB to SL1 custom monitoring configuration (we lifted and shifted our entire application monitoring semantic from our legacy, homegrown system onto SL1 in about a quarter).
- Custom code deployment on our Central Databases / Data Collectors / Messaging Servers via our own RPMs and yum repos.
- Ansible playbooks to handle all configuration of each server type; includes command-line access and named account creation / removal as people enter / leave the platform team.
- ServiceNow Change Management injection (not all Changes are facilitated by SyncServer).
- Replacement of SyncServer functionality due to our scale (includes physical device Change Requests which hit 2000 CI limits in the CR and then broke).
Much of our outside-in integrations and coding has been to support our multiple stacks (consistency enforcement).
Once you've developed the skillset needed to support doing integrations (or in the simple case, dashboarding), you'll feel more comfortable doing these types of things.
Our #1 requirement is being able to rebuild any machine in as little time as possible, that means that all of our central database configurations (under the hood and inside the UI) needed configuration scripts which could be run against a newly built machine.
These scripts allowed us to leverage them in Vagrants, which we use heavily to plan out our upgrade process before we touch any non-production environment where end-users might be testing. We upgrade the majority of our non-production environments before attempting a production environment.
Using Ansible and yum / RPMs has been a boon to our ability to satisfy "last-down / first-up" when the world is burning.
Avoid making hand-tweaks at all costs. Make it a script that makes it repeatable if you have to rebuild a server.
- Infrastructure Monitoring (20% of our user base is in this category)
- Application Monitoring via synthetic test transaction (80% of our user base is in this category)
- Ability to feed all priority (P1 and P2) events through an Elasticsearch engine and render only P1 / P2 events (outages) on a single pane of glass given that we have 8 independent stacks due to our scale.
- Minimal disruption to the vast majority of our users as we effect a sea-change in our monitoring capability (dump our old, homegrown system) and replace it with 8 independent ScienceLogic stacks around the world.
- Educate our users to accept event-to-incident for non-priority (P3-P6) use cases
- Drive AIOps and data lake construction so that we can be agnostic of the 8 independent stacks and treat the data as wholistic and global rather than regional and constrained.
- Ensure that ScienceLogic product capabilities fit more and more Enterprise Use Cases over time. Use our relationship as a large Enterprise deployment to educate ScienceLogic on the Enterprise Use Case and the challenges that come from a large deployment so that the product improves overtime.
- Maximize the viability of our on staff engineering resources to support / grow the capability consumption for internal IT clients in spaces that we currently can't get to in a timely manner, such as multi-cloud monitoring configurations.
- Product Features
- Product Usability
Our key requirement was not whether ScienceLogic could meet all of our custom demands (we understood that moving from custom-fit to commodity-fit was going to be painful), but rather could ScienceLogic give us the ability to meet all of the new monitoring capabilities our internal customers were demanding as we re-oriented towards Cloud offerings and still maintain at least some level of translation from our existing expectation set without too much drop in functionality.
Our requirements will be:
[1] Do we have the talent in team to overcome any produce deficiencies?
[2] Which product offering provides the least amount of product deficiencies (from our expectation-set) which we then have to back-fill?
[3] Which product offering provides the most leverage to perform said back-fill?
- In-person training
- Self-taught
- Once configured, the runbook automations can be magical. Doing the configurations requires technical skills. The platform deployment team pre-populates the obvious runbook automations and actions and all configurations so that most of our users don't have to touch them. They just have to enable them. The Cisco IT team pre-filtered event types down from nearly 5000 to just about 25 interesting event types.
- Once designed, the authentication model works moderately well. We have operators, leads and (platform admins). The configuration design was interesting because our first swing was to grant rights to each Organization. We found that a two dimensional rights / orgs matrix made this simpler. We almost have two rights, but the leads have a very few extra rights which the operators don't have.
- We take ServiceNow data for clusters and paint IT Service configuration onto each of our stacks so that our end-users don't have to deal with the configuration of an IT Service. (Doing that integration took a little time.) We are looking for ways for ScienceLogic to consume our implementation semantics so that the behaviors make it into the product, presumably via Integration Server.
- Our deployment goes to great lengths to allow the vast majority of our users to ignore most of the legacy user interface by focusing on a few local / cultural works to trigger behaviors which those users need to execute (RunTest, AppMon Bypass). The 8.12 Unified UI solves these issues. We are currently evaluating when we can move our end-users to that Unified UI later this summer.
- Designing whether ScienceLogic should participate with ServiceNow in a multi-master scenario or if ScienceLogic should be the single-master or if ServiceNow should be the single-master requires assistance. Cisco IT prefers ServiceNow as our single-master allowing us the flexibility of repainting a configuration downstream if things go sideways. This is an Enterprise Use Case concern.
- We generate Availability and Critical Ping runbook automations for each of our end-user teams (by Organization). The design and implementation work was left as an exercise to Cisco IT. We will be looking for ways to encourage ScienceLogic to make this Enterprise Use Case concern simpler for future Enterprise adoptions. Our implementation was complicated by our desire to NOT use ServiceNow group data. We expect this to be migrated to the new Integration Server as we continue to morph this integration over time.
- Multiple stacks (an Enterprise Use Case concern) is a challenge for configuration, especially if you design for rebuild repeatability. We've lost disks on our secondaries on one stack and have been forced to rebuild because we failed to estimate our disk capacity correctly. We originally estimated 1.2TB, but due to our scale, we rebuilt (several times) against 4TB internationally and 26TB domestically using RAID-0 with a dual-data center DR configuration. We found that RAID-6 cost us database speed on UCS 220C bare metals. We found that RAID-10 was better, but that RAID-0 was the fastest. We accept the DR fail-over model as our resiliency strategy rather than a full backup (since we're downstream from the CMDB and almost everything is disposable and repaintable from the single-master). We didn't find out these problems until after we had started deploying to the production environment which meant full rebuilds on each of our 8 stacks. The reconfiguration after each rebuild was made simple only because we reverse-engineered the authentication configuration and all other central database configurations and pushed those into our Ansible playbooks.
- ServiceNow (CI sync, Change Management, Application Monitoring Configuration, Host Clusters)
- Cisco IT's Epage service and organization membership (breadth)
- Cisco IT's Access Request Tool (ART) for access rights.
Epage - We have long done our own paging service. Recipients have long been put into groups which are responsible for CIs. During our initial stand up, we took those groups and instantiated them as on-stack Organizations with members from the same source. (This is a very different view of who has access from the normal ScienceLogic / ServiceNow Company focus, but it fits our culture which continues to prefer our custom-fit solution.)
ART - Our ART integration grants users rights (basic rights, slightly elevated rights or platform admins). The Epage Organizations define what CIs can be seen. (A continuing pain-point in the platform, but we are working with ScienceLogic to introduce a solution that fits our needs and is part of the core platform in coming releases.)
- Cisco ACI
ScienceLogic helps us get there faster than we could get there on our own.
Their work on the Cisco ACI PowerPack in our scaled environment helps us support the IT Networking team deploy and monitor (without crushing) our ACI fabrics.
- File import/export
- API (e.g. SOAP or REST)
- ETL tools
Some of our teams have done early work (organization-specific) wherein events are translated into our teams application.
Our long term plans include using ServiceNow / CMDB role-data for notification purposes via our teams application. For example, notifying IT Service Owners that they have an active P1 / P2 event on something within their service. Same thing for Support Managers and Responsible Managers at the Business Application level. Once we understand how those notifications work out, we will target Service Executives at our Architecture Service Grouping level above our IT Service level.
As part of that notification design, we intend to start the clock on the first failure and then close the clock on the last recovery so that teams have accurate outage numbers in each of those spaces. Obviously these details will be added to the active Major Incident associated with the events.
We use the REST API heavily.
We are starting to gear up to use the GQL API and expect that to be a heavy integration.
We cheat and go directly to the central database and lean on that interface far more than we should.
We are working with ScienceLogic to start looking at the Developer persona and start aiming docs, powerpacks, education and support at that persona.
We are very encouraged by the coming SSH / REST powerpacks as we expect those to significantly lower development cost and speed our ability to bring a wider range of integrations to our end-users as well as to ourselves (the platform team).
Be prepared for when you have to do integration because the product doesn't quite fit your use case. You can use Professional Services to boot-strap your integration by paying them to do the heavy integration work or you can boot-strap your own skills development and do the integration in tag-team form or by yourself. (We frequently do it ourselves, but there are always times when that cost of doing it ourselves is more expensive than having Professional Services do the heavy lifting until we can take over the integration.) Use Professional Services to your advantage, but don't become overly reliant on them. Build your own team to support your platform.
Previously, the two minor upgrades seemed to take a long time and seemed to have lots of problems.
At our 8.5.1.2 to 8.9.0 upgrade, we quantified for ScienceLogic the number of pain points required to upgrade and regain a measure of stability.
We suggested that use of RPM under the hood would ease their upgrade problems.
These were painful at 8-10 hour days per stack with a fair amount of cascading problems after the upgrade.
We worked with ScienceLogic to prepare for the 8.12 upgrade and had them verify our upgrade procedures.
At our 8.9.0 to 8.12.0.1 upgrade, we still had problems, but the overall stress of 8-10 hour days was replaced by a leisurely 4-6 hour days where one could take an hour out for lunch away from the desk.
Our upgrade process is now:
1. Install and upgrade on a vagrant - write the procedure.
2. Upgrade our non-prod environments.
3. Upgrade our prod environments.
4. Consult with ScienceLogic on upgrade challenges when complete.
- Getting over the 8.10 update process change. Future upgrades are expected to be simpler.
- Getting closure to the delivery of device role-based access capability in the new user interface. Expected in 8.14.
- Staying relatively current in terms of patch updates. Getting too far behind makes the process painful and complex.
- ScienceLogic Engineering has moved to semi-annual releases.
- We are timed to upgrade shortly after each semi-annual release.
- Device role-based access in the new user interface. (As an Enterprise Use Case customer, we want our teams to see most information across organizational boundaries without having to elevate rights inappropriately and risk exposure of credentials to unrelated organization members.)
- 14 will be our production platform on which we deploy our Integration Service (replacing the now end-of-lifed SyncServer) to handle our basic ServiceNow / CMDB integrations.
- Enabling our transition away from bolt-on ServiceNow integrations into Integration Service integrations so that we can simplify our integration costs and platform dependencies.
Powerful but complicated.
- Flexibility through scripting.
- Easy installation and upgrade.
- Wide community on the internet.
- Unwanted automation that causes rework like the auto alignment monitoring.
- Database monitoring on a full spectrum.
- Old GUI still connected with Nagios.
- Still not possible to measure and personally I'm not involved in the money area.
- Cloud monitoring
- Containers
- Virtual machines
- Implemented in-house
- DB monitoring
- Auto Alignment DA
- SNMP dependency
- Power Shell connection issues
- Sub components relationships
- Integration with IBM Omnibus
- Database monitoring using subcomponents
- Cloud monitoring
- In small environment it can be used as a full solution, from alerting to event enrichment then ticketing.
- Product Features
- Product Reputation
- Online training
- no training
With auto align a wrong change can be catastrophic
- SNMP monitoring, it is clean and easy to deploy.
- VMware monitoring, quick deployment and easy to understand.
- Discovery but DB discovery specifically
- Dynamic Applications auto alignment
- Netcool
- SNOW
- LDAP
- None at the moment.
- File import/export
- Performance.
- Failover capablity
- More details from collector side