TrustRadius
Datadog

Datadog

Overview

What is Datadog?

Datadog is a monitoring service for IT, Dev and Ops teams who write and run applications at scale, and want to turn the massive amounts of data produced by their apps, tools and services into actionable insight.

Read more
Recent Reviews

TrustRadius Insights

DataDog is a versatile tool that offers a comprehensive solution for monitoring and observing various components of the infrastructure. It …
Continue reading

Datadog Review

8 out of 10
March 09, 2019
Incentivized
We use Datadog on almost all of our production systems to give us granularity into how systems are running, and additionally, use …
Continue reading
Read all reviews

Awards

Products that are considered exceptional by their customers based on a variety of criteria win TrustRadius awards. Learn more about the types of TrustRadius awards to make the best purchase decision. More about TrustRadius Awards

Reviewer Pros & Cons

View all pros & cons
Return to navigation

Pricing

View all pricing

Free

$0

Cloud
Up to 5 hosts

Log Management

$1.27

On Premise
Per Million Log Events

Standard

$15/host

Cloud
Up to 500 hosts

Entry-level set up fee?

  • Setup fee optional
For the latest information on pricing, visithttp://www.datadoghq.com/pricing/?utm_s…

Offerings

  • Free Trial
  • Free/Freemium Version
  • Premium Consulting/Integration Services
Return to navigation

Product Demos

Datadog RUM Demo by Clint Osterholz

YouTube

Datadog Event Management Demo

YouTube

Integration Demo: Datadog

YouTube

Datadog integration with Azure offers a seamless configuration experience | Azure Friday

YouTube

Application Security Management Demo

YouTube

Datadog Demo - short

YouTube
Return to navigation

Product Details

What is Datadog?

Datadog is a monitoring, security and analytics platform for developers, IT operations teams, security engineers and business users in the cloud age. Datadog's SaaS platform integrates and automates infrastructure monitoring, application performance monitoring and log management to provide unified, real-time observability of their customers' entire technology stack. Datadog is used by organizations of all sizes and across a wide range of industries to enable digital transformation and cloud migration, drive collaboration among development, operations, security and business teams, accelerate time to market for applications, reduce time to problem resolution, secure applications and infrastructure, understand user behavior and track key business metrics.

Datadog Features

  • Supported: Aggregate metrics and events across your entire stack with Datadog's 450+ built-in integrations
  • Supported: Trace requests from end to end across distributed systems with APM
  • Supported: Explore and analyze logs from all your services, applications, and platforms
  • Supported: Proactively monitor critical user journeys and visualize user experience data in one place
  • Supported: Correlate frontend performance with business impact using user experience metrics
  • Supported: Build real-time interactive dashboards to monitor metrics, traces, logs, and more
  • Supported: Visualize traffic flow in cloud-native environments
  • Supported: Monitor ephemeral systems without fatigue using machine learning-based alerts
  • Supported: Detect threats in real-time across your applications, network, and infrastructure with Security Monitoring
  • Supported: Free trial, no credit card needed

Datadog Screenshots

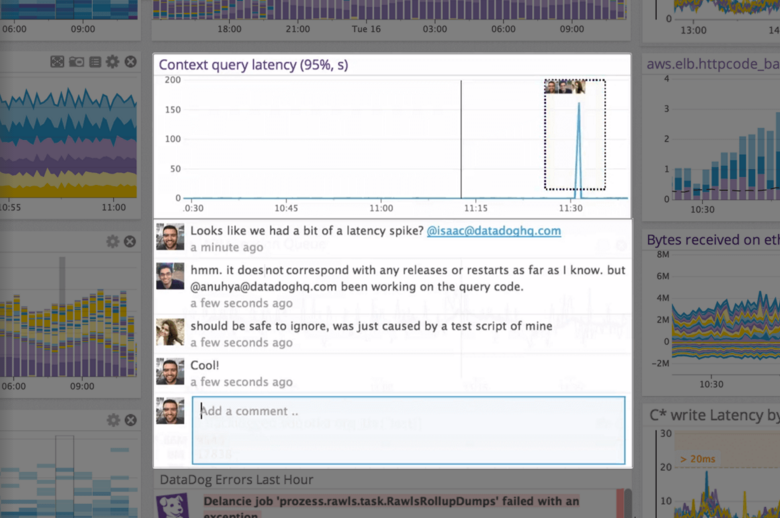
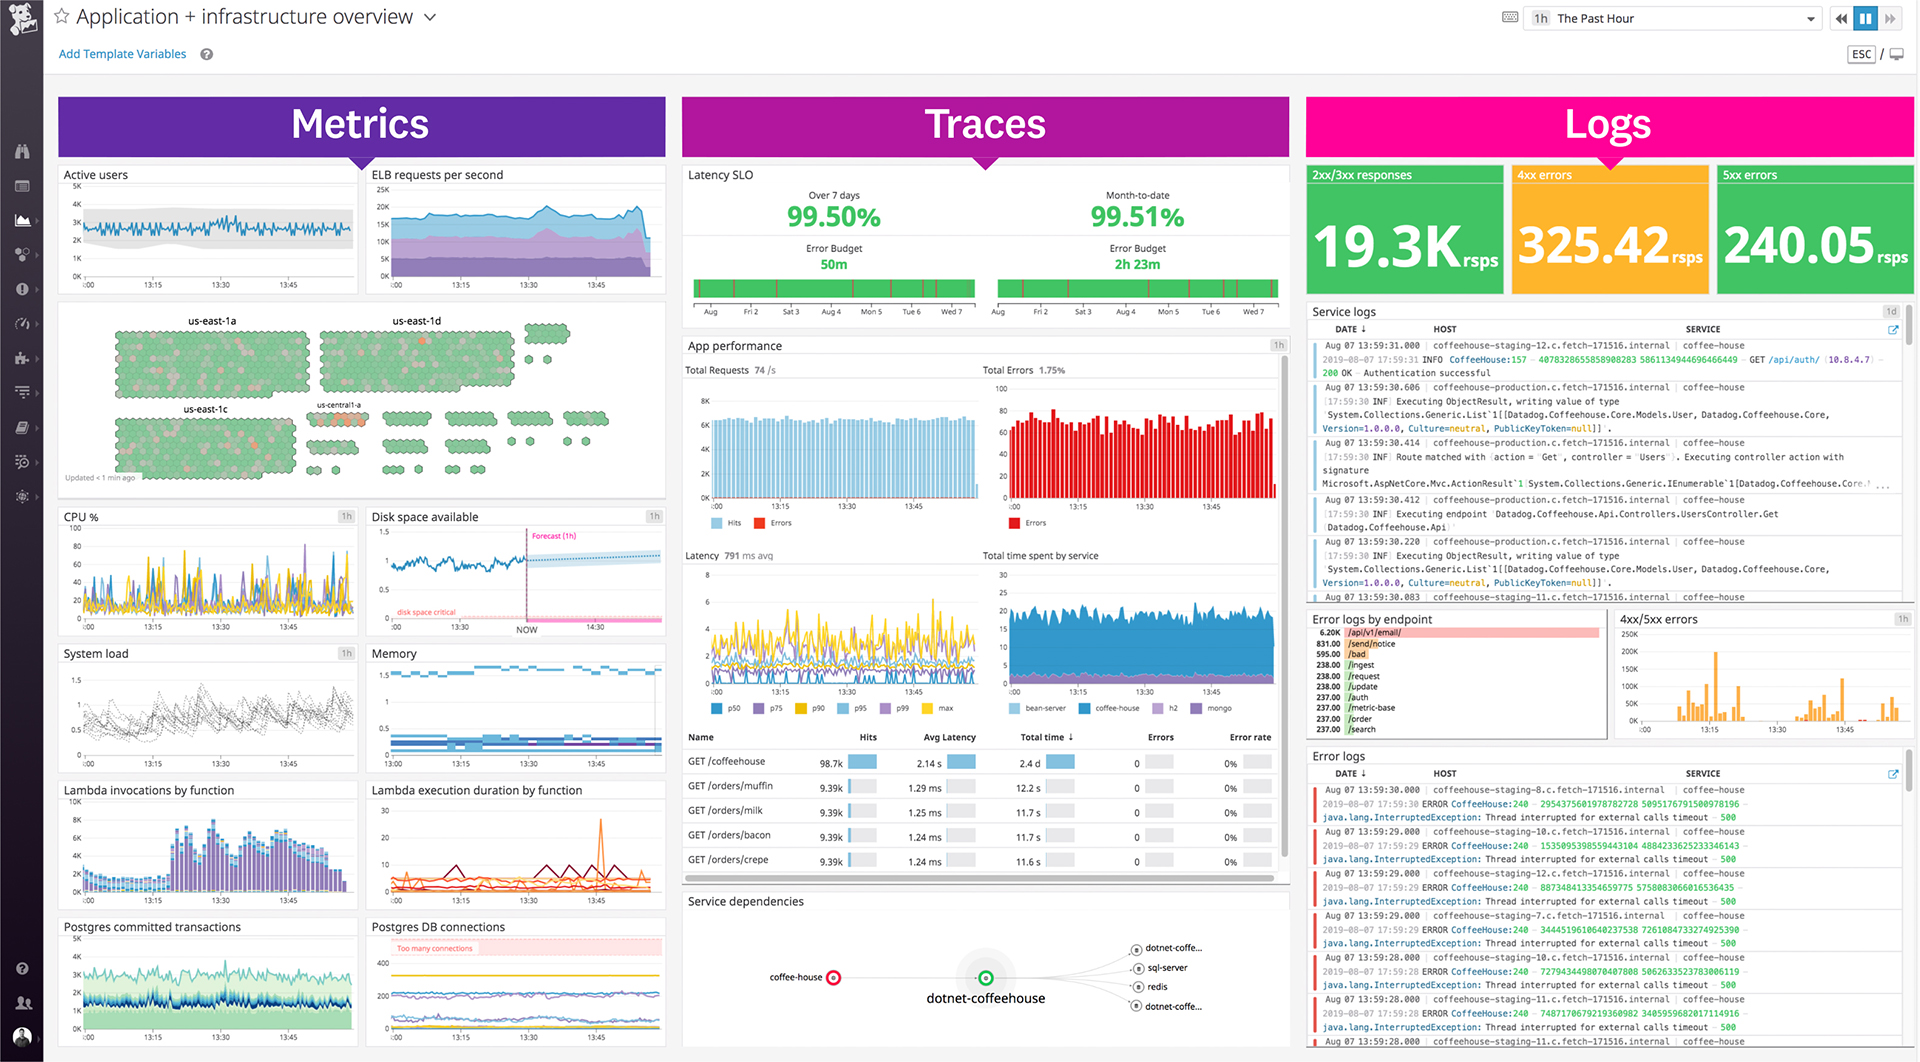
Screenshot of Out-of-the-box and easily customizable monitoring dashboards.Screenshot of Datadog is built to give visibility across teams. You can discuss issues in-context with production data, annotate changes and notify your team, see who responded to that alert before, and remember what was done to fix it.Screenshot of Datadog seamlessly unifies traces, metrics, and logs—the three pillars of observability.Screenshot of Collect monitoring data from across your entire stack with Datadog's 400+ built-in integrations.Screenshot of Datadog's Service Map decomposes your application into all its component services and draws the observed dependencies between these services in real timeScreenshot of Centralize log data from any source.Screenshot of Datadog's Host Map let you see all of your hosts together on one screen, grouped however you want, filtered however you want, with metrics made instantly comprehensible via color and shape.

Datadog Videos

Datadog offers a single unified platform to observe your infrastructure, applications, network flows, security threats, UX, and more. For full visibility, you can seamlessly navigate between metrics, traces, and logs. See inside any stack, any app, at any scale, anywhere.
Datadog APM provides deep visibility into application performance and code efficiency, so you can monitor and optimize your stack at any scale and provide the best digital experience for your users. APM and distributed tracing are fully integrated with the rest of Datadog, giv...
 Show More
The Service Map automatically decomposes your application into all its services and dependencies so you can visualize your architecture in real time.

Datadog Integrations

Datadog Technical Details

Deployment TypesOn-premise, Software as a Service (SaaS), Cloud, or Web-Based
Operating SystemsWindows, Linux, Mac, Debian, Ubuntu, CentOS/RedHat, Fedora, CoreOS, Docker, Kubernetes, Openshift, SmartOS, Chef, Puppet, Ansible
Mobile ApplicationApple iOS, Android
Supported LanguagesEnglish

Frequently Asked Questions

Datadog is a monitoring service for IT, Dev and Ops teams who write and run applications at scale, and want to turn the massive amounts of data produced by their apps, tools and services into actionable insight.

Splunk Cloud, Dynatrace, and SolarWinds Log Analyzer (LA) are common alternatives for Datadog.

Reviewers rate Support Rating highest, with a score of 8.9.

The most common users of Datadog are from Enterprises (1,001+ employees).
Return to navigation

Comparisons

View all alternatives
Return to navigation

Reviews and Ratings

(230)

Community Insights

TrustRadius Insights are summaries of user sentiment data from TrustRadius reviews and, when necessary, 3rd-party data sources. Have feedback on this content? Let us know!

DataDog is a versatile tool that offers a comprehensive solution for monitoring and observing various components of the infrastructure. It has been widely adopted by engineering and DevOps teams for its ability to monitor applications, aggregating logs, and setting up alerts. Users have found it particularly useful for tracking and analyzing data, enabling them to make informed business decisions. With its user-friendly interface, DataDog makes it easy for users to navigate and utilize its features, addressing both business and technical needs in a rapidly evolving infrastructure. Customers have praised the software for its ability to streamline workflows, increase productivity, and manage business operations efficiently. The product's reliability and stability have also been commended with minimal downtime or technical issues. Additionally, the integration capabilities of DataDog with other software systems allow for seamless data transfer and efficient collaboration. The reporting and analytics capabilities have proven valuable in monitoring key metrics and performance. Users have also highlighted the prompt and helpful customer support provided by DataDog when needed.

In use cases specific to organizations such as Wayfair's Monitoring, Network Ops, and Critical Incident teams, DataDog is utilized to provision, manage, and maintain internal and external sites and applications. These teams rely on the software's dashboard functionality during server or website issues to quickly assess the current state of the environment. Furthermore, integration with ServiceNow allows for storing and indexing DataDog alerts, while additional notification systems ensure widespread communication of alerts to stakeholders.

DataDog proves its versatility by supporting a wide range of integrations, making it suitable for monitoring any service. It is implemented as the APM of choice for organizations seeking insights into metrics such as ELB, container and network stats, memory usage, slow queries, high throughput readings, and request tracing. This centralized solution helps organizations monitor instances in private cloud and AWS environments effectively. It aids in monitoring critical server uptime along with switches and routers while integrating with APIs for event generation and alerting.

The product finds its applicability in diverse scenarios, including monitoring public cloud instances, addressing complex monitoring requirements for IoT and mobile app APIs, and aiding in root cause analysis by monitoring multiple hosts for networking, compute, memory, and application-level metrics. DataDog has also proven valuable in e-commerce applications, providing a comprehensive solution for monitoring applications and logging within a single pane of glass.

Overall, users have reported positive experiences with DataDog, highlighting its usefulness in various use cases and praising its features such as the user-friendly interface, integration capabilities, reliability, and customer support.

Easy customization and understanding: Many users have found the dashboard in Datadog to be easy to customize and understand for their organization's needs, allowing them to effectively consume various site metrics.

Strong integration support: Several reviewers appreciate the strong integration support of Datadog, mentioning that it supports pretty much any service they can think of. This flexibility allows them to seamlessly integrate with other tools and services in their workflow.

Helpful customer support: Users have mentioned that Datadog's customer support is helpful and responsive. They appreciate the assistance provided by the support team in finding workarounds for any issues they encounter during their usage of the platform.

Challenging User Interface: Some users have found the user interface of Datadog to be challenging, particularly when searching for host information and the agent install link. Navigating and locating these features has taken some time.

Limited Reporting and Analytics: Several reviewers have mentioned limitations in reporting and analytics capabilities of Datadog. They feel that advanced mathematical and graphing operations are not well-supported, leading them to suggest using another business intelligence tool for these tasks.

Steep Learning Curve: Many users have emphasized a heavy learning curve associated with setting up and configuring Datadog across the entire application or software stack. This upfront work, combined with a lack of intuitive navigation, has made it overwhelming for newcomers to find the right metrics or dashboards unless they know exactly what they're looking for.

Based on user reviews, users commonly recommend the following for Datadog:

  • Try the free trial and evaluate different plans. Users suggest taking advantage of the free trial offered by Datadog to determine which plan best suits their needs. This allows users to explore the features and functionalities of Datadog before committing to a paid subscription.

  • Consider cost and compatibility. Customers advise being mindful of the cost associated with Datadog, particularly when compared to open-source solutions for managing a large number of servers. Additionally, users recommend considering the compatibility of Datadog with serverless styles, as this may impact its effectiveness in certain environments.

  • Conduct a proof of concept (POC) and onboard employees. Reviewers highlight the benefits of conducting a proof of concept (POC) with Datadog before fully integrating it into their infrastructure. They emphasize that Datadog is easy to evaluate and onboard employees, making it a valuable tool for monitoring complex infrastructures. Users also mention that building an alerting and monitoring system is made easier with Datadog's capabilities.

While some users mention that Datadog can be expensive compared to open source alternatives and may have a more complex user interface, they believe that once users become familiar with the app, it is highly efficient. The visualization tools and reporting metrics offered by Datadog are considered essential for any organization. Furthermore, reviewers praise the great support provided by Datadog and encourage reaching out to them for any questions or concerns.

Attribute Ratings

Reviews

(1-22 of 22)
Companies can't remove reviews or game the system. Here's why
Anuj Rai | TrustRadius Reviewer
Score 9 out of 10
Vetted Review
Verified User
Datadog served as our end-to-end monitoring solution, covering applications, databases, servers, and more. We extensively utilized Datadog's modules to monitor our entire infrastructure, addressing various use cases such as identifying latency in applications, databases, and networks. The ability to pick and correlate small metrics proved valuable in enhancing user experience and achieving a better Mean Time to Resolution (MTTR).


  • Application performance monitoring which is related to collecting traces in the application
  • Synthetic monitoring which is really cool feature of record and play with prior no programming knowledge is needed
  • Notebook where you can share the documents, SOP or any kind of documentation or notes with your team
  • Synthetic agent for private location as they have bug and this agents can't handle SSO
  • Also in synthetic monitoring while recording scenario everytime you have to go for incognito mode as there are some issue related to cache.
  • Database monitoring need some improvement in terms of monitoring oracle based databases
I guess Datadog has performed really outstanding in almost every sphere and every module of Datadog is really good. One of the cool feature is calculating SLA and SLO, based on that you can setup even alerting and notification.

The area where it didn't perform well is synthetic monitoring private agent to monitor SSO application as it's failed to captured metrics due to limitation and bugs.
Aman Makwana | TrustRadius Reviewer
Score 10 out of 10
Vetted Review
Verified User
Incentivized
DataDog is our OneStop solution for all our observability and monitoring stack needs for monitoring the Backend, Frontend, Database, Proxies, Servers, and all our other Infrastructure Components. Also has the flexibility to create, share and use Custom as well as predefined sets of Dashboards that help us troubleshoot many severe as well as production system-impaired issues. Fed custom metrics in Dashboards like Response time, data per environment, site availability, error rates, success rates, error as per error codes, and request tracing. Database dashboards can also give us many details like slow queries, reading high throughput, writing high throughput, and some recommendations to make our platform faster and more robust.
  • Create Dashboards as per application, environments, and Custom metrics in one panel.
  • Log aggregation, one-stop Application monitoring tools for the whole infrastructure.
  • Playbooks, SLA definition, success and error quotas, request visualizations.
  • DB monitoring, Serverless stack monitoring.
  • Alerting of Production incidents so we can quickly resolve the issues on time.
  • Handy Documentation.
  • Make Cost effective.
DataDog Is well suited to all of the Infrastructure Monitoring Solutions, DB monitoring, and other Network monitoring also. It's not well suited because it cannot give perfect Infrastructure recommendations for our use case but also For example: If we are using AWS DB to monitor performance insights then Datadog is less effective there because AWS gives very niche recommendations.
Score 8 out of 10
Vetted Review
Verified User
Incentivized
DataDog is used as directional monitoring tool for all the applications. It is used for full stack monitoring from backend to frontend as well as end user. It helps in keeping tabs on the performance of application and also help in troubleshooting at times of any outages. It also helps in identifying the the area that can we worked upon to improve application performance.
  • Application Performance Monitoring
  • Browser and end user monitoring
  • Infrastructure monitoring
  • Third-party integrations
  • Synthetic Monitoring
  • Integration with IDE tools
  • Root access needed for agent installation
This is best suited for monitoring web applications. One will be able to monitor all the components be it infrastructure monitoring for servers or application or end user monitoring, all can be achieved though installation of a single agent on your server. Only drawback is that you need to have root access to the server to onboard a server to datadog.
September 22, 2022

The APM tool you'll love

Score 10 out of 10
Vetted Review
Verified User
Incentivized
We use Datadog to trace and monitor our whole infrastructure. The APM feature is a blessing. Also, the log stream is way better than the same features of similar products. We used it to gather and centralize data from AWS into an easy-to-understand dashboard. For example, we created dashboards with the data per environment about availability, error rates, error quotas & network traffic.
  • APM
  • Log streaming
  • Playbooks, which are a collection of "views" that you can aggregate into a single dashboard.
  • JSON parsing on logs
  • Documentation
If you want to get the most insightful data from your infrastructure, and being able to take one dashboard which is easily understandable by engineers and managers, then Datadog should be your way to go.
Score 9 out of 10
Vetted Review
Verified User
Incentivized
Datadog is used by couple of departments within the organization. We are using it to monitor our infrastructure such as the servers, containers, processes, storage health as well as to load and look into the metrics.
  • Single stop for monitoring various database types and their infrastructure.
  • Easier to look into metrics history.
  • Managing downtime for various resources is simple.
  • It would be good if there were a way to remove resources from Datadog faster.
An organization that has multiple types of NoSQL databases and different applications can definitely use Datadog to have as a one-stop solution to monitor resources as well as metrics.
Score 9 out of 10
Vetted Review
Verified User
Incentivized
It is used to monitor multiple hosts for networking, compute, and memory along with application-level metrics (errors, performance, etc). This allows for site reliability engineers to determine the cause of errors and gain other data for root cause analysis (RCA).
  • Visualization
  • Network mapping
  • Error finding
  • Navigation to new areas can be counterintuitive.
A situation in which you have multiple applications deployed to virtual machines (VMs) with the need for application-level performance, errors, etc.
Score 9 out of 10
Vetted Review
Verified User
Incentivized
We are testing and using Datadog in the e-commerce applications we are creating in a project to re-engineer our existing legacy applications, and transform them into a micro services based architecture hosted on several different cloud platforms. Datadog is helping us to monitor all the applications and the logging within a single pane of glass.
  • APM monitoring.
  • Logging.
  • Alerts.
  • Cost.
  • Training.
  • Documentation.
Datadog is well suited to monitoring applications in the cloud.
Dmitry Pashkevich | TrustRadius Reviewer
Score 9 out of 10
Vetted Review
Verified User
Incentivized
We use Datadog to monitor all kinds of application metrics: errors, network stats, response times, queues, and a bunch of application-specific metrics. We also have alerts set up that notify us of changes in production application performance. We also get a lot of metrics "for free" from all kinds of third-party tools (e.g. ElasticSearch, GitHub, Heroku, Cloudflare, etc).
  • Thanks to the tool's versatility and a huge ecosystem around it, you can use it to track virtually anything.
  • Powerful alert and warning configuration let you drastically reduce false positives.
  • Runbooks give your team members guidance on how to act on alerts.
  • Powerful data analysis features: you can slice and dice your data, almost the same way you can do it in a behavioral analytics tool. This means you can efficiently refine your metrics as your business grows.
  • Overwhelming to use for newcomers.
  • Even when you're familiar with the tool, finding the right metric or dashboard can be challenging unless you know exactly what you're looking for.
If you're a cloud-based software company, you should use Datadog, period. They're a strong leader in the space for a reason. Datadog will scale with your company's data needs, and if there's something it can't do today, it probably will in the next few months or a year. It might be an overkill if your product/business is very small.
Score 8 out of 10
Vetted Review
Verified User
Incentivized
Our IT department uses Data Dog to monitor critical server uptime as well as switches and routers over SNMP. We also use the Data Dog API to write critical events for alerting and monitoring. We don’t currently use the application monitoring features, but I could see us using them in the future.
  • Price.
  • Functionality/extensibility.
  • Support.
  • Community.
  • Documentation is lacking in some places.
  • Some features could be easier to set-up.
  • Favors customization over simplicity.
Data Dog is great product for modern tech stacks on cloud technology. Might not be as good of a fit for non tech companies or older tech stacks. This being said we use it to monitor some old windows servers and some old sql server instances. We also appreciate the custom API and use it for some of our apps to write alerts of issues to.
Score 10 out of 10
Vetted Review
Verified User
Incentivized
We had very complex monitoring requirements for APIs related to IoT and mobile app users. There were several different tools, no reliable results and we were losing credibility in the stability and reliability of our infrastructure. Also, all tools were very difficult to manage, implement and support, not to mention expensive.
  • API monitoring
  • End-user experience
  • Easy to implement
  • Agent-based
  • Initial learning curve
  • Azure integration could be easier
Cloud, API and end-user monitoring. Complex monitoring situations where multiple platforms are involved. Love also the integration with other solutions like Slack. I cannot see any specific situation where it doesn't fit—for those particular platforms mentioned before. I do not consider the price to be expensive, but that's my opinion.
Score 9 out of 10
Vetted Review
Verified User
Incentivized
Our DevOps team utilizes DataDog to be aware of any abnormalities across our infrastructure, whether hosted or local. We can look in one place to see stats and alarms across all infrastructure, independent of hosting provider's console. Being a software company, we can also send events to DataDog via their API to generate alerts for certain activity within our applications.
  • Server resource usage
  • Multi-stage alerts based on configurable thresholds
  • Custom Dashboards of all accumulated data
  • We had a couple "integrations" that had some issues during setup, but Support addressed them very quickly
  • Unnecessary alerts about DataDog components...by the time I see them, they're almost always also fixed
  • I wish there was a DataDog mobile app that would have dedicated alerts (configurable per alert to override Do Not Disturb setting) instead of relying on emails notifications that could be overlooked in the midst of many incoming emails around the same time.
Datadog is a no-brainer for any environment that relies on multiple servers. Even for one server, it's so much better to use for monitoring and alert capability than anything else I remember looking at before we started using Datadog. Teams can even use it to track their progress of investigating an alert so multiple people aren't unknowingly looking into the same exact issue unnecessarily.
March 09, 2019

Datadog Review

Score 8 out of 10
Vetted Review
Verified User
Incentivized
We use Datadog on almost all of our production systems to give us granularity into how systems are running, and additionally, use Datadog's logging feature to aggregate all of our logs across systems in real time. Datadog's simple dashboards enable visibility from different providers to be displayed all in one place, even if systems are not from the same vendor.
  • Does a good job at log management with full search, live-access, and automatic archiving to S3 is also simple.
  • APM is fantastic and gives great insights into production machines, but is not cheap.
  • Because APM is billed by instance, it can be very expensive -- perhaps even more than the cost of the underlying instances depending on the kinds of systems you are running.
  • While it's not difficult to deploy, it certainly has quirks owing to the limits of cloud platforms -- we wish it was easier to set up for some services.
For organizations that understand and require the value-add of Datadog, it's a great choice for log management, APM, and system visibility. Because of its costs, it's not well suited to smaller organizations, or organizations running lots of small workloads on inexpensive VMs, where you are stuck paying the same price that an organization would pay for a server 100x the size.
Gabriel Samaroo | TrustRadius Reviewer
Score 9 out of 10
Vetted Review
Verified User
Incentivized
The engineering/dev-ops teams use DataDog as the tool of choice for monitoring our applications/servers, and for aggregating logs. All of our applications and micro-services use the DataDog Rest API to send metrics to, so that we can monitor performance and CPU usage, and setup alerts in case any issues arise.
  • Great UX. Good looking dashboards and advanced graphs.
  • Simple Rest API allowing integration with basically any service/application. Allows for the creation of a centralized source of data.
  • Good API documentation and very responsive customer service.
  • Good pricing model for micro-services. Can handle getting data from many sources without having to pay as much as alternatives.
  • Limitation on what you can do with reporting and analytics. If you need to do very advanced mathematical/graphing operations, might need to use data in another BI Tool to accomplish.
  • Good amount of upfront work to install and configure across your entire application/software stack. Heavy learning curve.
  • Logging capabilities not as robust as alternatives like Splunk.
Datadog is great when you have a complex software system, with multiple applications and micro-services. If you have the resources to do the upfront work of integrating with your platform(s), it will be a great tool to handle monitoring/alerts. It also has nice features for log aggregation. The graphs and dashboards also make Datadog a useful tool to others, such as Managers and non-Engineers, not only for Dev-Ops and Engineers directly using it. If you want something to use quicker out-of-the-box or don't want to spend any money there are quicker/cheaper options.
November 23, 2018

DataDog at Wayfair!

Anthony Zappala | TrustRadius Reviewer
Score 9 out of 10
Vetted Review
Verified User
Incentivized
DataDog is currently being used by Wayfair's Monitoring, Network Ops, and Critical Incident teams to provide a variety of data to provision, manage and maintain the existing infrastructure for internal and external sites and applications. It is a critical input to how these teams identify, tag, and respond to alerts within the company. We use Datadog for the current day to day provisioning tasks and well as prior/after any maintenance.

It has a key plug-in with ServiceNow and this is a key integration at Wayfair. ServiceNow is used as the reporting platform to store and index all DataDog alerting. Further, we have built several notification systems to piggy back off DataDog alerts for clear and wide-spread notifications to all stakeholders of a particular stack of technology.

The visuals and simple interface provides a clean and ready-made application in which to address the business and technical needs, for a rapidly evolving infrastructure. Wayfair has a tremendous amount of growth and we rely on this tool to grow and adapt alongside us. The Platform as a Service approach has proven to provide what we need, without the dependencies to support the infrastructure, which is a big bonus for our teams.
  • APIs, the ability to interact with the data we pull into data dog is key. We port the information over to Servicenow, so the ability to pull everything into DataDog, then Servicenow, is a key component of our success here at Wayfair.
  • Simple Interface - clean, useful, effective. Allows users to use DataDog for one reason, get work done.
  • Lightweight agent on hosts
  • Reducing the delays in monitoring agent response time
  • Configuration of aggregate metrics, allow us to compile / aggregate data faster and with more ease
  • Improvements in Security policies
DataDog is well suited for an environment that requires low-level investment on supporting infrastructure, a cloud-based approach or something that is priced at a fair enough level where you can grow the business with your footprint without sacrificing on features.
August 04, 2018

Datadog tool

Rahul Narula | TrustRadius Reviewer
Score 9 out of 10
Vetted Review
Verified User
Incentivized
Datadog is implemented as APM of choice for our organization at the platform level. Any team across the company opting to use the platform gets Datadog to gain insights into the platform with metrics like ELB, container & network stats, memory usage etc. This integration comes out of the box for the clients which they can use for monitoring their services
  • Easy to setup and use
  • offers wide variety of integrations with third-party services and systems
  • Cheaper than competitors
  • No custom query language which can be handy
  • Initial setup and configuration can be painful at the start
  • Additional reporting capabilities missing
We are using Datadog to send Hystrix metrics of various service there and had setup various monitors and alerts which alerts on any underlying issue ahead of time before a major failure. Also created a dashboard quite similar to Hystrix Dashboard with ability to look back in time. It has worked well for us.
Girivaru Tarun | TrustRadius Reviewer
Score 8 out of 10
Vetted Review
Verified User
Incentivized
We are Premium MSP partner for AWS so our DevOps engineers, Managers user them, We also have a product for Cloud Management Platform where we are working on parsing information from Datadog to our SaaS platform to present monitoring data much graphically.
  • Monitors resource metrics well
  • always prompt
  • simple UI
  • customizations available for metric visualization
  • no Oracle integration
  • increased data retention of metrics
  • Support for more custom intergrations like Kubernetes etc.
  • go easy on pricing a bit!
Datadog is best for evaluating performance of applications and identifying bottlenecks. It has support for custom metrics. It has a good UI and constant enrichment of feature set which helps admins and users solve infrastructure issues quickly. Compared to 2-3 years before Datadog now has significant change and is well suited to the cloud environment. Improving very fast. Good job!

Sometime the agent has issues and causes CPU spikes but was fixable.
Score 9 out of 10
Vetted Review
Verified User
Incentivized
It's being used by all engineers. We have scaled our e-commerce, and Datadog makes easier to look at each cluster. One great point of Datadog is how easy it is to identify an unhealthy box. Also, another great one, is to watch important metrics like CPU and memory. It's way easier to watch it on Datadog rather than AWS itself.
  • Monitoring unhealthy box instances
  • Watch CPU usage
  • Watch Memory Usage
  • Monitoring logging issue. To do that, we need other kinds of tool, such as Splunk.
  • It takes a time to create a dashboard from scratch. It's easy to set up by a senior user, but it is not for beginners.
It's well suited for any scaled application. During peak time, we can scale up our application, and start watching it via DataDog. Doing so, DataDog provides us a hand dashboard to watch (un)healthy box instances. Last time, it pointed some instances that had a severity memory leak. By identifying those instances, it makes easier to replace that unhealthy instance quickly.
Mariano Koldobsky | TrustRadius Reviewer
Score 10 out of 10
Vetted Review
Verified User
Incentivized
Datadog is being used in the whole company to monitor all the instances we have. Used to be in private cloud and now it is used in AWS instances also.
  • Datadog is great for monitoring CPU, memory and all the resources
  • Combined with New Relic and OpsGenie you have all the alerts you need
  • Datadog has a long time history to compare over time
  • Sometimes the graphics are a little bit confusing
It succeeded in complex architecture and infrastructure
Score 8 out of 10
Vetted Review
Verified User
Incentivized
We use Datadog for monitoring our public cloud. We integrate it with some of the AWS components and monitor our instances on the cloud. It's a great solution for cloud-based monitoring with APIs.
  • Dashboards are so great.
  • Rest API functionality makes this one of the best monitoring tools on the market.
  • With the integration it provides with cloud watch, there is an option to monitor even without the agent installation.
  • We need to automate the agent installation, otherwise, it's a tedious job to do manually.
  • The integration with AWS had some issues in the past, but that seems better now.
  • This product has a steep learning curve at the beginning.
It's well suited for monitoring instances in the cloud. Good pricing. But I feel that the performance monitoring and instrumentation is still better in New Relic.
Kevin Van Heusen | TrustRadius Reviewer
Score 9 out of 10
Vetted Review
Verified User
Incentivized
Datadog provides great visibility into how our server infrastructure is performing. There is support for a huge variety of integrations, pretty much any service you can think of has a supported integration. Our organization uses the dashboard functionality to get a quick view as to the current state of our environment. If there's a server or website issue, everyone hops onto Datadog to get a view as to what's happening.
  • The dashboard is easy to customize and understand for our organization to consume various site metrics.
  • The integration support is very strong, pretty much any service you can think of is supported. Also can create custom metrics.
  • Datadog customer support is helpful and responsive. Can generally help with workarounds to any issues.
  • User interface could be improved in some areas, looking for host information and the agent install link takes a bit of time.
  • Configuration of the agent is generally done via a config file which is a pro and a con. It would be nice to have some UI to configure various agent options.
  • Billing isn't entirely straightforward, they could use more reports to figure out the source of your monthly costs.
Datadog is the best application we have come across for displaying website and server metrics as well as alerts. Datadog can consume events from a whole host of systems and configure alerts when issues appear. Datadog has both Windows and Linux support, so it can handle posting metrics from pretty much any server.
February 15, 2017

All the DevOpsy things

Deepshikha Gandhi | TrustRadius Reviewer
Score 10 out of 10
Vetted Review
Verified User
Incentivized
Datadog helps us monitor our applications and ensure uptime. It is widely adopted by the entire engineering organization. When it comes to gathering performance metrics and tuning of our software applications, Datadog is just what we need. It ensures our infrastructure is highly available with fast and reliable services to our customers.
  • Metric and time series data collection
  • Integrations with other tools like PagerDuty, Slack and AWS
  • Creation of monitors to trigger alarms and notify teams
  • Easier way to create new dashboards and a way to implement them as code
  • Datadog needs to be woven into application's code which creates dependencies
  • Make the datadog agent more robust and reliable
Datadog fits your use case perfectly if you're writing, testing and running applications generating huge amounts of data and want a way to view this information graphically. Datadog has valuable features like sharable dashboards, Slack integration, CloudWatch integration and alerting. It might be less appropriate for monitoring system and process level metrics. It can certainly do those but there are other tools out there like Zabbix, Nagios and Icinga.
Score 5 out of 10
Vetted Review
Verified User
Incentivized
Datadog is being used to pull variable information from an agent on each of our servers and sent to a centralized location so we have a one stop place to understand how well our servers and services are doing. It is being used by the operations team as well as developers. It addresses getting having to go many places to get the same information.
  • Centralized data.
  • Quick easy graphs.
  • Customization.
  • Many other products out there like it.
  • Not as dynamic as some other open source tools.
  • Pricey compared to open source tools.
Datadog can be used by any company that wants to get a deeper understanding of their systems and services. It's great for each project to determine what quantifiable data would lead to success. It would be less appropriate to use it for financial information as there are lots of better tools for that.
Return to navigation