Overview
What is SAP Lumira Discovery?
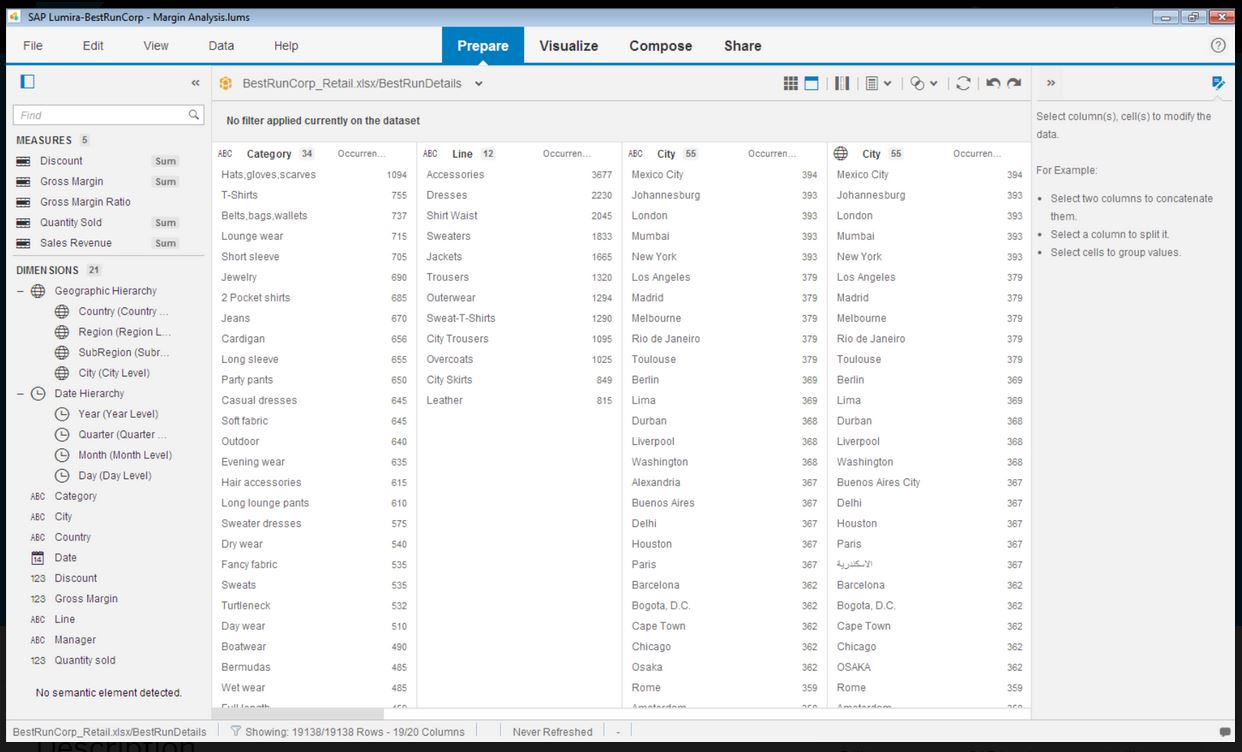
SAP Lumira Discovery is SAP’s data visualization and discovery application. It facilitates data discovery, visualization, and analysis by assisting users with creation of dashboards, infographics, presentations, data facets, tag clouds, and more.
An Excellent Business Intelligence Tool
Lumira Pilot
Data Visualization tool for big data
SAP Lumira is powerful analytical tool, however being overshadowed by SAP SAC as goto tool
Lumira is Good but NOT Great
SAP Lumira Discovery is top of its class
Best Self-Service BI solution for SAP customers who cannot use SAP Analytics Cloud
Positiveness and Negativeness in SAP Lumira Discovery
Easy Business Planning and Effective on Predictive Data Analytics Production SAP Package.
SAP Lumira - the new version is totally amazing for self-service BI and making the most out of your data!
Great product
Lumira
SAP Lumira Software
Take the scariness out of Big Data and put it to work for you!
Awards
Products that are considered exceptional by their customers based on a variety of criteria win TrustRadius awards. Learn more about the types of TrustRadius awards to make the best purchase decision. More about TrustRadius Awards
Popular Features
- Pre-built visualization formats (heatmaps, scatter plots etc.) (101)8.282%
- Formatting capabilities (102)8.080%
- Drill-down analysis (99)7.777%
- Report sharing and collaboration (97)7.373%
Pricing
SAP Lumira, standard edition
$185
Entry-level set up fee?
- No setup fee
Offerings
- Free Trial
- Free/Freemium Version
- Premium Consulting/Integration Services
Features
BI Standard Reporting
Standard reporting means pre-built or canned reports available to users without having to create them.
- 7.6Customizable dashboards(96) Ratings
Customizable dashboards are dashboards providing the builder some degree of control over the look and feel and display options.
Ad-hoc Reporting
Ad-Hoc Reports are reports built by the user to meet highly specific requirements.
- 7.7Drill-down analysis(99) Ratings
Drill down analysis is the ability to get to a further level of detail by going deeper into the hierarchy.
- 8Formatting capabilities(102) Ratings
Ability to format output e.g. conditional formatting, lines, headers, footers.
- 7.3Report sharing and collaboration(97) Ratings
Report sharing and collaboration is the ability to easily share reports with others.
Report Output and Scheduling
Ability to schedule and manager report output.
- 7.7Publish to Web(81) Ratings
- 7.7Publish to PDF(93) Ratings
- 6.3Report Delivery Scheduling(55) Ratings
Report Delivery Schedule is the ability to have reports delivered to a destination at a specific data and time.
Data Discovery and Visualization
Data Discovery and Visualization is the analysis of multiple data sources in a search for patterns and outliers and the ability to represent the data visually.
- 8.2Pre-built visualization formats (heatmaps, scatter plots etc.)(101) Ratings
Pre-built visualization formats are canned visualization types that can be selected to visualize different kinds of data.
- 6.6Location Analytics / Geographic Visualization(94) Ratings
Location analytics is the visualization of geographical or spatial data.
- 2Predictive Analytics(72) Ratings
Predictive Analytics is the ability to build forecasting models based on existing data sets.
Product Details
- About
- Competitors
- Tech Details
- FAQs
What is SAP Lumira Discovery?
SAP Lumira Discovery Features
BI Platform Features
- Supported: Live Connection to External Data
- Supported: Snapshot of External Data
- Supported: OLAP (Pre-processed cube representation)
- Supported: ROLAP (SQL-layer querying)
- Supported: Multi-Data Source Reporting (Blending)
Supported Data Sources Features
- Supported: MS Excel Workbooks
- Supported: Text Files (CSV, etc)
- Supported: Oracle
- Supported: MS SQL Server
- Supported: IBM DB2
- Supported: Postgres
- Supported: MySQL
- Supported: ODBC
- Supported: Hortonworks Hadoop
- Supported: IBM Netezza
- Supported: HP Vertica
- Supported: SAP Hana
- Supported: Teradata
- Supported: Salesforce
- Supported: SAP
BI Standard Reporting Features
- Supported: Customizable dashboards
Ad-hoc Reporting Features
- Supported: Drill-down analysis
- Supported: Formatting capabilities
- Supported: Report sharing and collaboration
Report Output and Scheduling Features
- Supported: Publish to Web
- Supported: Publish to PDF
Data Discovery and Visualization Features
- Supported: Pre-built visualization formats (heatmaps, scatter plots etc.)
- Supported: Location Analytics / Geographic Visualization
Additional Features
- Supported: Acquire and enrich data, big and small, from any source
- Supported: Visualize and explore any amount of data in real time without sacrificing performance or security
- Supported: Export reports, dashboards, presentations and infographics to pdf format for easy sharing
SAP Lumira Discovery Screenshots
SAP Lumira Discovery Video
SAP Lumira Discovery Competitors
SAP Lumira Discovery Technical Details
Deployment Types | On-premise |
---|---|
Operating Systems | Windows |
Mobile Application | No |
Supported Languages | Chinese (Simplified), Czech, English, French, German, Hungarian, Japanese, Korean, Polish, Portuguese, Russian, Spanish, Turkish. |
Frequently Asked Questions
Comparisons
Compare with
Reviews and Ratings
(496)Attribute Ratings
- 9Availability1 rating
- 7Performance1 rating
- 7.8Usability14 ratings
- 7Support Rating11 ratings
- 6Online Training1 rating
- 6In-Person Training1 rating
- 10Implementation Rating3 ratings
- 2Configurability1 rating
- 6Product Scalability1 rating
- 5Ease of integration1 rating
- 8Vendor pre-sale1 rating
- 8Vendor post-sale1 rating
- 10Data Sources89 ratings
- 2Data Sharing and Collaboration83 ratings
Reviews
(1-25 of 70)SAP Lumira is for DATAphiles
- Recommended charts option will give you a quick overlook at your data
- Customization of the charts and graphs as per our needs
- The interface is user-friendly and there are videos to help you to navigate along in case you get lost
- Easy visualization, more detailed reports, good for presentation
- Manual data entry in LUMIRA
Lumira Pilot
- Data sources
- Histoty
- Response
- Dadboards
- Interactive
- Analytics
- Examples
Data Visualization tool for big data
- Interpret high volumes of internal data and transform into visual reports.
- Analysis of visual reports to make strategic decisions.
- High level analytics.
- To many options making it difficult to navigate.
- Layout should be more up to date.
Lumira is Good but NOT Great
- Connecting data
- Data merging
- Constant discoveries of relevant data for the business
- Allows vast volumes of usable internal data and translate that into a graphic study
- Too many commands
- Can be hard to use and the process of learning is difficult as well
- Can be expensive
- Graphs and platforms seem outdated or old-fashioned
SAP Lumira Discovery is top of its class
- Ad-hoc reports
- Easy to publish and share reports
- Great visualization
- More options for report customization
- More options for data sources
- Quicker refresh
- Connectivity to SAP data sources
- Easier Data Exploration for Business Users
- Publishing and export options
- License cost when considering the features offered.
- Connectivity of non-SAP data sources
- Advanced calculations/formulas
Easy Business Planning and Effective on Predictive Data Analytics Production SAP Package.
- Prediction data analytics generation capability is amazing.
- Useful business reports creation is quick and simple.
- High performance data integration capability is amazing.
- Just the first time on tools configuration.
- Reports for the different active business operations.
- Setting data analytics capabilities is not easy.
SAP Lumira - the new version is totally amazing for self-service BI and making the most out of your data!
- Data discovery and integration with applications.
- Ability to generate visual reports with meaningful business insights.
- Integration with Microsoft office.
- Integration with SAP Cloud platform and BI tools like Tableau.
- Amazing mobile interface with responsive UI experience.
- Ability to generate visual dashboards with charts and maps.
- The loading statuses and logs of integrated apps like SAP design studio - helps the users know which application is taking the time or blocked.
- Consistent formatting tabs for charts and other visual dashboard options.
- Bookmarking for which scripts have to be used still.
Great product
- User-interface.
- Searching.
- Strong visualization of data.
- Many sources are available.
- Teamwork improvement.
- Visualizations could be enhanced.
Lumira
- The software is good for charting data to present visualized information for current and upcoming ideas of business transactions and opportunities.
- Data sorting and charting for use with SAP and can be used by users to support data and visualize what is being highlighted.
- Value wise Lumira is a very simple and straightforward tool to use and is user friendly.
- There isn't a current way to publish information into the cloud.
- Limited data narrowing or crunching versus MS Office
SAP Lumira Software
- Easy to load data and use it. Sometimes we need technical help to create graphs but mostly it is easy once you learn.
- Support numerous kind of data source.
- Value for money.
- Need a proper training to use.
- Need to enhance integration with MS Excel.
- Limited functionality.
- Take large swaths of raw information and turn it into something approachable and relatable.
- Minimize the role of IT departments being necessary for tasks that are better left to account managers, project managers and marketers as well as business owners.
- While there is a cost involved, it is affordable and the return on investment is high.
- Even though the process of creating visualizations of data is now greatly improved, it could still be a lot better as users become accustomed to this kind of tool and bring forward edge cases the developers did not anticipate.
- It would be awesome to have a cross platform tool that works on more than just Windows.
- Some options for specific graphs feel limiting.
What really is valuable is the confidence you have when using the dashboards for decision making and monitoring the success of those decisions in a tailored manner.
SAP Lumira - Software to deal with large numbers
- Analytical Graphs with awesome calculations.
- Self Service Data Access, Data Visualisation and Handling easy
- Web/Mobile Support, Securely Sharing of data
- Heavy software, need a good quality of Laptop.
- Not a stable software.
SAP Lumira Still Not Ready for Primetime
- SAP has built in features you would expect from a data visualization package, like easy import from other SAP systems.
- SAP has most of the typical charts that you would expect in order to visualize your data.
- SAP allows you to have multiple charts on one visualization for your data.
- SAP is not as intuitive as other visualization software and you have to find an expert to show you how to do some of the simplest things.
- SAP is still working on the package so it is in constant change, and it makes 'learning' the software more difficult than it needs to be.
- SAP keeps renaming, re-merging, un-merging its systems so the 'Roadmap' they are so famous for is only valid for about 6 months!
- Data visualization is near to perfect
- One doesn't need to be a data expert to use this
- It has great Business Intelligence features
- The main problem we faced is that we couldn't use external plotting methods
- Customization of data charts takes a lot of time
- The inbuilt features are only good for non-technical persons
- Visualization
- alter data structures and correlations
- expanding the age reports involved in monthly reviews
- Should have Excel-like pivot table drill down features
- Integration with MS excel needs to enhance for importing data
- Output formats are bit rigid
- Limited functionality to manipulate data before reporting
SAP BOBJ Lumira Review
- Visualize data in a nice and professional way.
- Doesn't allow base templates to be used. Have to recreate each visualization.
Lumira is a great innovation from SAP
I have proposed the Lumira solution for business IT heads and data analysis consultants. In the process of rolling out Lumira we started with the treasury and risk management departments. It was a successful launch allowing SAP BW data, and non-SAP Data to be presented in a meaningful way, with graphical and geographical interactive dashboards. Lumira overcomes issues with the Tableau platform regarding Microsoft SQL and Oracle DB as the multi-sourced direct universe, and SAP BW as the BEx direct source. Even though there are some limitations, waiting for the Lumira 2.0 with design studio to fulfill everything under one roof as SAP BO and Lumira 2.0.
- Multiple Data sources enabled single tool
- Publishing availabilities on the web, and mobile devices
- Multiple components and canvases on single display
- Multiple graphical objects with drilling facilities on single display
- Improve the memory utilization with a new technique which is really an essential requirement
Limited Lumira review
- Quick transformation of data into tailored dashboard reports
- Easy access to SAP Cloud for customer data using the SAP add-on
- Very fast processing capability with no noticeable lag
- Control over data import formatting - for example where amount and currency values are imported there is not enough control over the transformation and formatting and this has caused us data import difficulties where values read have been truncated due to punctuation in the amount fields.
- The user interface is simplified, but the terminology and screen layout do not always make it obvious how to start the process for a new user - for example to add a new data source or create a new report.
SAP Lumira gets better with our opinion
- Prepare the data for exploration
- Receive multiple datasources even if isn't a SAP product
- Lumira is very intuitive
- The way that the user [can] export the results is very limited
- Use a more detailed map engine
- Add more examples, documentation and templates
Lumira - the next gen visualization!
- Eye catching easy to to use data visualizations.
- Support to merge heterogeneous data sources and prepare it according to requirements.
- Sharing the custom user stories in SAP BI/BO repository and give the end users flexibility to play around with it.
- Almost no coding required, still fantastic outcomes.
- Infographics can be made easier to use.
- Mobile and handheld device orientations and rendering could be improved.
- Time series sliders can be added which was there in dashboard designer.
Lumira Test Drive
- First, it is highly responsive and has a user-friendly interface, with a very rich and intuitive look and feel.
- It is easy to quickly get going and do rapid prototyping.
- Learning curve is not steep.
- It enforces best practices by "forcing" pre-aggregation in the back-end.
- It misses the ability to give developers options to dive into the "code-behind" and manipulate without leaving the environment. It could do with a WYSIWYG type of functionality.
- Stacked graphs need some enhancements with regards to displaying the data labels and the sum totals of each stack category.
- The major blockage I faced was failure to do calculations in the compose because of a lack of dimensions. It was a major blow for me.
Less-Good - implementing heavy customization and dynamic functionality; less dynamic features has less independence to the developer on what can be customized.
SAP Lumira - A Useful Tool for Graphical Analysis and Reporting
- First advantage is that you can install SQL Drivers and further connect SQL with Lumira. This will help to use SQL query in order to import data into Lumira Directly.
- Advance Graphs are readily available for user, which can be used easily with a handsome knowledge of Statistics.
- You can also create different visualization and altogether put them along with each other. This will be created as a Story in Lumira which becomes a Presentation for the user.
- SAP Lumira provides a stage to connect to your SQL database. Customers have frequently asked us a question that why SQL query already saved in SAP Product such SAP B1 is not available in Lumira to be selected. That means customer wants to link SQL saved queries of SAP B1 with Lumira, but not manually to be copied and paste.
- Also the queries created and used in Lumira don't get saved, not if the user wants to run the same query for another time period. He needs to again do manual copy paste and create the same story, but cannot update the saved one.
- Also users look for some pre-designed examples readily available with Lumira Installation for their own reference.
Good for large data sets, room for improvement on visualizatoins
- Customer support
- Customizable
- Variety of visualizations
- User interface (rather complex and at times, hard to follow)
- Sharing options - would love to be able to export visualizations to other formats besides PDF
- Data entry / editing within the program
Less appropriate: Visually-driven, highly customized infographics
Great Visualisations
- clear visualisations
- clear dashboard
- good integration
- can only create static visualisations
- new users need lots of help