Amazon CloudWatch is a native AWS monitoring tool for AWS programs. It provides data collection and resource monitoring capabilities.
$0
per canary run
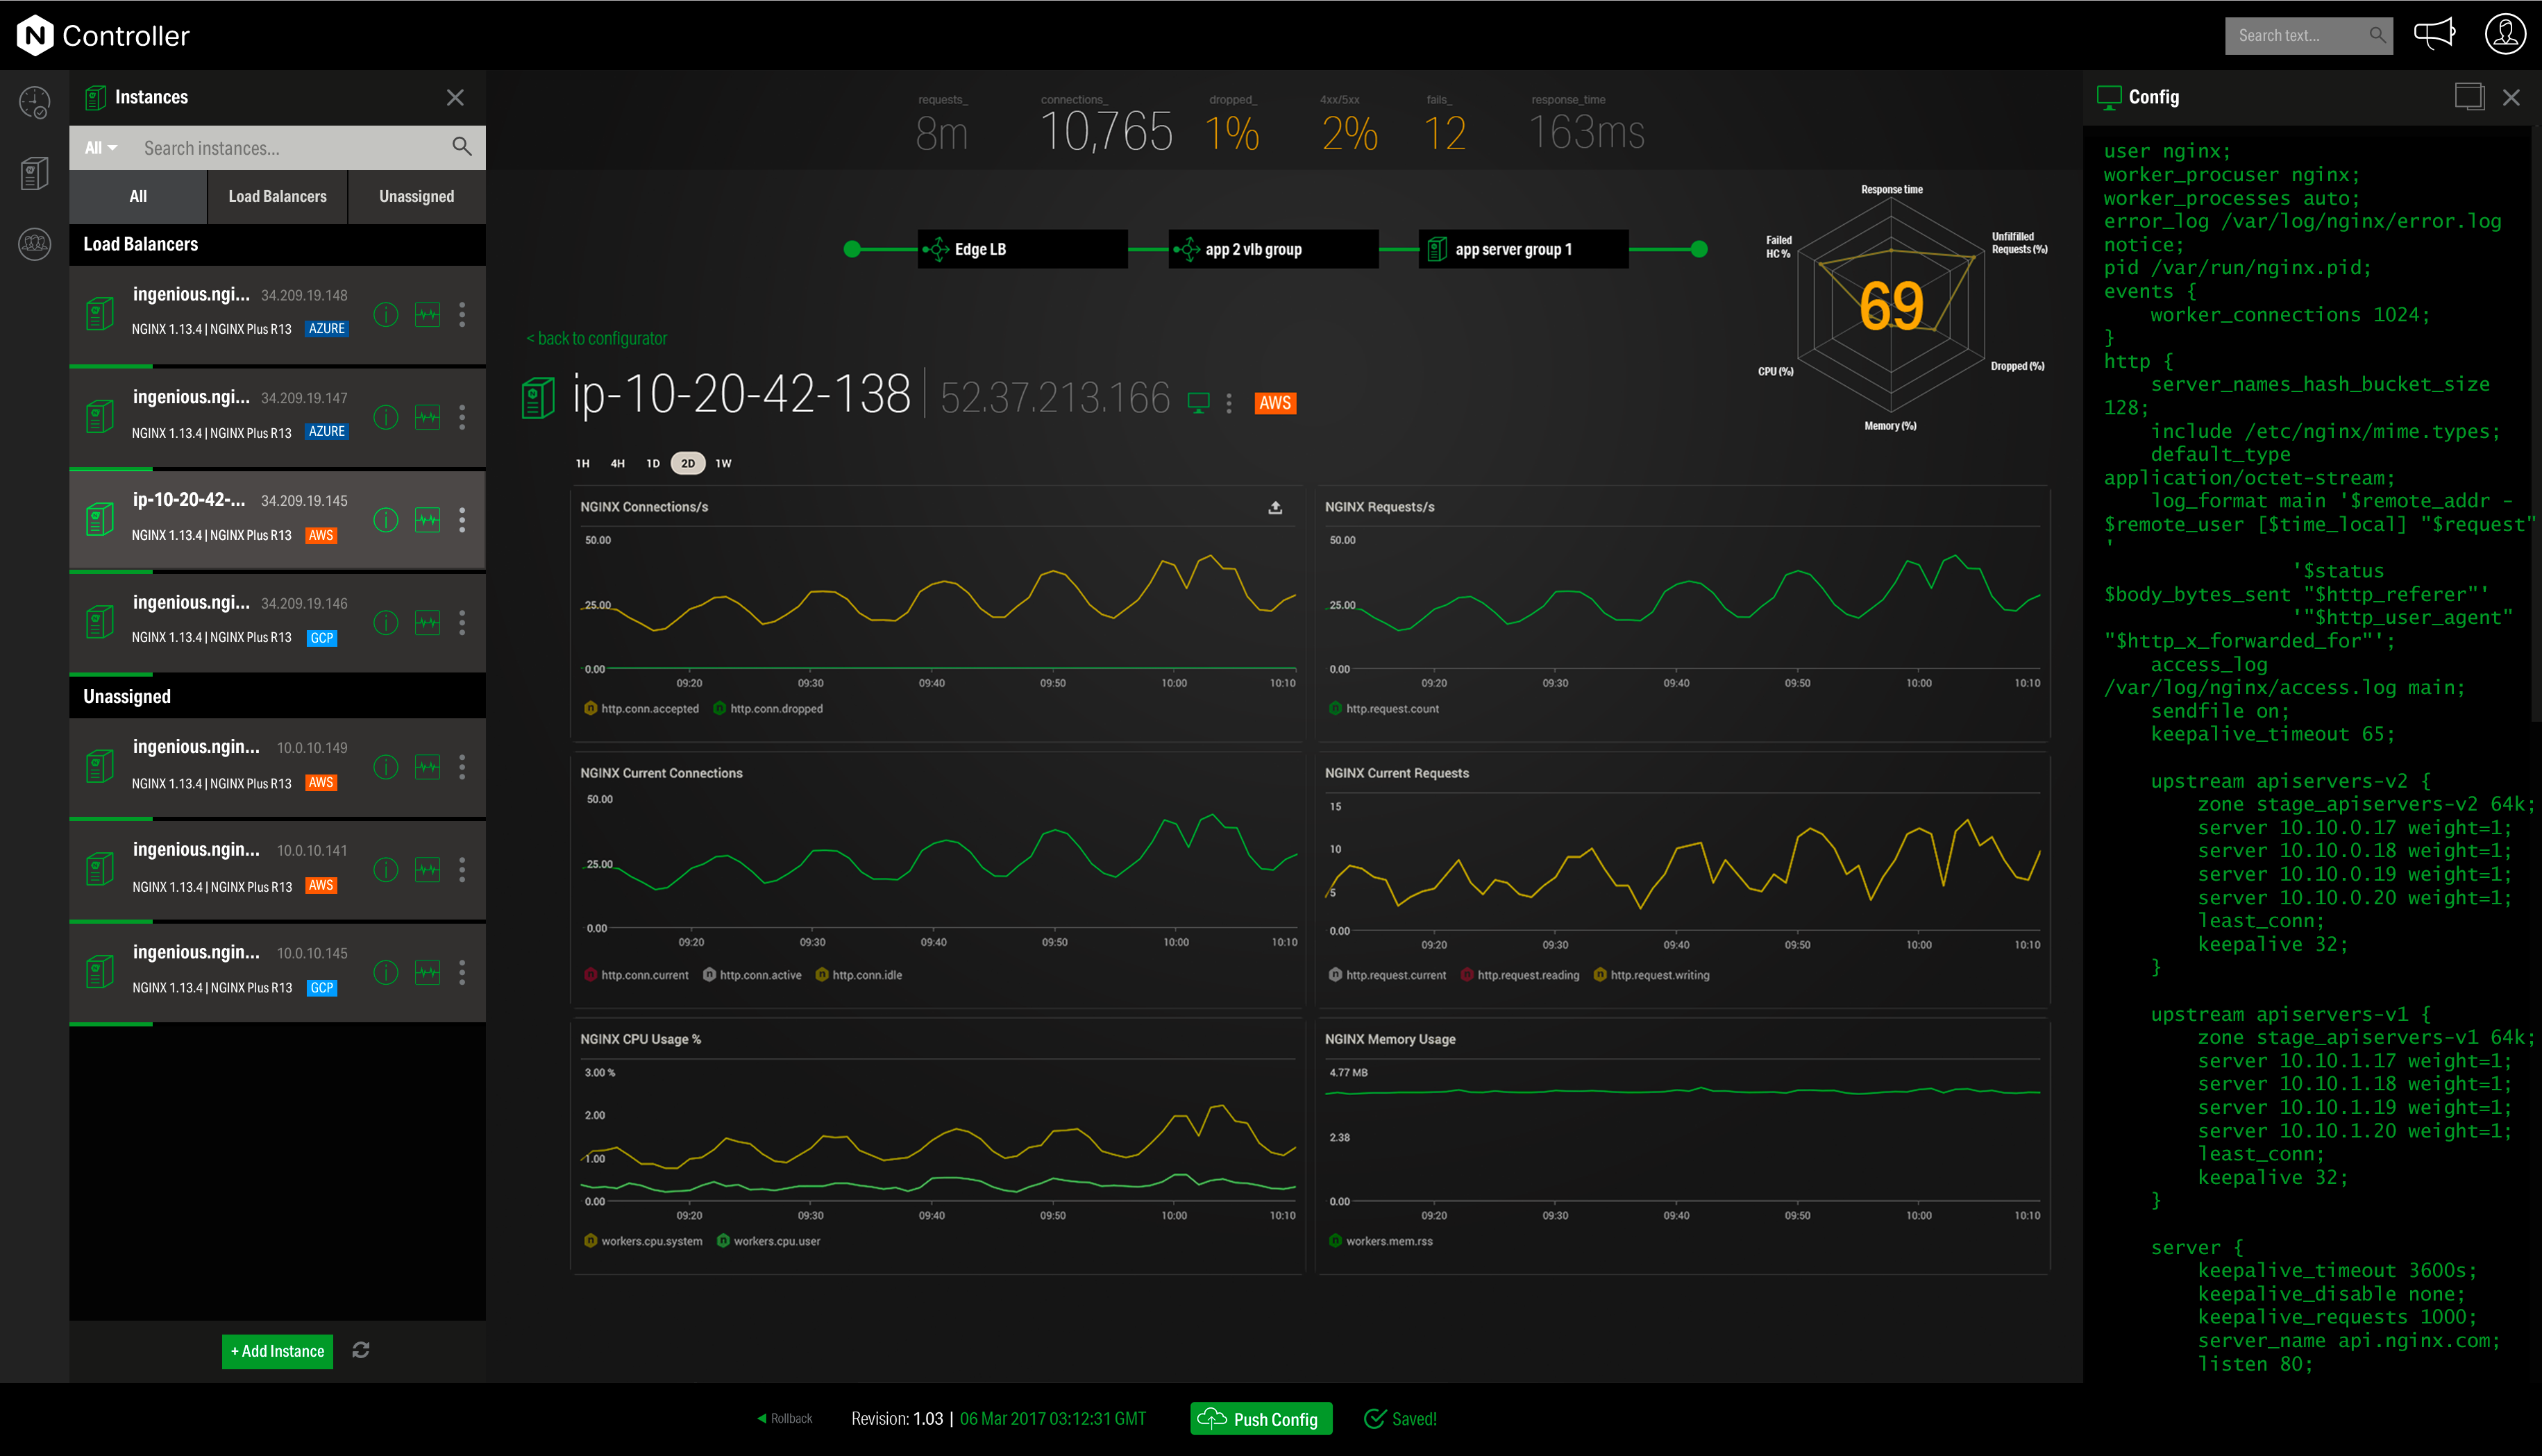
NGINX
Score 9.2 out of 10
Mid-Size Companies (51-1,000 employees)
NGINX, a business unit of F5 Networks, powers over 65% of the world's busiest websites and web applications. NGINX started out as an open source web server and reverse proxy, built to be faster and more efficient than Apache. Over the years, NGINX has built a suite of infrastructure software products o tackle some of the biggest challenges in managing high-transaction applications. NGINX offers a suite of products to form the core of what organizations need to create…
N/A
Pricing
Amazon CloudWatch
NGINX
Editions & Modules
Canaries
$0.0012
per canary run
Logs - Analyze (Logs Insights queries)
$0.005
per GB of data scanned
Over 1,000,000 Metrics
$0.02
per month
Contributor Insights - Matched Log Events
$0.02
per month per one million log events that match the rule
Logs - Store (Archival)
$0.03
per GB
Next 750,000 Metrics
$0.05
per month
Next 240,000 Metrics
$0.10
per month
Alarm - Standard Resolution (60 Sec)
$0.10
per month per alarm metric
First 10,000 Metrics
$0.30
per month
Alarm - High Resolution (10 Sec)
$0.30
per month per alarm metric
Alarm - Composite
$0.50
per month per alarm
Logs - Collect (Data Ingestion)
$0.50
per GB
Contributor Insights
$0.50
per month per rule
Events - Custom
$1.00
per million events
Events - Cross-account
$1.00
per million events
CloudWatch RUM
$1
per 100k events
Dashboard
$3.00
per month per dashboard
CloudWatch Evidently - Events
$5
per 1 million events
CloudWatch Evidently - Analysis Units
$7.50
per 1 million analysis units
No answers on this topic
Offerings
Pricing Offerings
Amazon CloudWatch
NGINX
Free Trial
Yes
Yes
Free/Freemium Version
Yes
Yes
Premium Consulting/Integration Services
Yes
Yes
Entry-level Setup Fee
No setup fee
Optional
Additional Details
With Amazon CloudWatch, there is no up-front commitment or minimum fee; you simply pay for what you use. You will be charged at the end of the month for your usage.
For out business we find that AWS Cloudwatch is good at providing real-time metrics for monitoring and analysing the performance and usage of our platform by customers. It is possible to create custom metrics from log events, such people adding items to a basket, checking out or abandoning their orders.
Nginx is well-suited for any web server scenarios, such as web applications, backend or reverse proxy for both application and HTTP requests, and distribution. It is less appropriate for Windows-based applications that run directly on a Windows Server host. In any case, it is very easy to manage, through separate conf files for each application or site you want to host with it.
It provides lot many out of the box dashboard to observe the health and usage of your cloud deployments. Few examples are CPU usage, Disk read/write, Network in/out etc.
It is possible to stream CloudWatch log data to Amazon Elasticsearch to process them almost real time.
If you have setup your code pipeline and wants to see the status, CloudWatch really helps. It can trigger lambda function when certain cloudWatch event happens and lambda can store the data to S3 or Athena which Quicksight can represent.
Memory metrics on EC2 are not available on CloudWatch. Depending on workloads if we need visibility on memory metrics we use Solarwinds Orion with the agent installed. For scalable workloads, this involves customization of images being used.
Visualization out of the box. But this can easily be addressed with other solutions such as Grafana.
By design, this is only used for AWS workloads so depending on your environment cannot be used as an all in one solution for your monitoring.
Customer support can be strangely condescending, perhaps it's a language issue?
I find it a little weird how the release versions used for Nginx+ aren't the same as for open source version. It can be very confusing to determine the cross-compatibility of modules, etc., because of this.
It seems like some (most?) modules on their own site are ancient and no longer supported, so their documentation in this area needs work.
It's difficult to navigate between nginx.com commercial site and customer support. They need to be integrated together.
I'd love to see more work done on nginx+ monitoring without requiring logging every request. I understand that many statistics can only be derived from logs, but plenty should work without that. Logging is not an option in many environments.
It's excellent at collecting logs. It's easy to set up. The viewing & querying part could be much better, though. The query syntax takes some time to get used to, & the examples are not helpful. Also, while being great, Log Insights requires manual picking of log streams to query across every time.
This tool is really easy to use and configure. Consumes very less system resources. It is highly modular and configurable. You can easily use it with other tools like certbot for SSLs. You can configure basic security with configuration and headers
Support is effective, and we were able to get any problems that we couldn't get solved through community discussion forums solved for us by the AWS support team. For example, we were assisted in one instance where we were not sure about the best metrics to use in order to optimize an auto-scaling group on EC2. The support team was able to look at our metrics and give a useful recommendation on which metrics to use.
Community support is great, and they've also had a presence at conferences. Overall, there is no shortage of documentation and community support. We're currently using it to serve up some WordPress sites, and configuring NGINX for this purpose is well documented.
Grafana is definitely a lot better and flexible in comparison with Amazon CloudWatch for visualisation, as it offers much more options and is versatile. VictoriaMetrics and Prometheus are time-series databases which can do almost everything cloudwatch can do in a better and cheaper way. Integrating Grafana with them will make it more capable Elasticsearch for log retention and querying will surpass cloudwatch log monitoring in both performance and speed
I have found that [NGINX] seems to perform better throughout the years with less issues although I've used Apache more. I would definitely recommend [NGINX] for any high volume site and I've seen this to usually be the case from most provided web hosts who will pick [NGINX] over alternatives
By using Nginx, we can host multiple web services on a single server, keeping our infrastructure costs lower.
Nginx maintains our HTTPS connections, allowing us to keep our promise to our customers that their data is safe in transit.
Due to Nginx's extremely low failure rate, our web addresses always return something meaningful, even when individual services go down. In sense, this means we are "always online" and allows us to maintain brand and support our customers even in the face of catastrophe.