Cisco Nexus Dashboard simplifies data-center networks with automation and analytics. The data-center network helps organizations to meet business demands, and provision reliable data-center networking services as fast as possible, when and where organizations need it. As network infrastructure management is becoming more complex, diverse, and distributed, with multiple configuration points, monitoring tools, and vast amounts of data being generated every second. Cisco Nexus Dashboard is…
N/A
Grafana
Score 8.6 out of 10
N/A
Grafana is a data visualization tool developed by Grafana Labs in New York. It is available open source, managed (Grafana Cloud), or via an enterprise edition with enhanced features. Grafana has pluggable data source model and comes bundled with support for popular time series databases like Graphite. It also has built-in support for cloud monitoring vendors like Amazon Cloudwatch, Microsoft Azure and SQL databases like MySQL. Grafana can combine data from many places into a single dashboard.
$0
Pricing
Cisco Nexus Dashboard
Grafana
Editions & Modules
No answers on this topic
Grafana Cloud - Pro
$8
per month up to 1 active user
Grafana Cloud - Free
Free
10k metrics + 50GB logs + 50GB traces up to 3 active users
Nexus Dashboard is a vital tool for Cisco data center Nexus deployments, in my opinion. By utilizing multiple applications in the suite, a business can utilize orchestration, monitor services and traffic, test deployment scenarios, verify upgrade processes and readiness, etc. The capabilities of the system can allow for SAN MDS controls, traditional Nexus NXOS integration, and/or essential ACI tools
Just about any organization with more than one server and more than one cluster as it scales very well. Configuration of the application takes time and finesse to fine tune to where the balance of load time and getting data quickly meets. The plugins add load time but fine tuning for the application to meet demand needs nailed down at implementation
With the latest version release of Cisco Nexus Dashboard to version 3.0.1 I can say that most of the features have already improved but one of the wishlists that I want for ND is the possibility of extracting lists of Anomaly.
Include older versions of Firmware in the list of choices when doing the firmware upgrade analysis, currently only the recommended is in the list of choices.
If possible, include all the prechecks in the Firmware pre-upgrade analysis same in the script provided by Cisco.
We observe significant product development with each release, along with substantial expansion of functionality. The program code has been consolidated into a single image, which simplifies installation and routine system update operations. Additionally, it is possible to install it outside the production network, which further enhances the solution’s availability.Additionally, the new graphical interface is very simplified and user-friendly.
For the end user, it is relatively easy to use. However, some training and practice is a must because the NSO is not as straightforward as the traditional router CLI. For the administrator, Cisco Network Service Orchestrator (NSO) is just like another program running on the Linux system--there is no big difference.
It is infinitely flexible. If you can imagine it, Grafana can almost certainly do it. Usability may be in the eye of the beholder however, as there is time needed to curate the experience and get the dashboards customized to how it makes sense to you. I know one thing they are working on are more templates, based on data sources
Great and effective automation functionalities and the tools on network security management are the best and easy data reports building. Cisco Nexus Dashboard Fabric Controller feature for the network monitoring and easy management of various services and even offers the best analytics and also powerful integration tools for easy data migration.
here was never a need to contact support, as the system includes several commands that allow for self-healing. Even if, after the upgrade process, one of the processes was not running, I was able to quickly find the appropriate sequence of commands that definitively resolved the issue. The entire architecture was designed in such a way as to be resilient to the failure of one node in a three-server setup.
Honestly, the product implementation took 1–2 days to comprehensively manage the client’s entire infrastructure. The delivered on-premise solution, provided as physical servers, quickly builds the required environment in which individual data centers are rapidly added. The data collection process takes some time but also depends on the number of devices in the network.
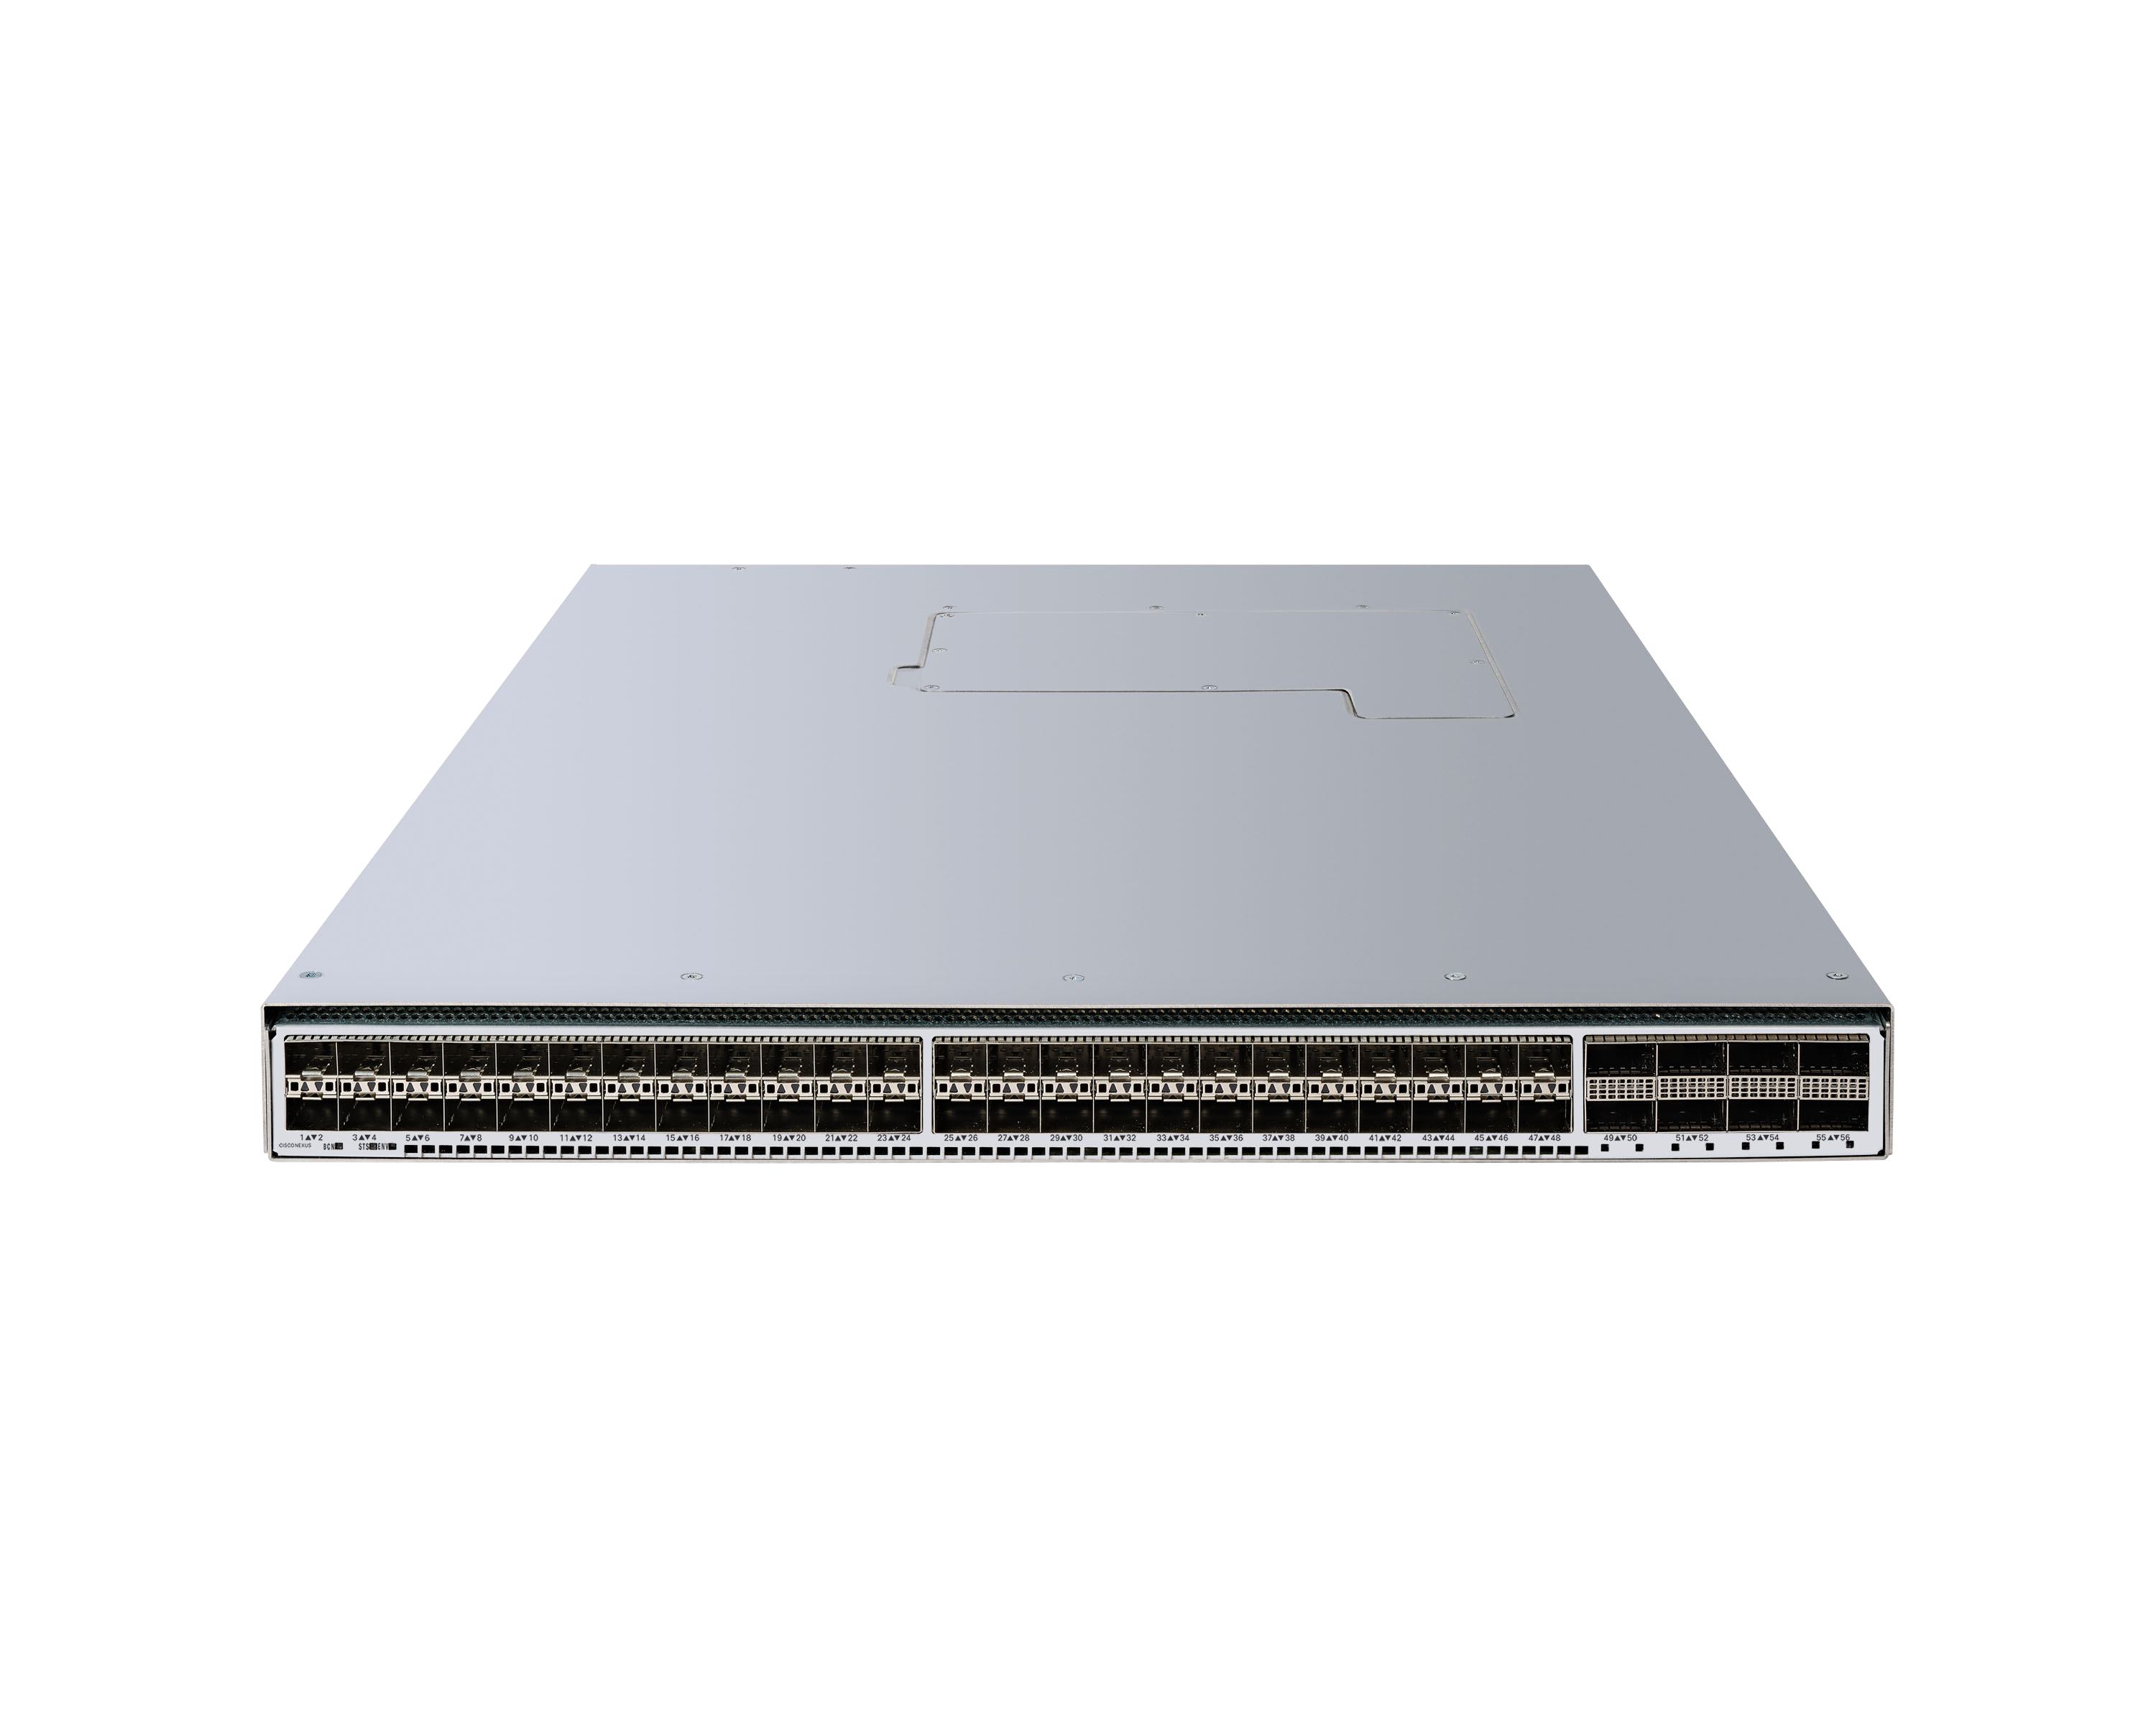
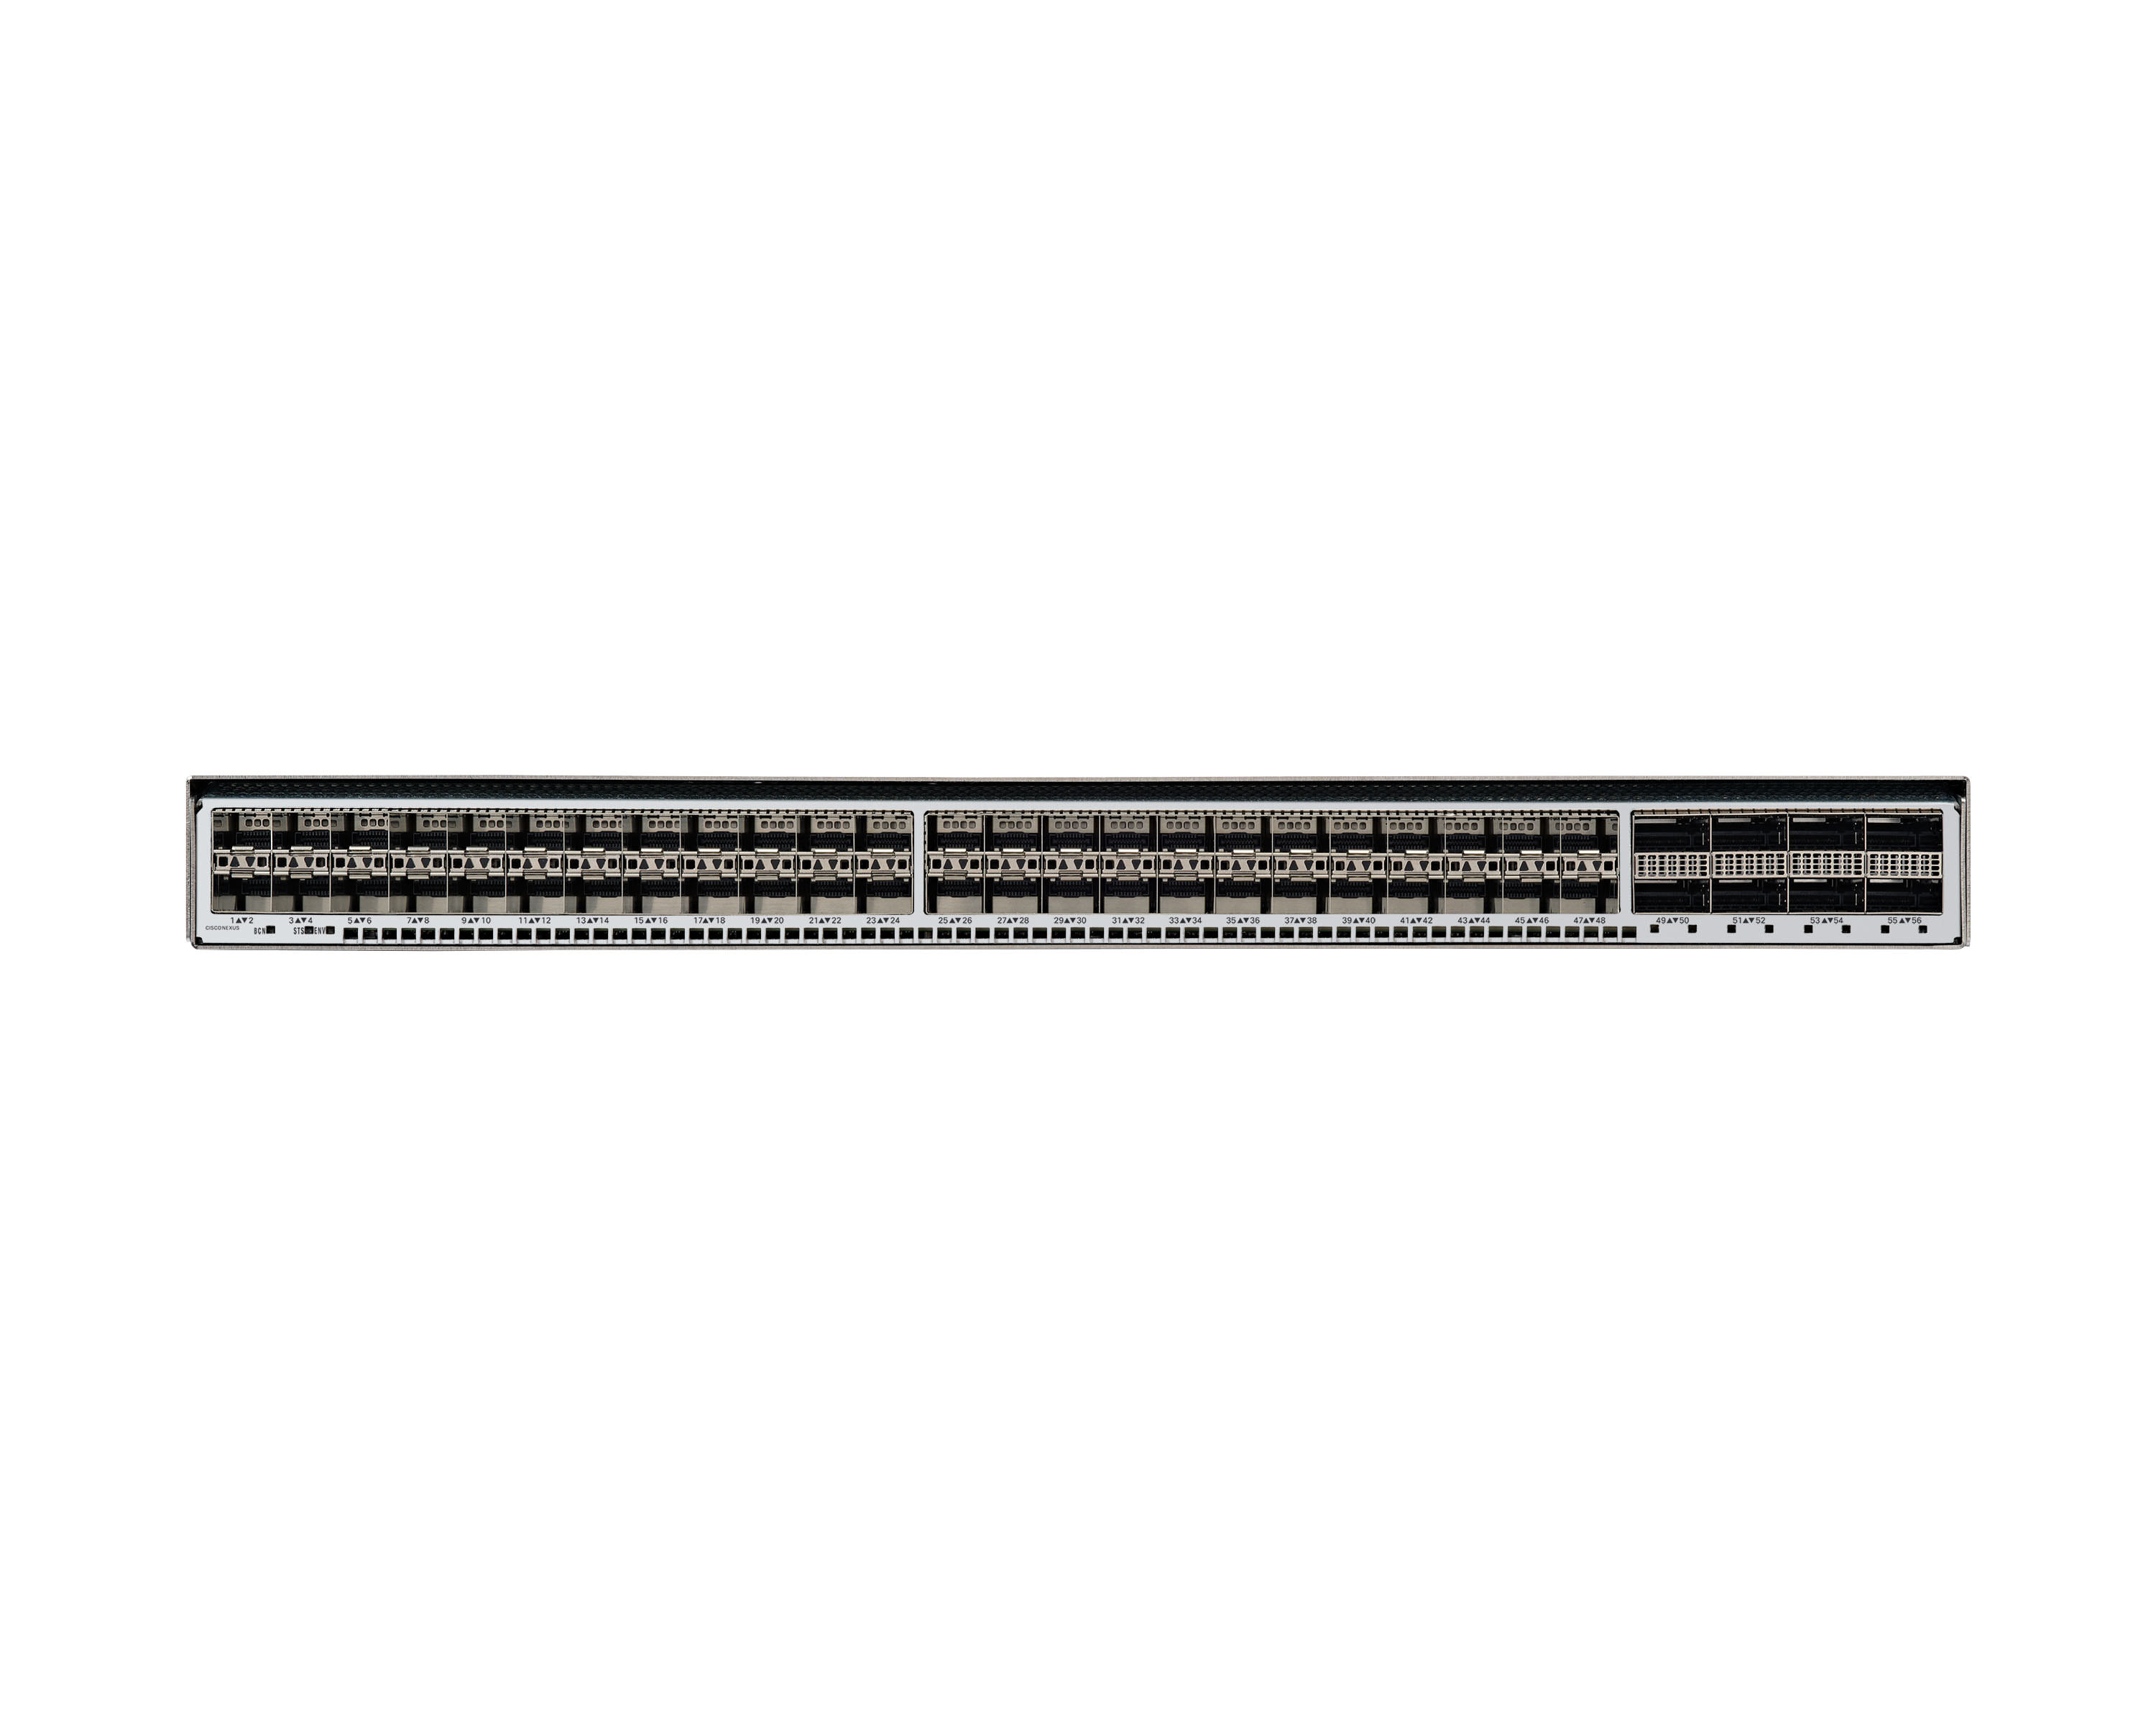
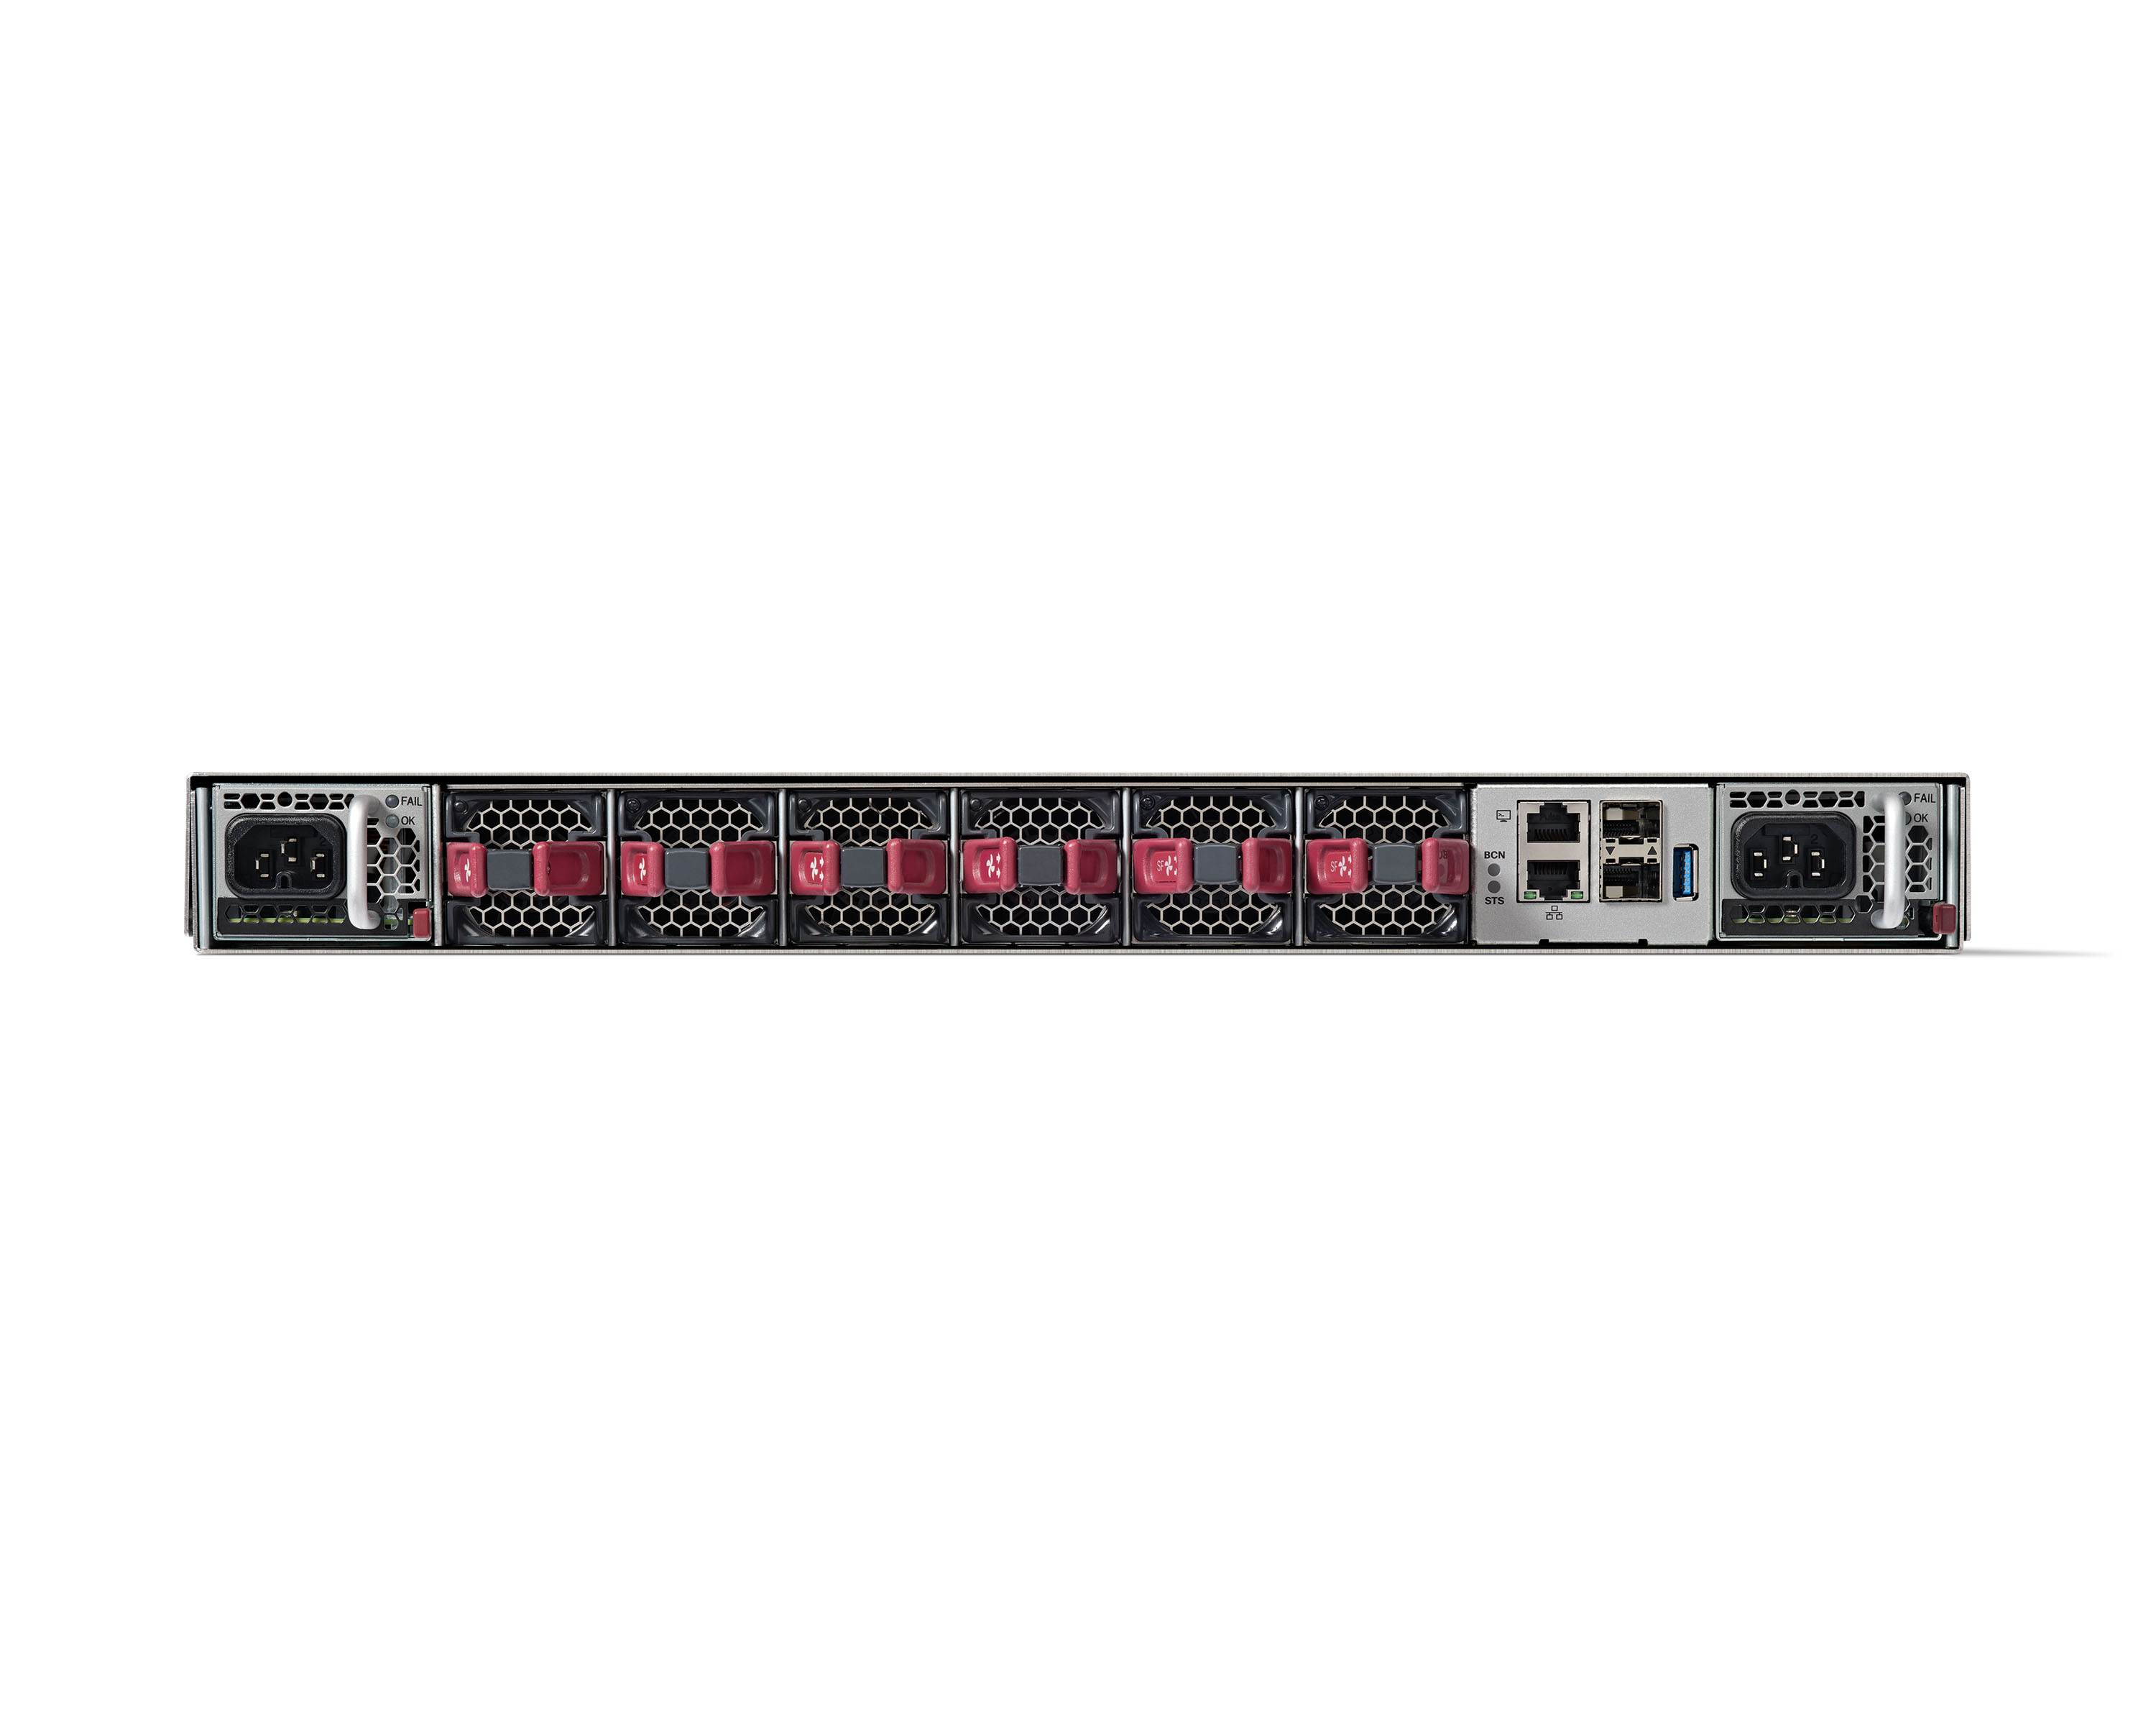
The Cisco Nexus Series switches perform admirably in our blended distributed system. We have been dealing with any of these sorts of switches for over 5 years and have been exceptionally happy with their functionality. Several of our other computer networks in our data rooms have proved effective with Cisco equipment. Because of the simplicity of maintenance and the high quality of technical support provided by Cisco representatives, there is a high level of trust in these switches.
Grafana blows Nagios out of the water when it comes to customization. The ability to feed almost any data source makes it very versatile and the cost is great.
The platform is very well done, and to date, I have had no complaints about the implementation of the platform and no security issues or vulnerabilities. Cisco in all its product releases new versions to resolve security issues or bugs that appear on the platform, this is a big plus.