
COZYROC vs. Flexmonster Pivot Table & Charts Component
| Product | Rating | Most Used By | Product Summary | Starting Price |
|---|---|---|---|---|
 COZYROC | Score2.1 out of 10 | N/A | COZYROC SSIS+ is a suite of 240+ advanced components for developing ETL solutions with Microsoft SQL Server Integration Services. The vendor states that COZYROC is an easy-to-use, code-free library of tasks, components and reusable scripts that aim to significantly cut development time and improve the execution speed of SSIS packages. They further provide that COZYROC SSIS+ Components Suite has been successfully used by thousands of businesses in more than 140 countries around the… | $199.95 per year |
 Flexmonster Pivot Table & Charts Component | Score10 out of 10 | Mid-Size Companies (51-1,000 employees) | Flexmonster Pivot Table & Charts is a component for interactive pivot reports that can be inserted into a web page or a web application. It’s a JavaScript tool that enables a user to visualize their business data. This solution supports Microsoft Analysis Services OLAP cubes, Mondrian, icCube, JSON, SQL (MS SQL, MySQL and others) databases or static JSON or CSV files. According to the vendor, this solution allows users to work extremely quickly with really large data… | $0 Annual SaaS Subscription |
| COZYROC | Flexmonster Pivot Table & Charts Component | |||||||||||||||
|---|---|---|---|---|---|---|---|---|---|---|---|---|---|---|---|---|
| Editions & Modules |
|
| ||||||||||||||
| Offerings |
| |||||||||||||||
| Entry-level Setup Fee | No setup fee | No setup fee | ||||||||||||||
| Additional Details | COZYROC SSIS+ Ultimate Subscription - $999 /per year 2 license keys (for two servers) * Free upgrades to newer versions * Free to use in Visual Studio * Premium support (Priority over regular free support. Guaranteed one business day response time.) | — | ||||||||||||||
| More Pricing Information | ||||||||||||||||
| COZYROC | Flexmonster Pivot Table & Charts Component | |
|---|---|---|
| Considered Both Products | No answer on this topic | No answer on this topic |
| Key User Insights | ||
| Would buy again | ||
89% Would buy again 8 Answers | No answers on this topic | |
| Delivers good value for the price | ||
89% Delivers good value for the price 8 Answers | No answers on this topic | |
| Happy with the feature set | ||
89% Happy with the feature set 8 Answers | No answers on this topic | |
| Lived up to sales and marketing promises | ||
86% Lived up to sales and marketing promises 6 Answers | No answers on this topic | |
| Implementation went as expected | ||
78% Implementation went as expected 7 Answers | No answers on this topic | |
| COZYROC | Flexmonster Pivot Table & Charts Component | |||||||||||||
|---|---|---|---|---|---|---|---|---|---|---|---|---|---|---|
| Data Source Connection |
| |||||||||||||
| Data Transformations |
| |||||||||||||
| Data Modeling |
| |||||||||||||
| BI Standard Reporting |
| |||||||||||||
| Ad-hoc Reporting |
| |||||||||||||
| Report Output and Scheduling |
| |||||||||||||
| Mobile Capabilities |
| |||||||||||||
| COZYROC | Flexmonster Pivot Table & Charts Component | |
|---|---|---|
| Small Businesses |  Skyvia Score10 out of 10 |  Cyfe Score4 out of 10 |
| Medium-sized Companies |  IBM InfoSphere Information Server Score10 out of 10 |  Qlik Cloud Analytics (Qlik Sense) Score8.1 out of 10 |
| Enterprises |  SolarWinds Task Factory Score8.3 out of 10 |  Sisense Score6.9 out of 10 |
| All Alternatives | View all alternatives | View all alternatives |
| COZYROC | Flexmonster Pivot Table & Charts Component | |
|---|---|---|
| Likelihood to Recommend | 1.8 | 10.0 |
| Usability | 8.2 | 9.0 |
| Support Rating | 9.0 | 10.0 |
| COZYROC | Flexmonster Pivot Table & Charts Component | |
|---|---|---|
| Likelihood to Recommend |
|
|
| Pros |
| No answers on this topic |
| Cons |
| No answers on this topic |
| Usability |
|
|
| Support Rating |
|
|
| Alternatives Considered |
| No answers on this topic |
| Return on Investment |
| No answers on this topic |
| ScreenShots | COZYROC Screenshots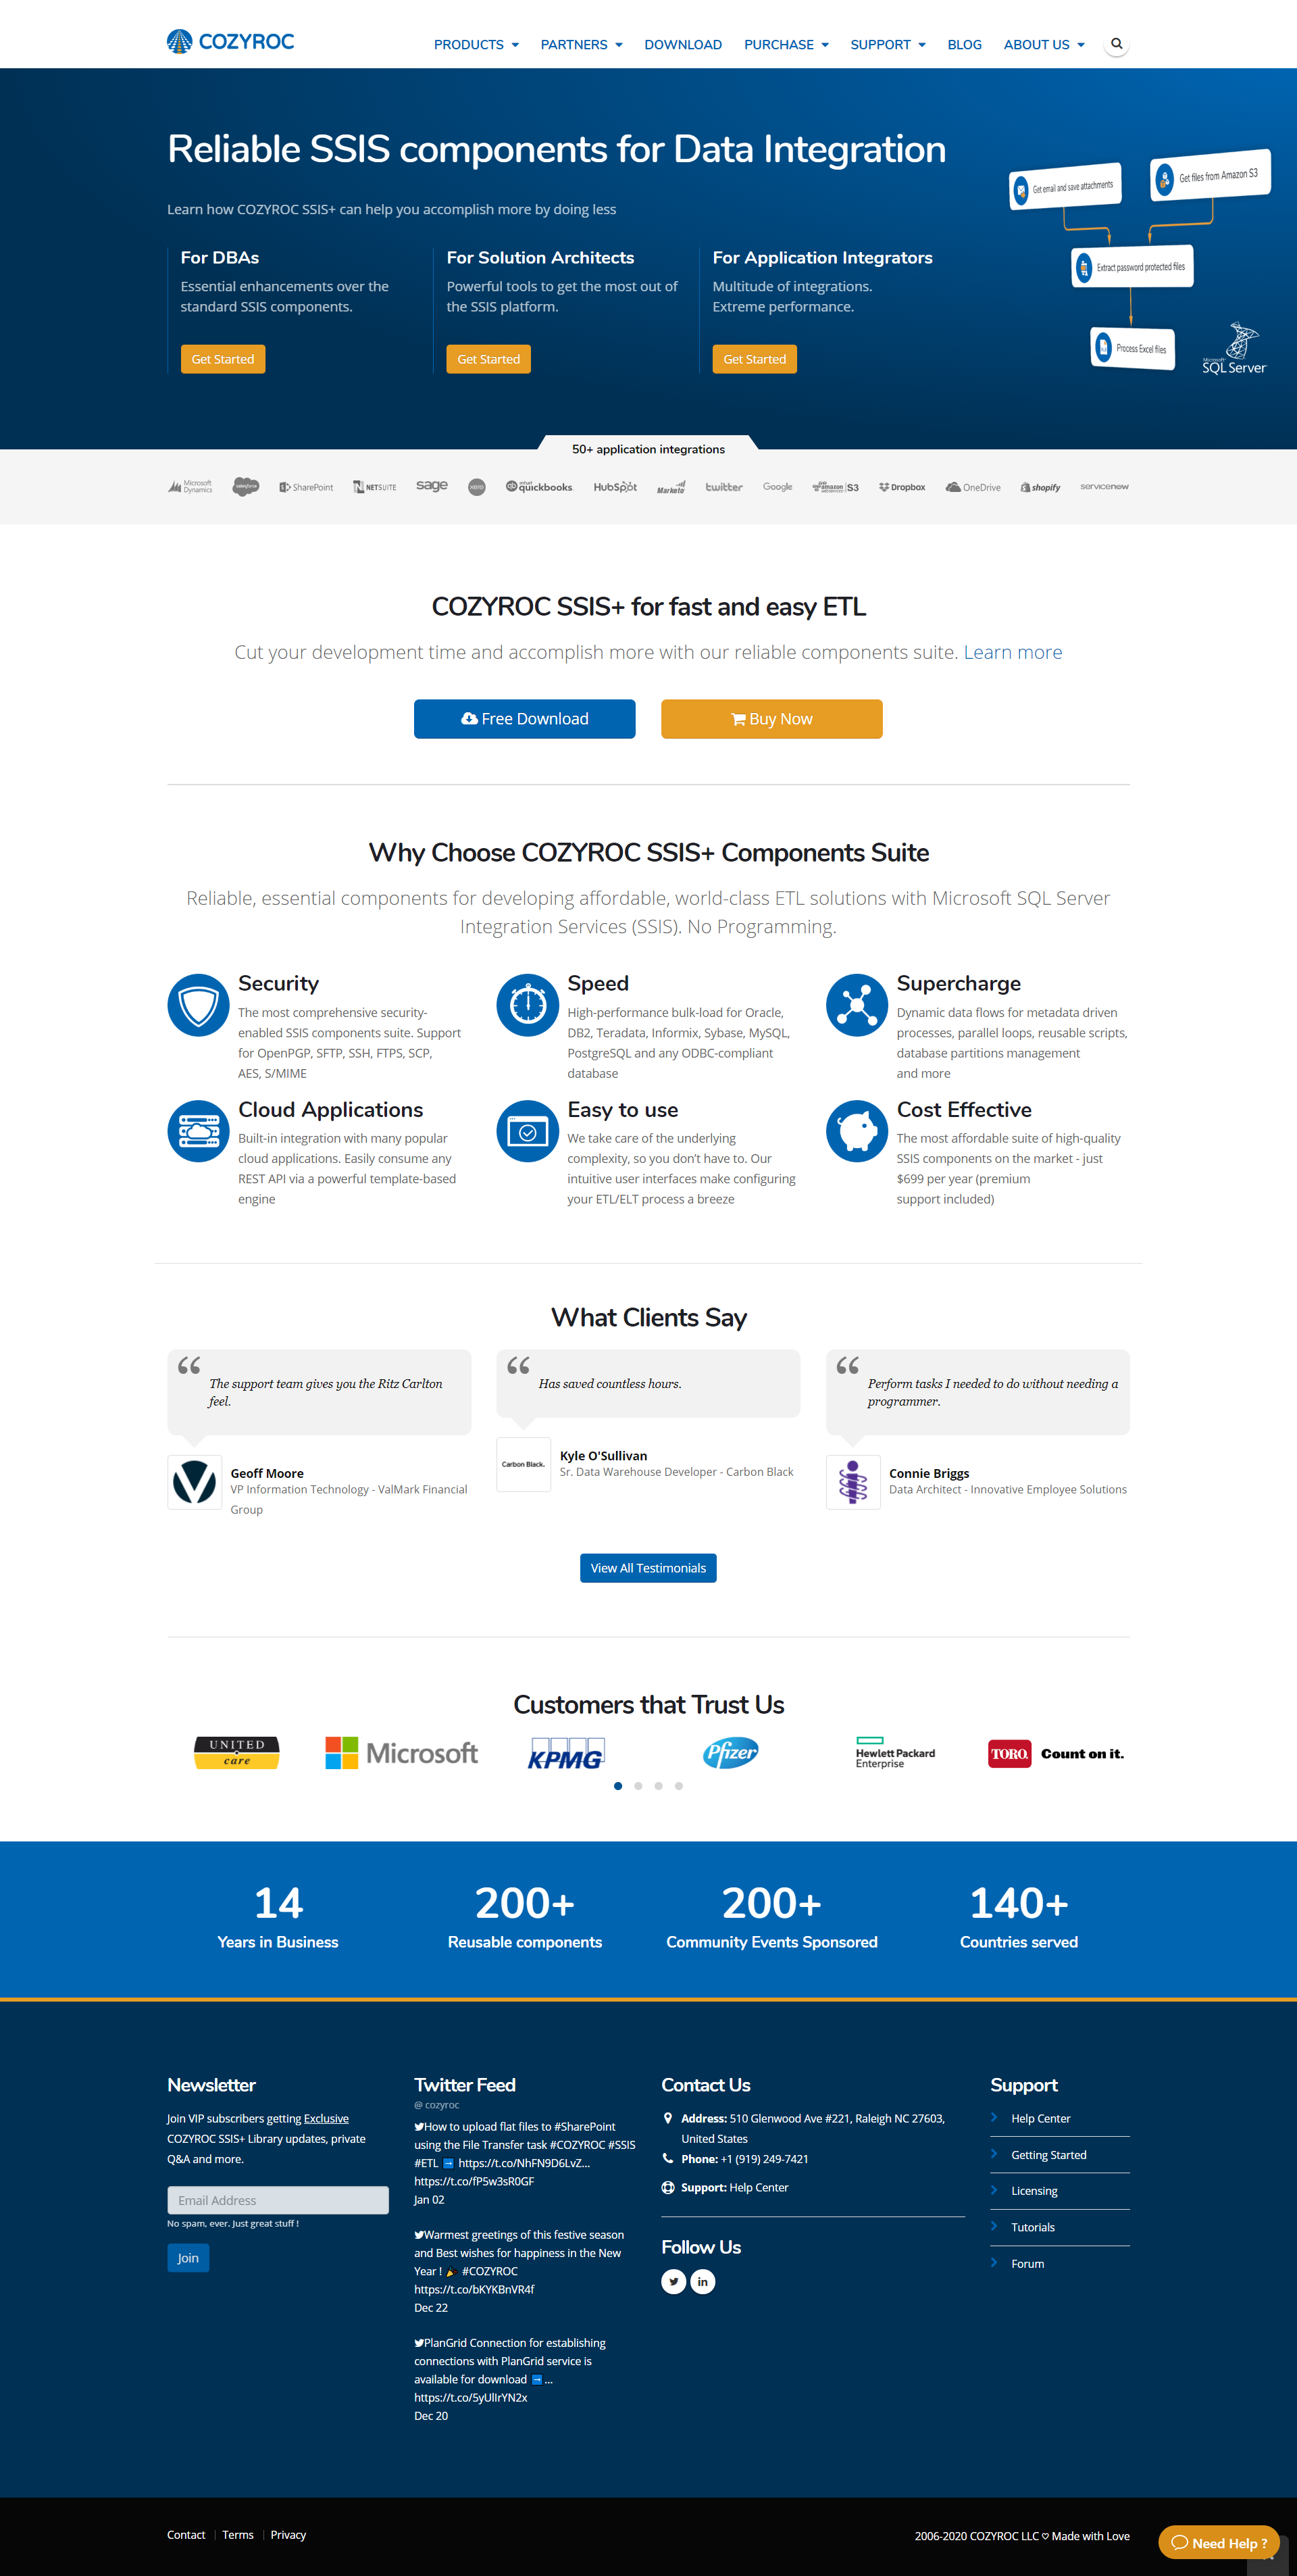  | Flexmonster Pivot Table & Charts Component Screenshots  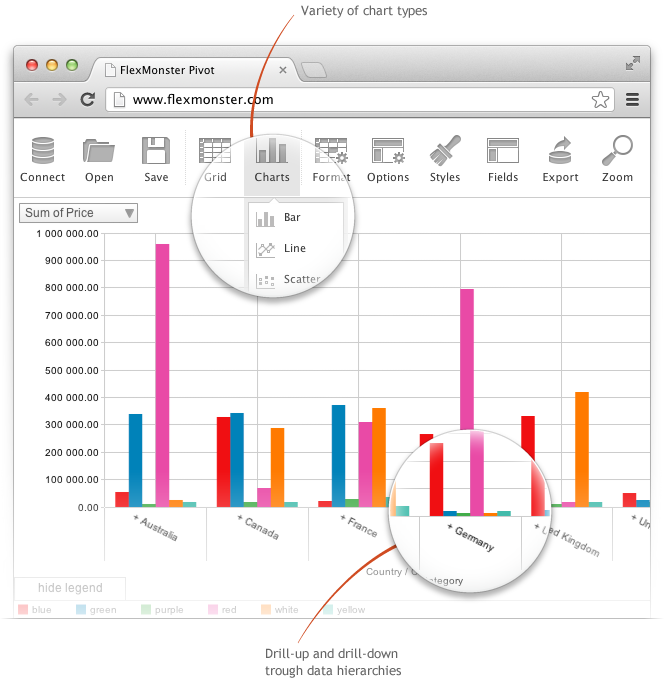 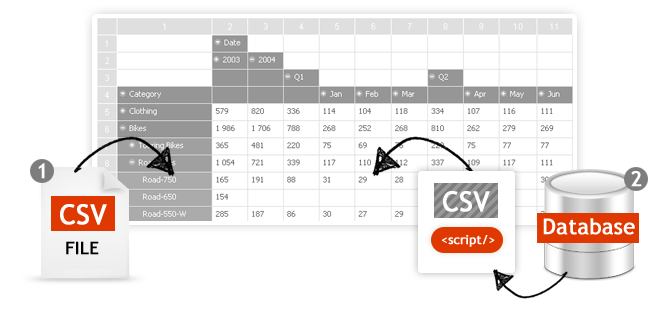  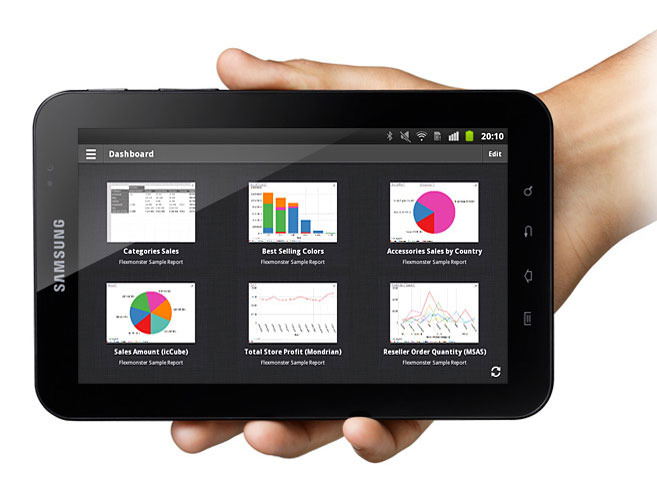 |

