The DataRobot AI Platform is presented as a solution that accelerates and democratizes data science by automating the end-to-end journey from data to value and allows users to deploy AI applications at scale. DataRobot provides a centrally governed platform that gives users AI to drive business outcomes, that is available on the user's cloud platform-of-choice, on-premise, or as a fully-managed service. The solutions include tools providing data preparation enabling users to explore and…
$0
IBM SPSS Statistics
Score 8.5 out of 10
N/A
SPSS Statistics is a software package used for statistical analysis. It is now officially named "IBM SPSS Statistics". Companion products in the same family are used for survey authoring and deployment (IBM SPSS Data Collection), data mining (IBM SPSS Modeler), text analytics, and collaboration and deployment (batch and automated scoring services).
DataRobot outperforms SPSS in terms of speed and efficiency. While I continue to rely on SPSS for tasks like data cleanup and data engineering, I have noticed that DataRobot significantly excels when it comes to building models. Its speed and user-friendly interface make it the …
DataRobot is the product that seemed to have the most professional platform all in all. It was also the best one for the second part of the model development, which is monitoring what the model is doing in production and governing what that model was doing, giving us the …
Overall, IBM SSPS outperforms competitors in almost every arena. It's ability to both perform statistical analysis and geospatial analysis is unrivaled. Additionally, it is superior in handling large or complex datasets over many of the other similar programs. The only program …
Data Robot is a powerful tool for greatly reducing the time required to build powerful and accurate machine learning models. It then allows you to utilize these items. It is probably most appropriate for organisations looking to get into data science and incorporate Machine learning and AI into their decision making. Having dedicated resources that can be upskilled is perfect, as the expertise and software provided allows for a big jump from willing to able. For the to work effectively, organisations should really consider dedicating at least one resource to the ML and AI projects, and understsand that not every project will yield fruit. A lot of this is innovation and experimentation, so relying on data Robots insights in make or break situations is not recommended. You also need to manage expectations well as the data you have may simply not allow for a powerful model. Finally, the organisation must be open to change, this has to exist in tandem with the above. If the organisation's key stakeholders don't want to change, all the insights in the world won't help. So a willingness and ability to change effectively is required to maximize ROI.
SPSS is well-suited for the following: 1) User Behavior Analysis: SPSS handles large datasets to analyze user behavior data. 2) Customer Satisfaction / Foundational Surveys: SPSS facilitates analysis of quant data from satisfaction surveys, keeping us informed about customer needs and preferences. 3) A/B test analysis: SPSS statistical tools for A/B test analysis, which helps optimize user experience of our products. Scenarios where SPSS are less appropriate: 1) Qualitative Data Analysis: I do not use SPSS for open-ended survey responses/qual data. 2) Live/in-vivo data analysis: SPSS is not ideal for real-time data processing. 3) Complex Data Integration: SPSS isn’t the best fit for complex data integration tasks
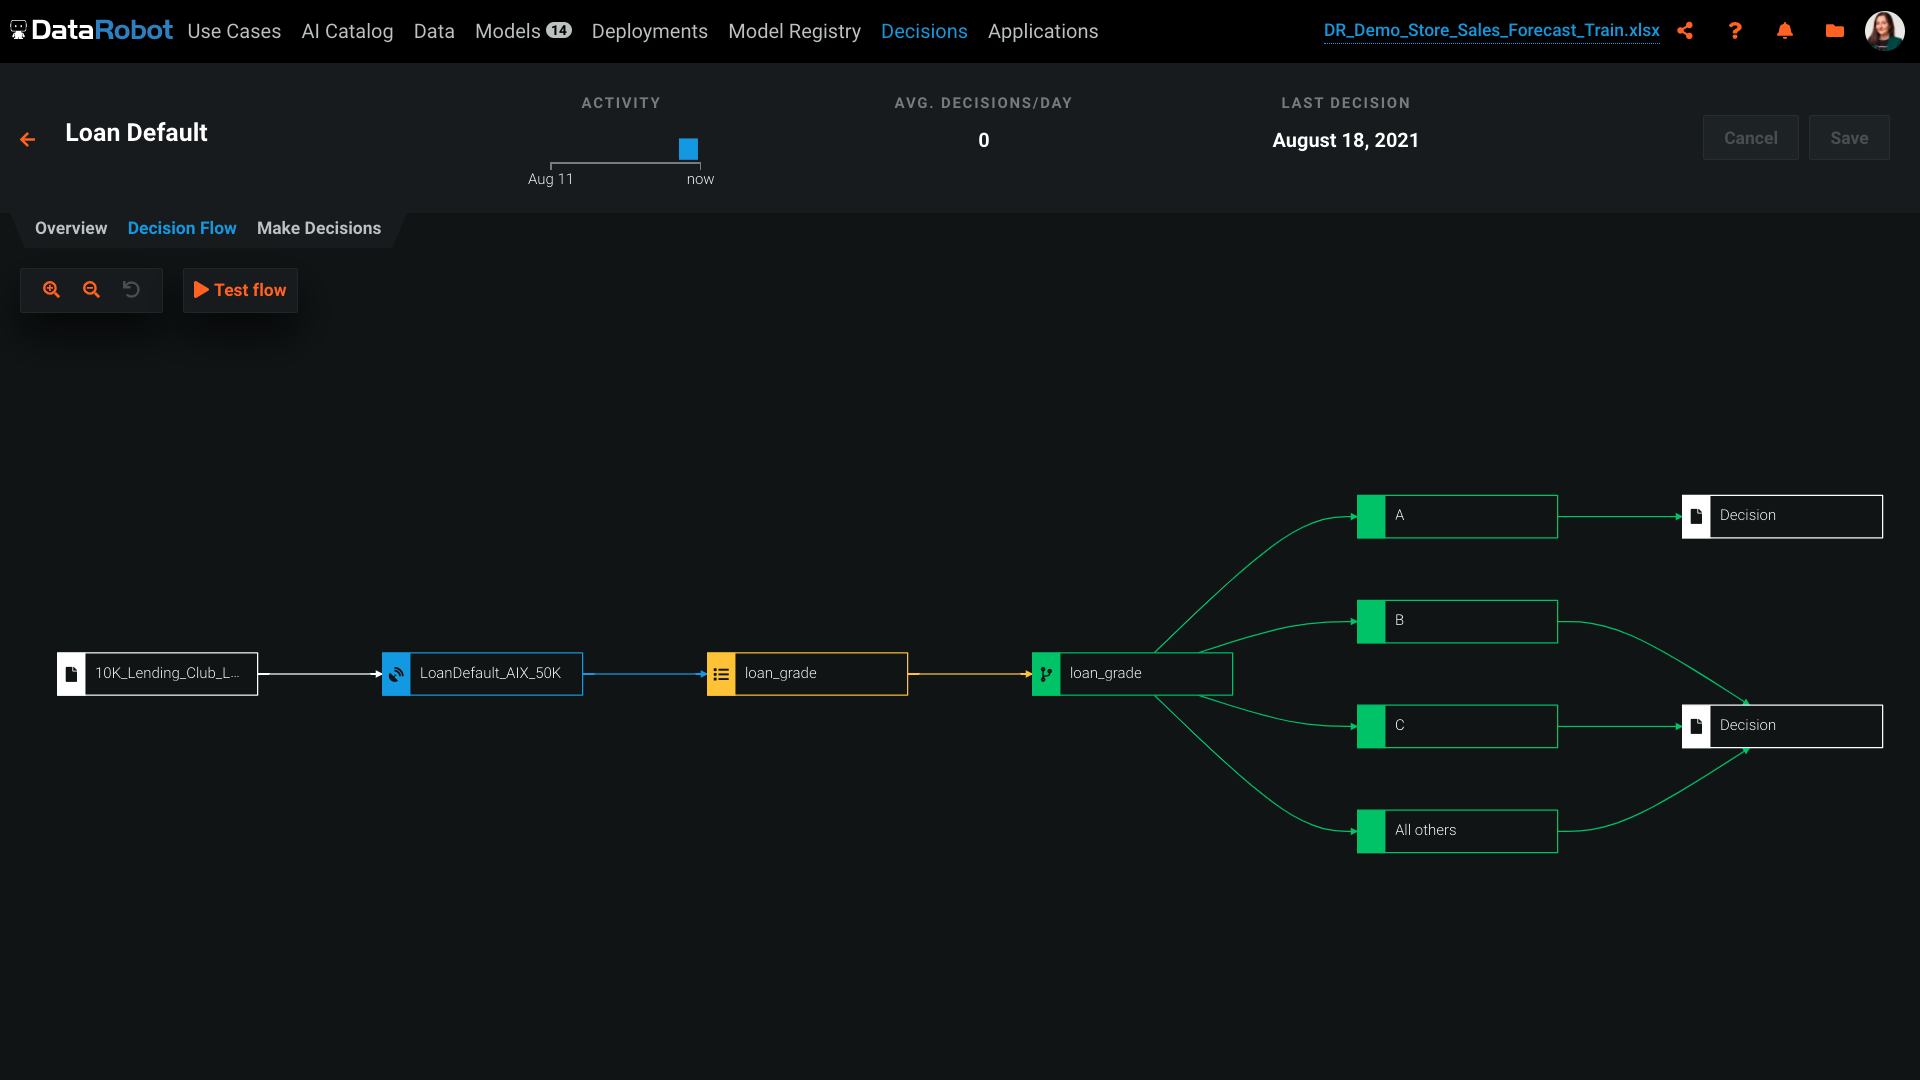
DataRobot helps, with algorithms, to analyze and decipher numerous machine-learning techniques in order to provide models to assist in company-wide decision making.
Our DataRobot program puts on an "even playing field" the strength of auto-machine learning and allows us to make decisions in an extremely timely manner. The speed is consistent without being offset by errors or false-negatives.
It encompasses many desired techniques that help companies in general, to reconfigure in to artificial intelligence driven firms, with little to no inconvenience.
SPSS has been around for quite a while and has amassed a large suite of functionality. One of its longest-running features is the ability to automate SPSS via scripting, AKA "syntax." There is a very large community of practice on the internet who can help newbies to quickly scale up their automation abilities with SPSS. And SPSS allows users to save syntax scripting directly from GUI wizards and configuration windows, which can be a real life-saver if one is not an experienced coder.
Many statistics package users are doing scientific research with an eye to publish reproducible results. SPSS allows you to save datasets and syntax scripting in a common format, facilitating attempts by peer reviewers and other researchers to quickly and easily attempt to reproduce your results. It's very portable!
SPSS has both legacy and modern visualization suites baked into the base software, giving users an easily mountable learning curve when it comes to outputting charts and graphs. It's very easy to start with a canned look and feel of an exported chart, and then you can tweak a saved copy to change just about everything, from colors, legends, and axis scaling, to orientation, labels, and grid lines. And when you've got a chart or graph set up the way you like, you can export it as an image file, or create a template syntax to apply to new visualizations going forward.
SPSS makes it easy for even beginner-level users to create statistical coding fields to support multidimensional analysis, ensuring that you never need to destructively modify your dataset.
In closing, SPSS's long and successful tenure ensures that just about any question a new user may have about it can be answered with a modicum of Google-fu. There are even several fully-fledged tutorial websites out there for newbie perusal.
The platform itself is very complicated. It probably can't function well without being complicated, but there is a big training curve to get over before you can effectively use it. Even I'm not sure if I'm effectively using it now.
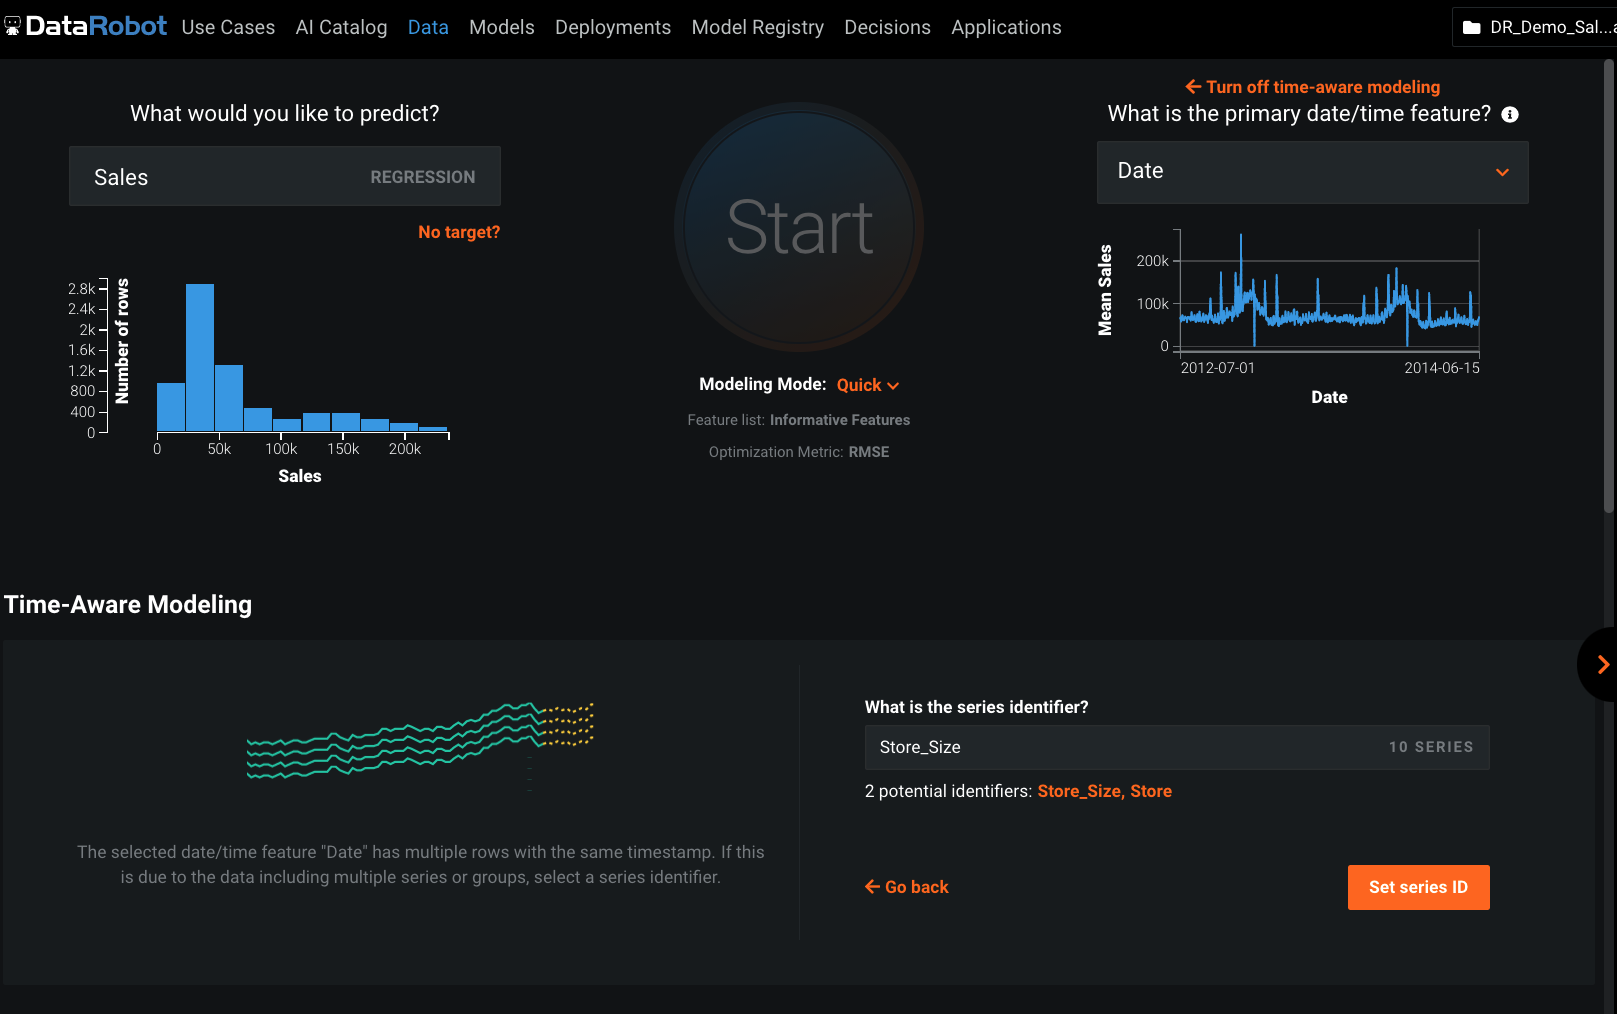
The suggested model DataRobot deploys often not the best model for our purposes. We've had to do a lot of testing to make sure what model is the best. For regressive models, DataRobot does give you a MASE score but, for some reason, often doesn't suggest the best MASE score model.
The software will give you errors if output files are not entered correctly but will not exactly tell you how to fix them. Perhaps that is complicated, but being able to download a template with your data for an output file in the correct format would be nice.
It would be beneficial to have AMOS as part of the SPSS package instead of purchasing it separately.
It would be beneficial to have other statistical tests, such as PROCESS, be part of the standard SPSS tests instead of having the need to run a syntax to have it installed.
My dataset tends to be smaller, and I have never had any issues with using SPSS. I heard that SPSS may not be optimal when handling large datasets.
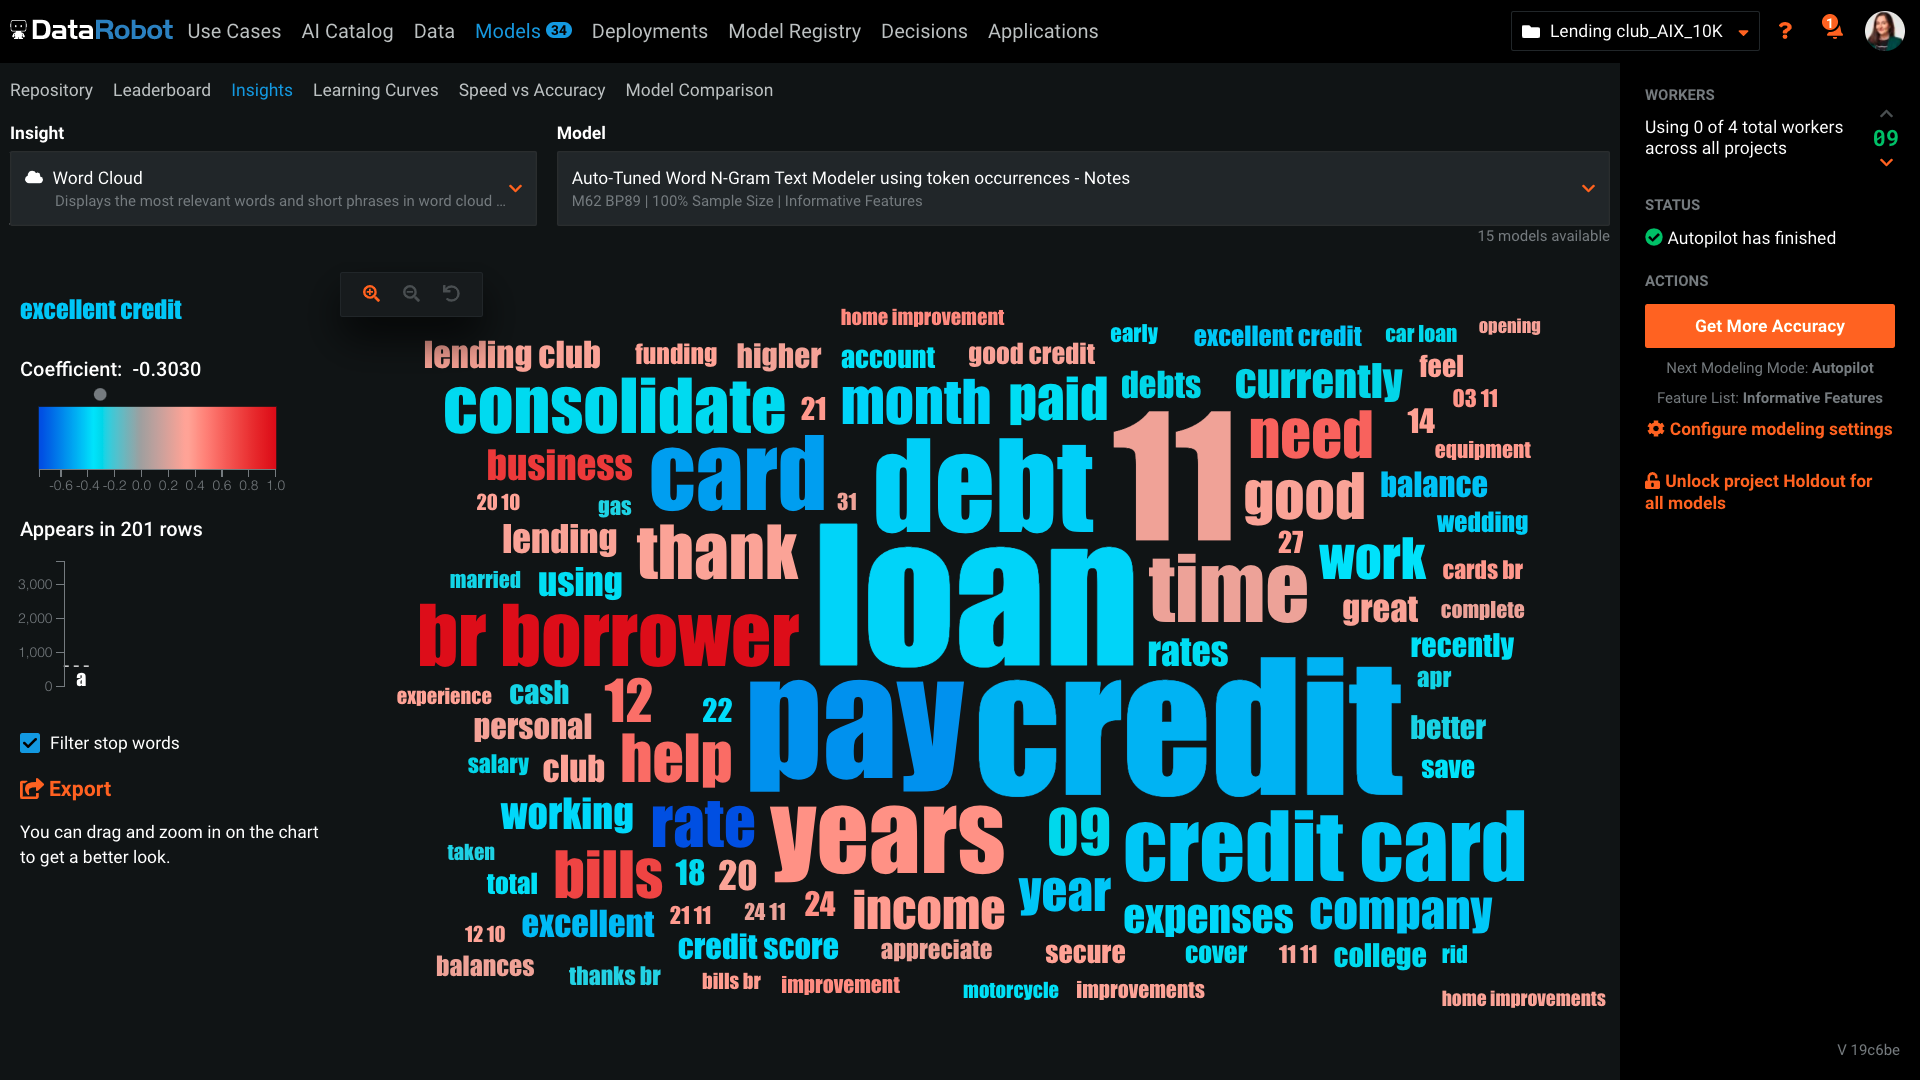
DataRobot presents a machine-learning platform designed by data scientists from an array of backgrounds, to construct and develop precise predictive modeling in a fraction of the time previously taken. The tech invloved addresses the critical shortage of data scientists by changing the speed and economics of predictive analytics. DataRobot utilizes parallel processing to evaluate models in R, Python, Spark MLlib, H2O and other open source databases. It searches for possible permutations and algorithms, features, transformation, processes, steps and tuning to yield the best models for the dataset and predictive goal.
Both money and time are essential for success in terms of return on investment for any kind of research based project work. Using a Likert-scale questionnaire is very easy for data entry and analysis using IBM SPSS. With the help of IBM SPSS, I found very fast and reliable data entry and data analysis for my research. Output from SPSS is very easy to interpret for data analysis and findings
Probably because I have been using it for so long that I have used all of the modules, or at least almost all of the modules, and the way SPSS works is second nature to me, like fish to swimming.
As I am writing this report I am participating with Datarobot Engineers in an complex environment and we have their whole support. We are in Mexico and is not common to have this commitment from companies without expensive contract services. Installing is on premise and the client does not want us to take control and they, the client, is also limited because of internal IT regulations ,,, soo we are just doing magic and everybody is committed.
I have not contacted IBM SPSS for support myself. However, our IT staff has for trying to get SPSS Text Analytics Module to work. The issue was never resolved, but I'm not sure if it was on the IT's end or on SPSS's end
Have a plan for managing the yearly upgrade cycle. Most users work in the desktop version, so there needs to be a mechanism for either pushing out new versions of the software or a key manager to deal with updated licensing keys. If you have a lot of users this needs to be planned for in advance.
DataRobot provided the perfect balance of features and price points. The other tools we tried were very expensive and provided extra things that we really didn't need. Some of the other tools also required you to host them on a server at your institution or pay for their cloud service in addition to getting the software. This added to the expense without adding any additional functionality.
I have used R when I didn't have access to SPSS. It takes me longer because I'm terrible at syntax but it is powerful and it can be enjoyable to only have to wrestle with syntax and not a difficult UI.