DBArtisan from Embarcadero Technologies (acquired by Idera) is a database administration toolset.
N/A
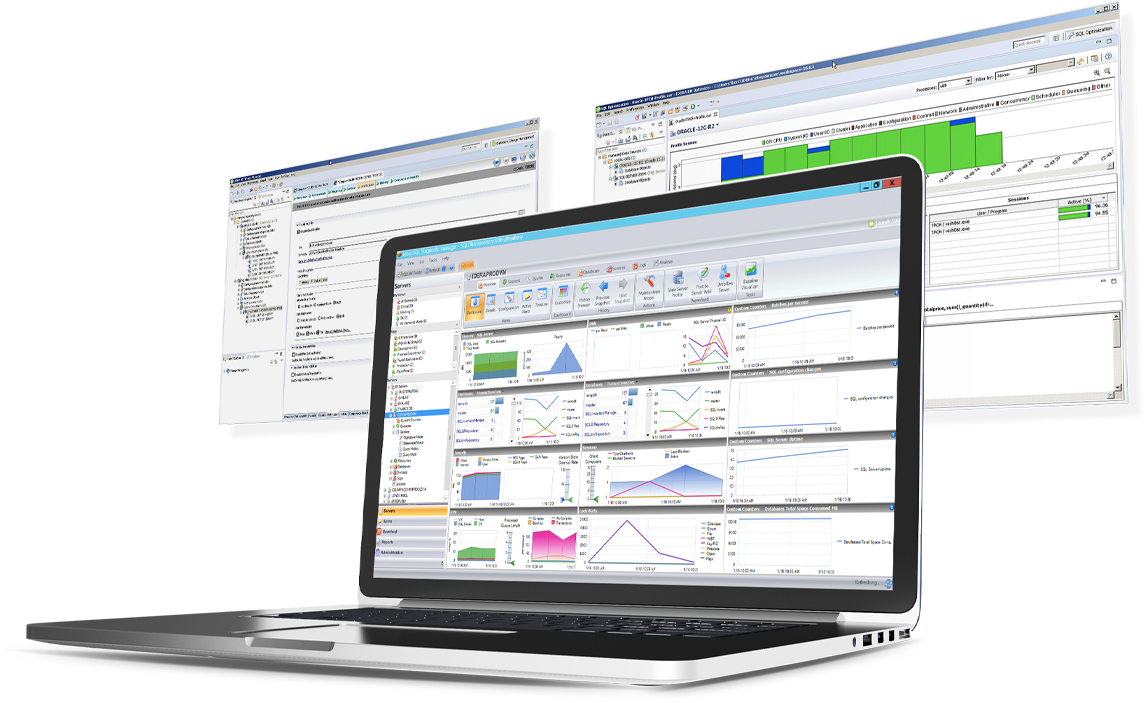
IDERA SQL Diagnostic Manager
Score 8.0 out of 10
N/A
SQL Diagnostic Manager for Microsoft SQL Server helps database administrators to find and fix Microsoft SQL Server performance problems in physical, virtual, and cloud environments. Unlike its competition, it provides effective scalability, advanced SQL query analysis and optimization, prescriptive analysis with corrective SQL scripts, powerful automated alert responses, broad PowerShell integration, complete customization, and extensive support for current and legacy Microsoft SQL Server and…
SQuirreL isn't showing up in the search results ... that is our favorite free alternative. Very powerful IDE, very easy to use. oracle sql developer is just a very basic front end. Free, simple, works, but in a different league from DBArtisan. I recently tried IntelliJ. I wasn't …
Overall excellent tool for DBAs. Seamless cross-platform integration, which is rare (or non-existent) among its competitors. The "monitor" helps the DBA to see everything that's going on in the database. Similarly, the interface is well-organized so that you can navigate to …
IDERA SQL Diagnostic Manager for SQL Server is an excellent tool, however I think Solarwinds Database Perfromance Analyzer is a slightly stronger more well rounded product
IDERA SQL Diagnostic Manager for SQL, Redgate SQL, and MonitorLogicMonitor are similar products to each other. We decided on IDERA SQL Diagnostic Manager for SQL because our experience with locating heavy queries has been very good and it provides real-time monitoring of all …
SQL Server [Business Intelligence] Manager works well with Microsoft products. It has several advanced features along with dashboards and alerts that can be configured to user's need.
All the toolsets we looked at have the same basic feature sets. We felt like IDERA SQL Diagnostic Manager for SQL Server had more features (SQL Doctor features) and better historical features. More toolsets now have a lot of these features, but for eight years, IDERA SQL …
SQL Server Business Intelligence Manager does what SQL Server Management Studio should already do natively. So it actually fills up important gaps Microsoft left in its product.
We compared SQL Server Business Intelligence Manager to our current tool Solarwinds Database Performance Analyzer. Where Solarwinds was deficient, SQL BI manager filled the gap. At the end of the day they were both different tools with different purposes so we concluded it was …
DBArtisan is excellent for large institutions with multiple mission-critical databases. It works especially well for cross-platforms RDBMS support. I am mostly familiar with Oracle, but less familiar with SQL Server and Sybase. So I certainly appreciate having a similar interface that allows me to manage those less familiar RDBMS, as this will mean a smaller learning curve. DBArtisan is mostly for DBAs, it is not suitable for developers, I believe the vendor has a separate tool for that
If you have several SQL servers and don't have a lot of time or resources to constantly monitor them, SQLdm will be very helpful. For one or two servers, it might be overkill. All of our servers are virtual, so having a tool that can monitor host metrics as well as guest metrics is a plus as well.
SQLdm does a good job of providing information at a high level, but also allows me to drill down to specific queries and events if needed. I don't always need to sift through tons of details to get the information I need. It also gives a very wide range of information from SQL specific metrics, to OS metrics, to VM metrics, all the way up to host server metrics.
I like how the alert and notification system can be customized. For example, if you know a certain server regularly has long-running queries, you can adjust the alert to not fire unless a query has been running for 30 minutes while the rest of the servers fire after 30 seconds. That is very helpful in not being bombarded at dinner with alerts from a server similar to, "I've been at 90% cpu for 26 milliseconds!!!!!!!...and now it's back down to 30%" Good information to know, but not something you need to literally lose sleep over.
I like how you can configure different servers to be monitored differently. For example, you can have a group of servers called DEVELOPMENT that you can turn on heavier monitoring on so you can test how changes in applications might affect the SQL environment, but in the PRODUCTION group, you may only want to enable the heavier analysis and logging when performance issues are actively being reported.
DBArtisan lacks a utility that does schema or object comparisons, which is a feature in Toad. I find this useful in some situations where I need to find out all differences between Prod and QA for a given schema, for example. DBArtisan doesn't seem to have the capacity to do this.
I wish there was a way for the tool to warn me before performing a long-running task. For example if I want to re-organize a large table or rebuild an index for a table with millions of rows, it should warn me before executing it, so that I may choose to do it in a different way. Sometimes if I let these long operations run for too long, it freezes the program and crashes DBArtisan. I would rather run it on the DB server, and run it in background so that it doesn't time out, if DBArtisan gave me a warning before execution.
Idera has taken over Embarcadero. I never heard of or dealt with Idera for support. I don't know if they have same the quality support as before.
Windows client has some issues. When you have small time intervals for your data collection, it can cause the client to become unresponsive and require you to restart it.
It takes more time to get the web client running than it does to get the windows client running.
The visualizations have been the same for the last eight years--could use a little bit of a refresh.
SQL Server [Business Intelligence] Manager works well with Microsoft products. It has several advanced features along with dashboards and alerts that can be configured to user's need.