TrustRadius: an HG Insights company

Save this comparison

Save this comparison

Add Product

Recommended Comparisons

    Overview
    ProductRatingMost Used ByProduct SummaryStarting Price

    Entendo

    N/A
    Mid-Size Companies (51-1,000 employees)
    Entendo is a conversational business intelligence platform that turns plain-language questions into charts and numbers — without SQL, BI specialists, or weeks of setup. Built for Brazilian mid-market companies (50–300 employees), Entendo connects directly with XSLX/CSV to PostgreSQL, MySQL , SQL Server and Oracle databases — typically behind ERPs such as Totvs Protheus, SAP Business One, Bling, or Omie — and lets any decision-maker ask a question in natural language and get an answer in…

    $29

    per month per organization

    SAS Visual Analytics

    Score7.8 out of 10
    Enterprise companies (1,001+ employees)
    SAS Visual Analytics provides a complete platform for analytics visualization, enabling users to identify patterns and relationships in data that weren't initially evident. Interactive, self-service BI and reporting capabilities are combined with out-of-the-box advanced analytics so everyone can discover insights from any size and type of data, including text.N/A
    Pricing
    EntendoSAS Visual Analytics
    Editions & Modules
    Free
    $0
    one-time fee Up to 5 users 30 free queries CSV / Excel upload Agents: Chart, Table Exports (CSV, PDF, PNG)
    Starter
    $29
    per month Up to 15 users 80 queries / month SQL, Postgres, Sheets connection Basic Analytics Agent Dashboard Sharing
    Pro
    $69
    per month Up to 40 users 200 queries / month Prediction Agent (Forecast) Full Analytics Agent Prompt audit logs
    Business
    $149
    per month Up to 100 users 500 queries / month Execution priority Embedded Analytics Optional contract
    Enterprise
    tbd
    per month Custom Full control: your cloud, your rules, your data. Unlimited users SSO / SAML Custom SLA BYOK (bring your own AI key)
    SAS Visual Analytics for SAS Cloud
    $0
    Annual By Users: 5, 10, 20
    Offerings
    Pricing Offerings
    EntendoSAS Visual Analytics
    Free Trial
    NoYes
    Free/Freemium Version
    YesNo
    Premium Consulting/Integration Services
    YesYes
    Entry-level Setup FeeNo setup feeNo setup fee
    Additional DetailsEntendo is priced per workspace, not per seat. A 40-person data team on the Pro plan pays the equivalent of ~$1.75 per user per month. Query quotas refer to natural-language questions asked to the AI agents. Traditional dashboard views, chart interactions, drill-downs, cross-filters, report sharing, and data exports (CSV, PDF, PNG) are unlimited on all plans, including Free. Plan capabilities scale as follows: - Free (R$0 / ~$0): 5 users, 30 queries/month. CSV and Excel file upload only. Includes Chart Agent and Table Agent. Exports in CSV, PDF, PNG. - Starter (R$149 / ~$29): 15 users, 80 queries/month. Adds database connectors (PostgreSQL, MySQL, SQL Server, Oracle, Google Sheets). Adds Basic Analytics Agent. Adds Dashboard Sharing. - Pro (R$349 / ~$69, most popular): 40 users, 200 queries/month. Adds Prediction Agent (time-series forecasting with ARIMA and Holt-Winters). Upgrades to Full Analytics Agent. Adds prompt audit logs for governance and compliance. - Business (R$749 / ~$149): 100 users, 500 queries/month. Adds query execution priority, Embedded Analytics (iframe/embed in third-party applications), and optional annual contract terms. - Enterprise (custom): Unlimited users, custom query quotas, on-premise or hybrid deployment, BYOK (Bring Your Own Key) for LLM providers including OpenAI, Anthropic, and Google Gemini, SSO, audit trails, LGPD compliance, and SLA. Note on currency: Entendo is a Brazilian product and billing is currently available in Brazilian Reais (BRL) only. USD prices shown in this listing are approximate conversions at R$5.00 per USD and are provided for reference. Actual billed amounts are R$149 (Starter), R$349 (Pro), and R$749 (Business) per month.SAS Visual Statistics and SAS Office Analytics are also available as add-ons.
    More Pricing Information
    Features
    EntendoSAS Visual Analytics
    BI Standard Reporting
    Comparison of BI Standard Reporting features of Entendo and SAS Visual Analytics
    Feature
    Entendo
    -
    Ratings
    SAS Visual Analytics
    8.3
    11 Ratings
    2% above category average
    Pixel Perfect reports00 Ratings8.011 Ratings
    Customizable dashboards00 Ratings8.011 Ratings
    Report Formatting Templates00 Ratings9.010 Ratings
    Ad-hoc Reporting
    Comparison of Ad-hoc Reporting features of Entendo and SAS Visual Analytics
    Feature
    Entendo
    -
    Ratings
    SAS Visual Analytics
    8.8
    12 Ratings
    9% above category average
    Drill-down analysis00 Ratings9.012 Ratings
    Formatting capabilities00 Ratings8.012 Ratings
    Integration with R or other statistical packages00 Ratings8.010 Ratings
    Report sharing and collaboration00 Ratings10.011 Ratings
    Report Output and Scheduling
    Comparison of Report Output and Scheduling features of Entendo and SAS Visual Analytics
    Feature
    Entendo
    -
    Ratings
    SAS Visual Analytics
    9.2
    12 Ratings
    11% above category average
    Publish to Web00 Ratings9.011 Ratings
    Publish to PDF00 Ratings9.012 Ratings
    Report Versioning00 Ratings9.09 Ratings
    Report Delivery Scheduling00 Ratings10.011 Ratings
    Delivery to Remote Servers00 Ratings9.06 Ratings
    Data Discovery and Visualization
    Comparison of Data Discovery and Visualization features of Entendo and SAS Visual Analytics
    Feature
    Entendo
    -
    Ratings
    SAS Visual Analytics
    9.7
    10 Ratings
    19% above category average
    Pre-built visualization formats (heatmaps, scatter plots etc.)00 Ratings10.09 Ratings
    Location Analytics / Geographic Visualization00 Ratings10.010 Ratings
    Predictive Analytics00 Ratings9.09 Ratings
    Access Control and Security
    Comparison of Access Control and Security features of Entendo and SAS Visual Analytics
    Feature
    Entendo
    -
    Ratings
    SAS Visual Analytics
    8.3
    11 Ratings
    2% below category average
    Multi-User Support (named login)00 Ratings9.011 Ratings
    Role-Based Security Model00 Ratings8.010 Ratings
    Multiple Access Permission Levels (Create, Read, Delete)00 Ratings8.011 Ratings
    Single Sign-On (SSO)00 Ratings8.07 Ratings
    Mobile Capabilities
    Comparison of Mobile Capabilities features of Entendo and SAS Visual Analytics
    Feature
    Entendo
    -
    Ratings
    SAS Visual Analytics
    8.7
    9 Ratings
    12% above category average
    Responsive Design for Web Access00 Ratings10.09 Ratings
    Mobile Application00 Ratings9.07 Ratings
    Dashboard / Report / Visualization Interactivity on Mobile00 Ratings9.08 Ratings
    Application Program Interfaces (APIs) / Embedding
    Comparison of Application Program Interfaces (APIs) / Embedding features of Entendo and SAS Visual Analytics
    Feature
    Entendo
    -
    Ratings
    SAS Visual Analytics
    9.2
    5 Ratings
    17% above category average
    REST API00 Ratings10.04 Ratings
    Javascript API00 Ratings9.04 Ratings
    iFrames00 Ratings9.04 Ratings
    Java API00 Ratings9.04 Ratings
    Themeable User Interface (UI)00 Ratings9.04 Ratings
    Customizable Platform (Open Source)00 Ratings9.03 Ratings
    Best Alternatives
    EntendoSAS Visual Analytics
    Small Businesses
    Cyfe
    Score4 out of 10
    Cyfe
    Score4 out of 10
    Medium-sized Companies
    Qlik Cloud Analytics (Qlik Sense)
    Score8.1 out of 10
    Qlik Cloud Analytics (Qlik Sense)
    Score8.1 out of 10
    Enterprises
    Jaspersoft Community Edition
    Score7 out of 10
    Jaspersoft Community Edition
    Score7 out of 10
    All AlternativesView all alternativesView all alternatives
    User Ratings
    EntendoSAS Visual Analytics
    Likelihood to Recommend
    -
    (0 ratings)
    9.0
    (17 ratings)
    Likelihood to Renew
    -
    (0 ratings)
    9.3
    (3 ratings)
    Usability
    -
    (0 ratings)
    6.0
    (1 ratings)
    Support Rating
    -
    (0 ratings)
    8.0
    (3 ratings)
    Data Sharing and Collaboration
    -
    (0 ratings)
    9.6
    (11 ratings)
    Data Sources
    -
    (0 ratings)
    9.8
    (11 ratings)
    User Testimonials
    EntendoSAS Visual Analytics
    Likelihood to Recommend
    Sozo Data Ltda
    No answers on this topic
    SAS
    I was in a meeting with the client and there I have to show them some analytic data to them. But I was confused about how I will manage to show big data to clients with accuracy. But then the SAS Visual Analytics software helps me in presenting accurate data at the moment and it was very presentable and through that, I got the deal for that business.
    Incentivized
    Read full review
    Pros
    Sozo Data Ltda
    No answers on this topic
    SAS
    • Provides the flexibility to the end user to slice and dice the data.
    • Anyone can make predictive models with the help of in-built algorithms without the need to write a single line of code or knowledge of what's under the hood of algorithms.
    • The feature to simply ask a question related to data and getting a response in form of text, chart or graph is amazing.
    Incentivized
    Read full review
    Cons
    Sozo Data Ltda
    No answers on this topic
    SAS
    • SAS is relatively expensive when compared to other BI tools and requires a large amount of upfront fee which becomes an issue for smaller organizations.
    • UI for the dashboards looks a little date in comparison to competitors like Tableau and Microstrategy.
    • Integration with other open source software like Python needs to be built in.
    Incentivized
    Read full review
    Likelihood to Renew
    Sozo Data Ltda
    No answers on this topic
    SAS
    SAS really is the cutting edge in Business Intelligence. That is all they do! They are constantly coming out with new products, product upgrades, and their tech support is second to none. In addition, their support of Education has made our ability to acquire their product possible.
    Read full review
    Usability
    Sozo Data Ltda
    No answers on this topic
    SAS
    SAS BI is good for creating reports and dashboards and then sharing it with the users. It also has ability to manage access to the reports and dashboards but somehow with most of the world moving to open source languages R, Python and Julia, SAS BI feels to be archaic in terms of feature set and integrations it allow[s]. Also, comparing it with other Business Intelligence tools like Tableau and Microsoft BI, the functionality of SAS BI is very limited and doesn't justify the pricing.
    Incentivized
    Read full review
    Support Rating
    Sozo Data Ltda
    No answers on this topic
    SAS
    When you call tech support, you are immediately routed to a person who can answer your question. Often they can answer on the spot. However, if they cannot, you are given a track number and then followed up with. There have been times when I have had multiple track numbers open and they will actually TRACK YOU DOWN to ensure that your problem has been resolved. Issues do not fall into black holes with SAS. They are also willing to do a WebEx with you to diagnose the problem by seeing your environment, which is always helpful.
    Read full review
    Alternatives Considered
    Sozo Data Ltda
    No answers on this topic
    SAS
    I have used Crystal Reports, Jaspersoft and SQL Server Reporting Services (SSRS). I would recommended Business Intelligence over SSRS and Crystal Reports. SSRS is very SQL-centric and Crystal Reports is more of an end-user tool. I would recommend Jaspersoft over Business Intelligence for developing a seamless web-based reporting interface but I highly recommend Business Intelligence for end-user ad-hoc reporting.
    Incentivized
    Read full review
    Return on Investment
    Sozo Data Ltda
    No answers on this topic
    SAS
    • SAS Visual Analytics licensing cost should be reduced to enable users to use it in mass scale.
    • More statistical and mathematical equations and theories should be converted into SAS functions for reusing.
    • Because of enriched ETL and reporting capabilities SAS Visual Analytics is most preferred by business users.
    Incentivized
    Read full review
    ScreenShots

    Entendo Screenshots

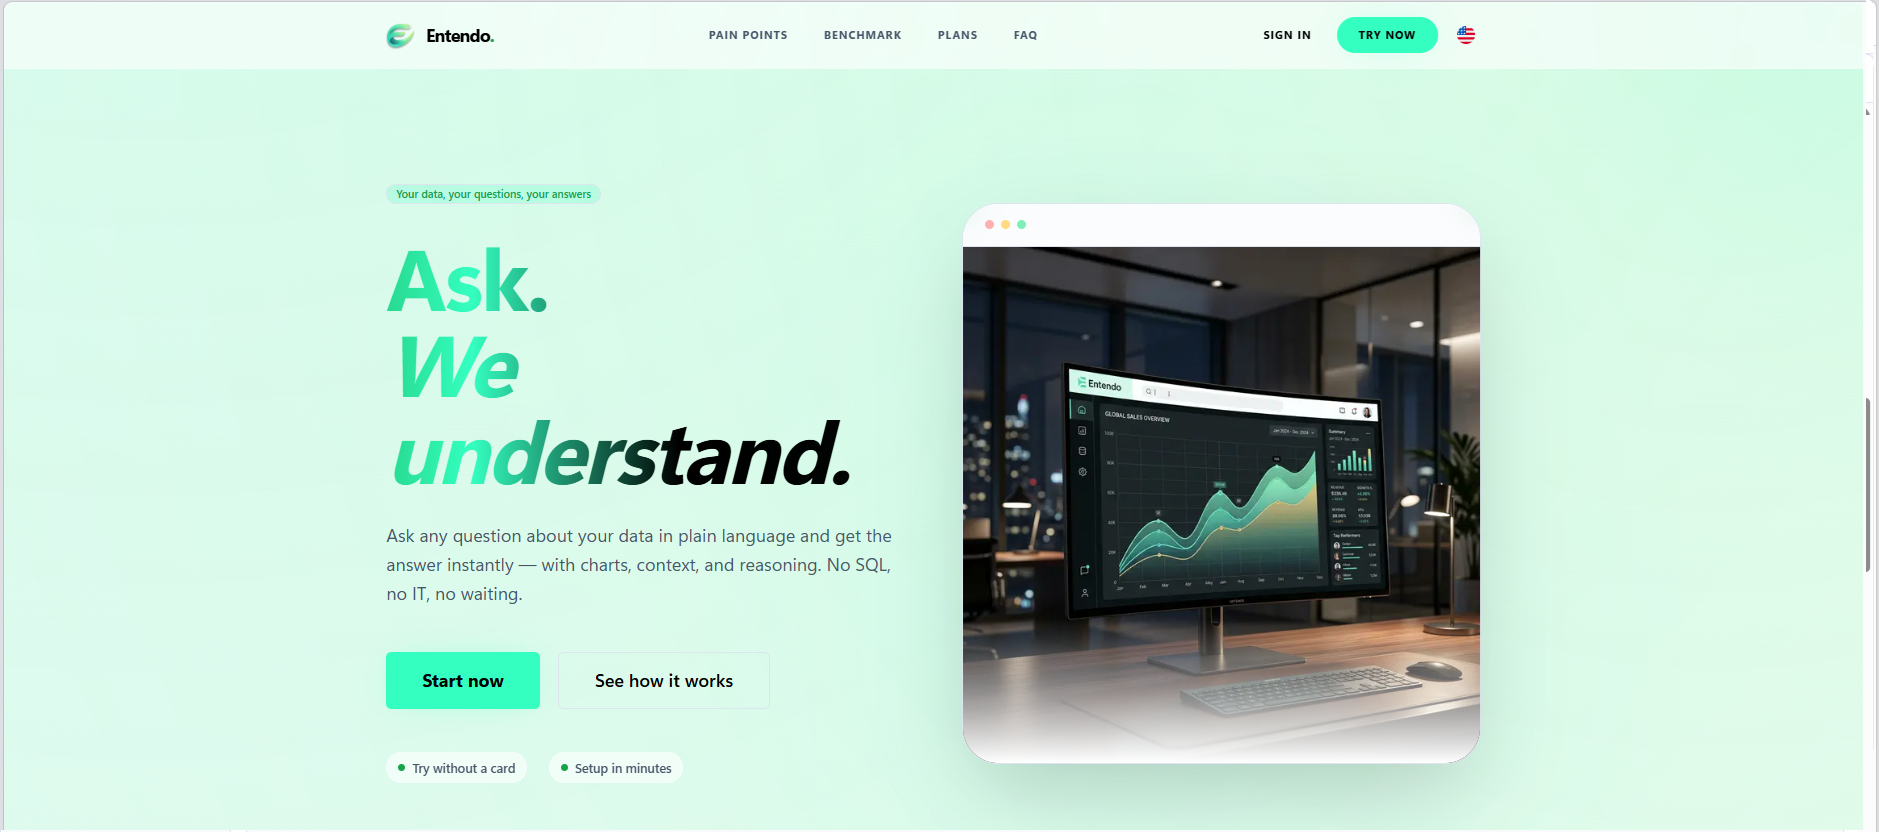
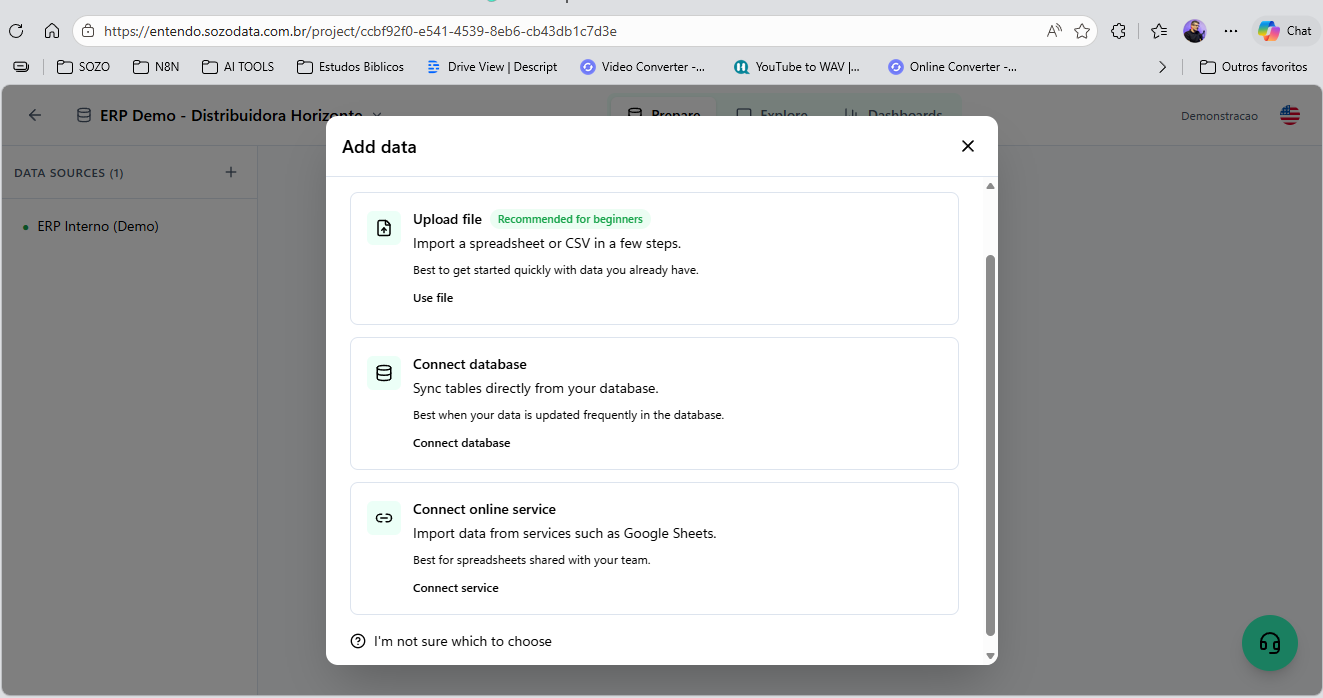
    Screenshot of Entendo's landing page, which introduces the product's core promise: Ask. We  understand. Users type any business question in plain language and get the answer instantly — with charts, context, and reasoning — no SQL, no IT tickets, no waiting for the BI team.Screenshot of where users can upload a spreadsheet or CSV, connect their own SQL database (PostgreSQL, MySQL, SQL Server, Oracle), or sync tables from a cloud service like Google Sheets. File  upload is the recommended path for first-time users who want to evaluate the product on their own data before connecting production systems.Screenshot of where Entendo connects directly to existing production databases —   PostgreSQL, MySQL, SQL Server, and Oracle — using read-only credentials you control. The architecture is read-only by design with  four layers of SQL sanitization, so the AI agents can never write, update, or delete data.Screenshot of the conversational interface, which delivers analysis as a complete answer. In this view, the AI is responding about a pessimistic scenario: a revenue line chart on top, headline KPIs in the middle (current revenue, scenario impact, variation percentage), and a comparative bar chart at the bottom. Everything is generated live from the connected database.Screenshot of the Business Analytics Agent responding to a real question:   "show me an analysis of the actions being continuously taken to grow revenue by 30%." Instead of dumping a chart, the agent delivers a   structured diagnosis — overall picture, central problem, root-cause hypothesis, and concrete actions — grounded in the user's own data.Screenshot of an AI generated chart that can be pinned to a dashboard with a click. This example shows a wholesale operations dashboard with four views: weekly sales by day, top products by unit, critical stock   products, and inventory turnover ratio. Dashboards are shareable across the workspace, so the whole team sees the same numbers.

    SAS Visual Analytics Screenshots

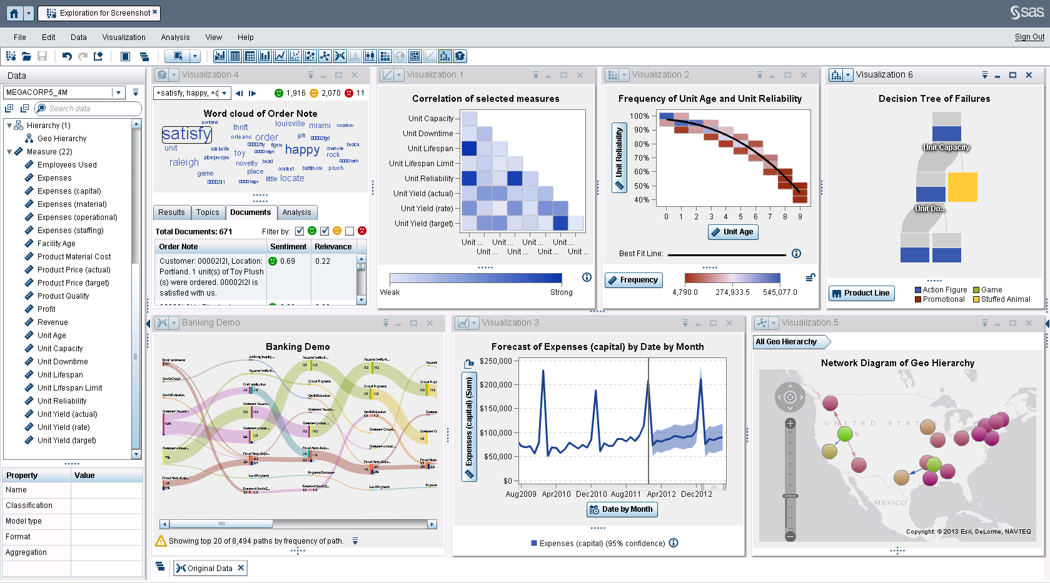
    Screenshot of Explore your data using analytics and interactive data visualizations.