erwin Data Modeler vs. Grafana
erwin Data Modeler vs. Grafana
| Product | Rating | Most Used By | Product Summary | Starting Price |
|---|---|---|---|---|
 erwin Data Modeler | N/A | erwin Data Modeler by Quest is a data modeling tool used to find, visualize, design, deploy and standardize high-quality enterprise data assets. It can discover and document any data from anywhere for consistency, clarity and artifact reuse across large-scale data integration, master data management, metadata management, Big Data, business intelligence and analytics initiatives, accomplishing this whil esupporting data governance and intelligence efforts. | N/A | |
 Grafana | N/A | Grafana is a data visualization tool developed by Grafana Labs in New York. It is available open source, managed (Grafana Cloud), or via an enterprise edition with enhanced features. Grafana has pluggable data source model and comes bundled with support for popular time series databases like Graphite. It also has built-in support for cloud monitoring vendors like Amazon Cloudwatch, Microsoft Azure and SQL databases like MySQL. Grafana can combine data from many places into a single dashboard. | $0 |
| erwin Data Modeler | Grafana | |||||||||||||||
|---|---|---|---|---|---|---|---|---|---|---|---|---|---|---|---|---|
| Editions & Modules | No answers on this topic |
| ||||||||||||||
| Offerings |
| |||||||||||||||
| Entry-level Setup Fee | Optional | No setup fee | ||||||||||||||
| Additional Details | — | — | ||||||||||||||
| More Pricing Information | ||||||||||||||||
| erwin Data Modeler | Grafana | |
|---|---|---|
| Top Pros | ||
| Top Cons |
|
|
| erwin Data Modeler | Grafana | ||||||||||||||||||
|---|---|---|---|---|---|---|---|---|---|---|---|---|---|---|---|---|---|---|---|
| BI Standard Reporting |
| ||||||||||||||||||
| Ad-hoc Reporting |
| ||||||||||||||||||
| Report Output and Scheduling |
| ||||||||||||||||||
| Data Discovery and Visualization |
|
| erwin Data Modeler | Grafana | |
|---|---|---|
| Small Businesses |  Egnyte Score 7.6 out of 10 |  IBM SPSS Modeler Score 7.8 out of 10 |
| Medium-sized Companies |  IBM InfoSphere Information Server Score 8.1 out of 10 |  Mathematica Score 8.2 out of 10 |
| Enterprises | IBM InfoSphere Information Server Score 8.1 out of 10 | IBM SPSS Modeler Score 7.8 out of 10 |
| All Alternatives | View all alternatives | View all alternatives |
| erwin Data Modeler | Grafana | |
|---|---|---|
| Likelihood to Recommend | 6.1 (7 ratings) | 10.0 (4 ratings) |
| Usability | 9.0 (2 ratings) | - (0 ratings) |
| Support Rating | 9.0 (3 ratings) | - (0 ratings) |
| erwin Data Modeler | Grafana | |
|---|---|---|
| Likelihood to Recommend |  Quest Software
| Grafana Labs
|
| Pros | Quest Software
 Ravinder Gupta Senior Oracle Database Administrator | Grafana Labs
 ANurag Tamrakar Software Engineer - DevOps |
| Cons | Quest Software
| Grafana Labs
|
| Usability | Quest Software
| Grafana Labs No answers on this topic |
| Support Rating | Quest Software
| Grafana Labs No answers on this topic |
| Alternatives Considered | Quest Software
| Grafana Labs
 Matthew Goodhall infastructure consultant |
| Return on Investment | Quest Software
 Rina Falkovich Data Architect | Grafana Labs
|
| ScreenShots | erwin Data Modeler Screenshots  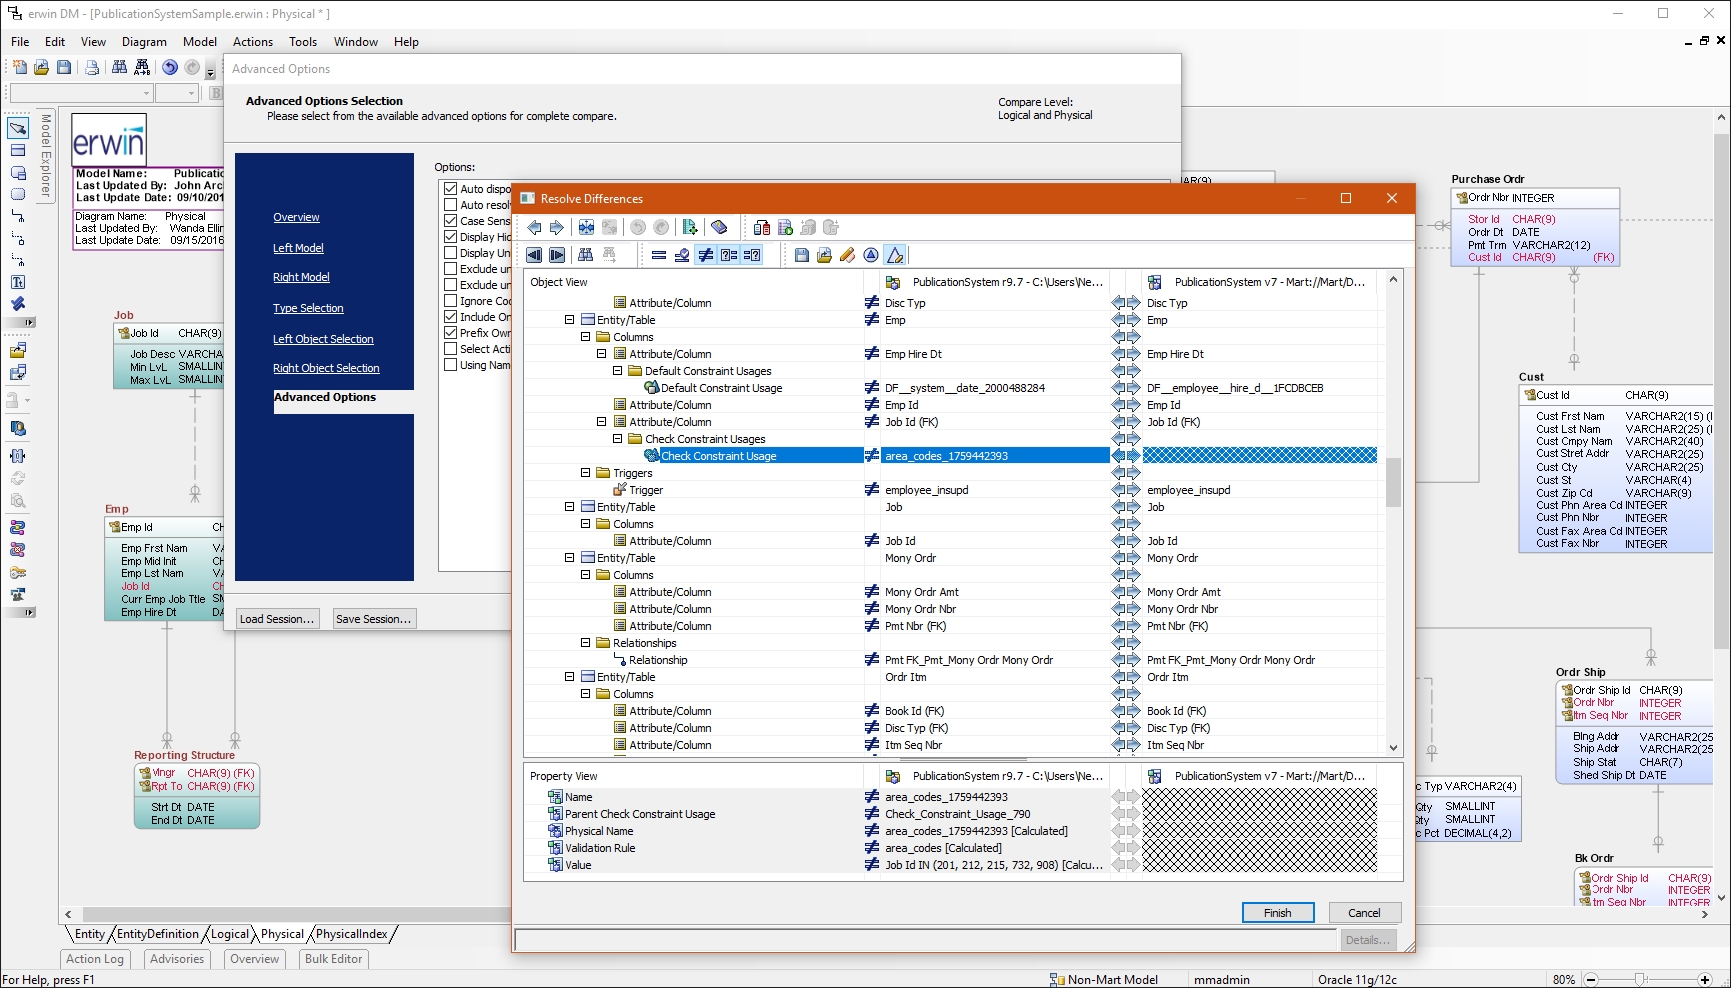 |