Google Charts provides a way to visualize data on your website - for free. From simple line charts to complex hierarchical tree maps, the chart gallery provides a large number of ready-to-use chart types. The most common way to use Google Charts is with simple JavaScript that you embed in your web page.
N/A
iCharts
Score 8.0 out of 10
Mid-Size Companies (51-1,000 employees)
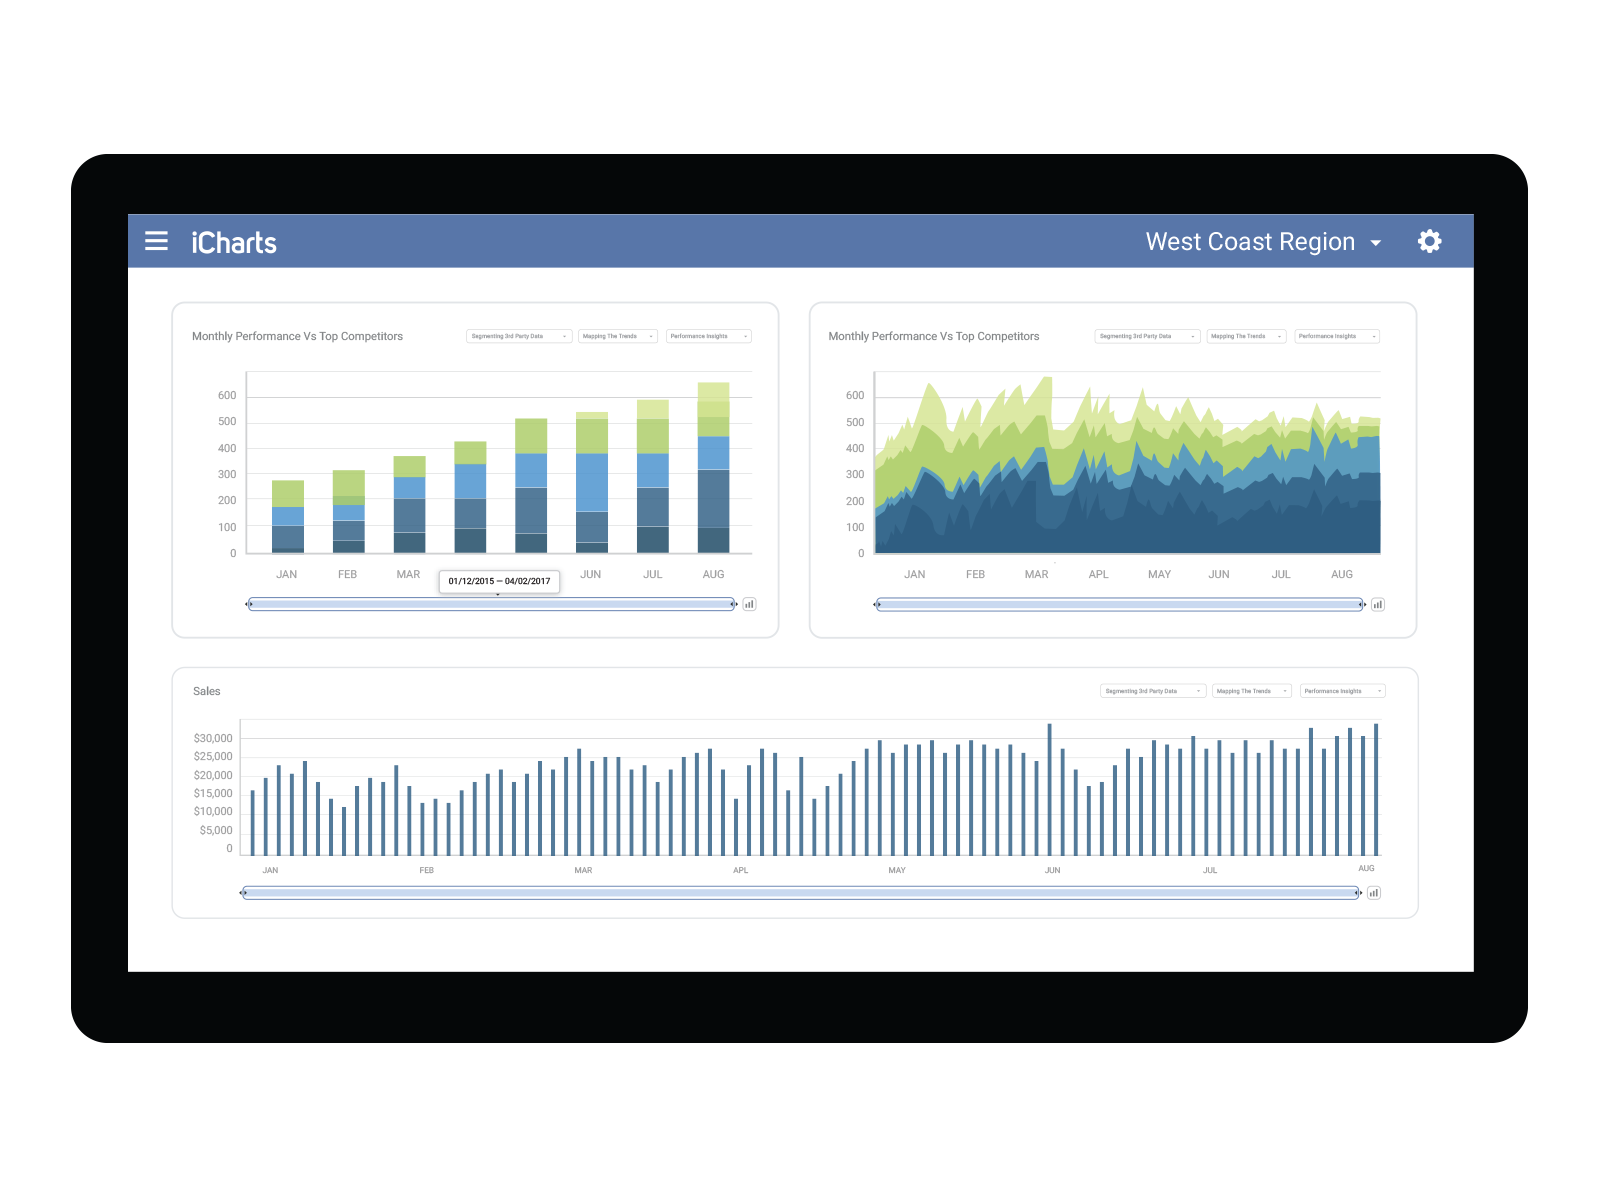
iCharts is a Business Intelligence and Analytics solution for NetSuite. With this solution, users can transform their NetSuite data into interactive, real-time analytics without leaving their NetSuite dashboard. iCharts includes drag-and-drop chart creation and best-practice templates. The vendor’s value proposition is that iCharts accelerates an organization’s analytics strategy by empowering their team with the critical data-driven tools they need.
$10,000
per installation
Pricing
Google Charts
iCharts
Editions & Modules
No answers on this topic
Professional
$10,000
per installation
Business
15,000
per installation
Elite
$25,000
per installation
Offerings
Pricing Offerings
Google Charts
iCharts
Free Trial
No
Yes
Free/Freemium Version
Yes
No
Premium Consulting/Integration Services
No
Yes
Entry-level Setup Fee
No setup fee
$3,000 per installation
Additional Details
—
Based on number of NetSuite licenses
More Pricing Information
Community Pulse
Google Charts
iCharts
Considered Both Products
Google Charts
Verified User
Administrator
Chose Google Charts
I have not used many other software similar to Google Charts because a lot of the software I have used in the past has integrated reporting available to the customer. However, for instances where our software reporting is not accurate, we are able to use this online source to …
We can easily recommend Google Charts to any company that needs a way to visually represent their data. Another great thing about Google Charts is that it is free to use and does not require any membership fees. Although it requires a skilled used to be able to use the charts, the results are great and can be beneficial to any company who is looking to make better decisions.
The iCharts has suited our organization work as it has helped us a lot in our internal and external works. As we use iCharts for the internal team in representing the working reports and data of the business in an accurate manner. It helps in representing the presentation to the client to showcase our work and present him the data and work flow through the iCharts. As I don't found anything missing in this software.
they're free with Google suite and they have backing in terms of powerful Google apps which can be plugged in to perform multiple actions like using Google sheets to import raw data into Google Charts
they're the most simple app to use when it comes to creating charts and visual dashboards
ease of customization
ease of using custom APIs from developers side to help make any types of charts and dashboards you want
I would like a couple more introductory videos or a live chat option for when you run into an issue. I think this is a Google-wide problem, not only linked to Google Charts.
I have run into some issues with the Dynamic Data but also admittedly could potentially dive in deeper and investigate.
It would be great if Google Charts made it possible to integrate Google Chat into the platform.
Google Charts is a good product. It's widely supported with deep documentation and a large community. But for me, it wasn't customizable enough. When we started with simple charts, it was great, but as we got deeper and more complex, our needs outgrew the library. If I was going forward, I would choose a more barebones library with more freedom and extensibility.
Google Charts is about as easy to use as the rest of their applications. The UI is very well thought out, allowing you to add what you need, and customize it to your exact liking. The default theme is actually really nice, which helps as most of the time, customizing is not needed.
As a free tool with massively powerful, infinitely customisable charts that can be dynamically updated - Google Charts is my favourite data visualisation tool. However, my hatred of JavaScript does jade my view on it. This is the price of the tool though, and I'm glad it's available for me.
Google Charts stacks up better since it is free and does not have the constant pressure for cost overruns, add-ons, annual maintenance and implementation services. The speed of using Google Charts is quick, saving users potentially weeks in getting up and going. For the readers of websites with limited resources, the application shows up nicely is look and feel with charts. Great way of showing data visually.