Google Charts provides a way to visualize data on your website - for free. From simple line charts to complex hierarchical tree maps, the chart gallery provides a large number of ready-to-use chart types. The most common way to use Google Charts is with simple JavaScript that you embed in your web page.
N/A
Jedox
Score8.8 out of 10
N/A
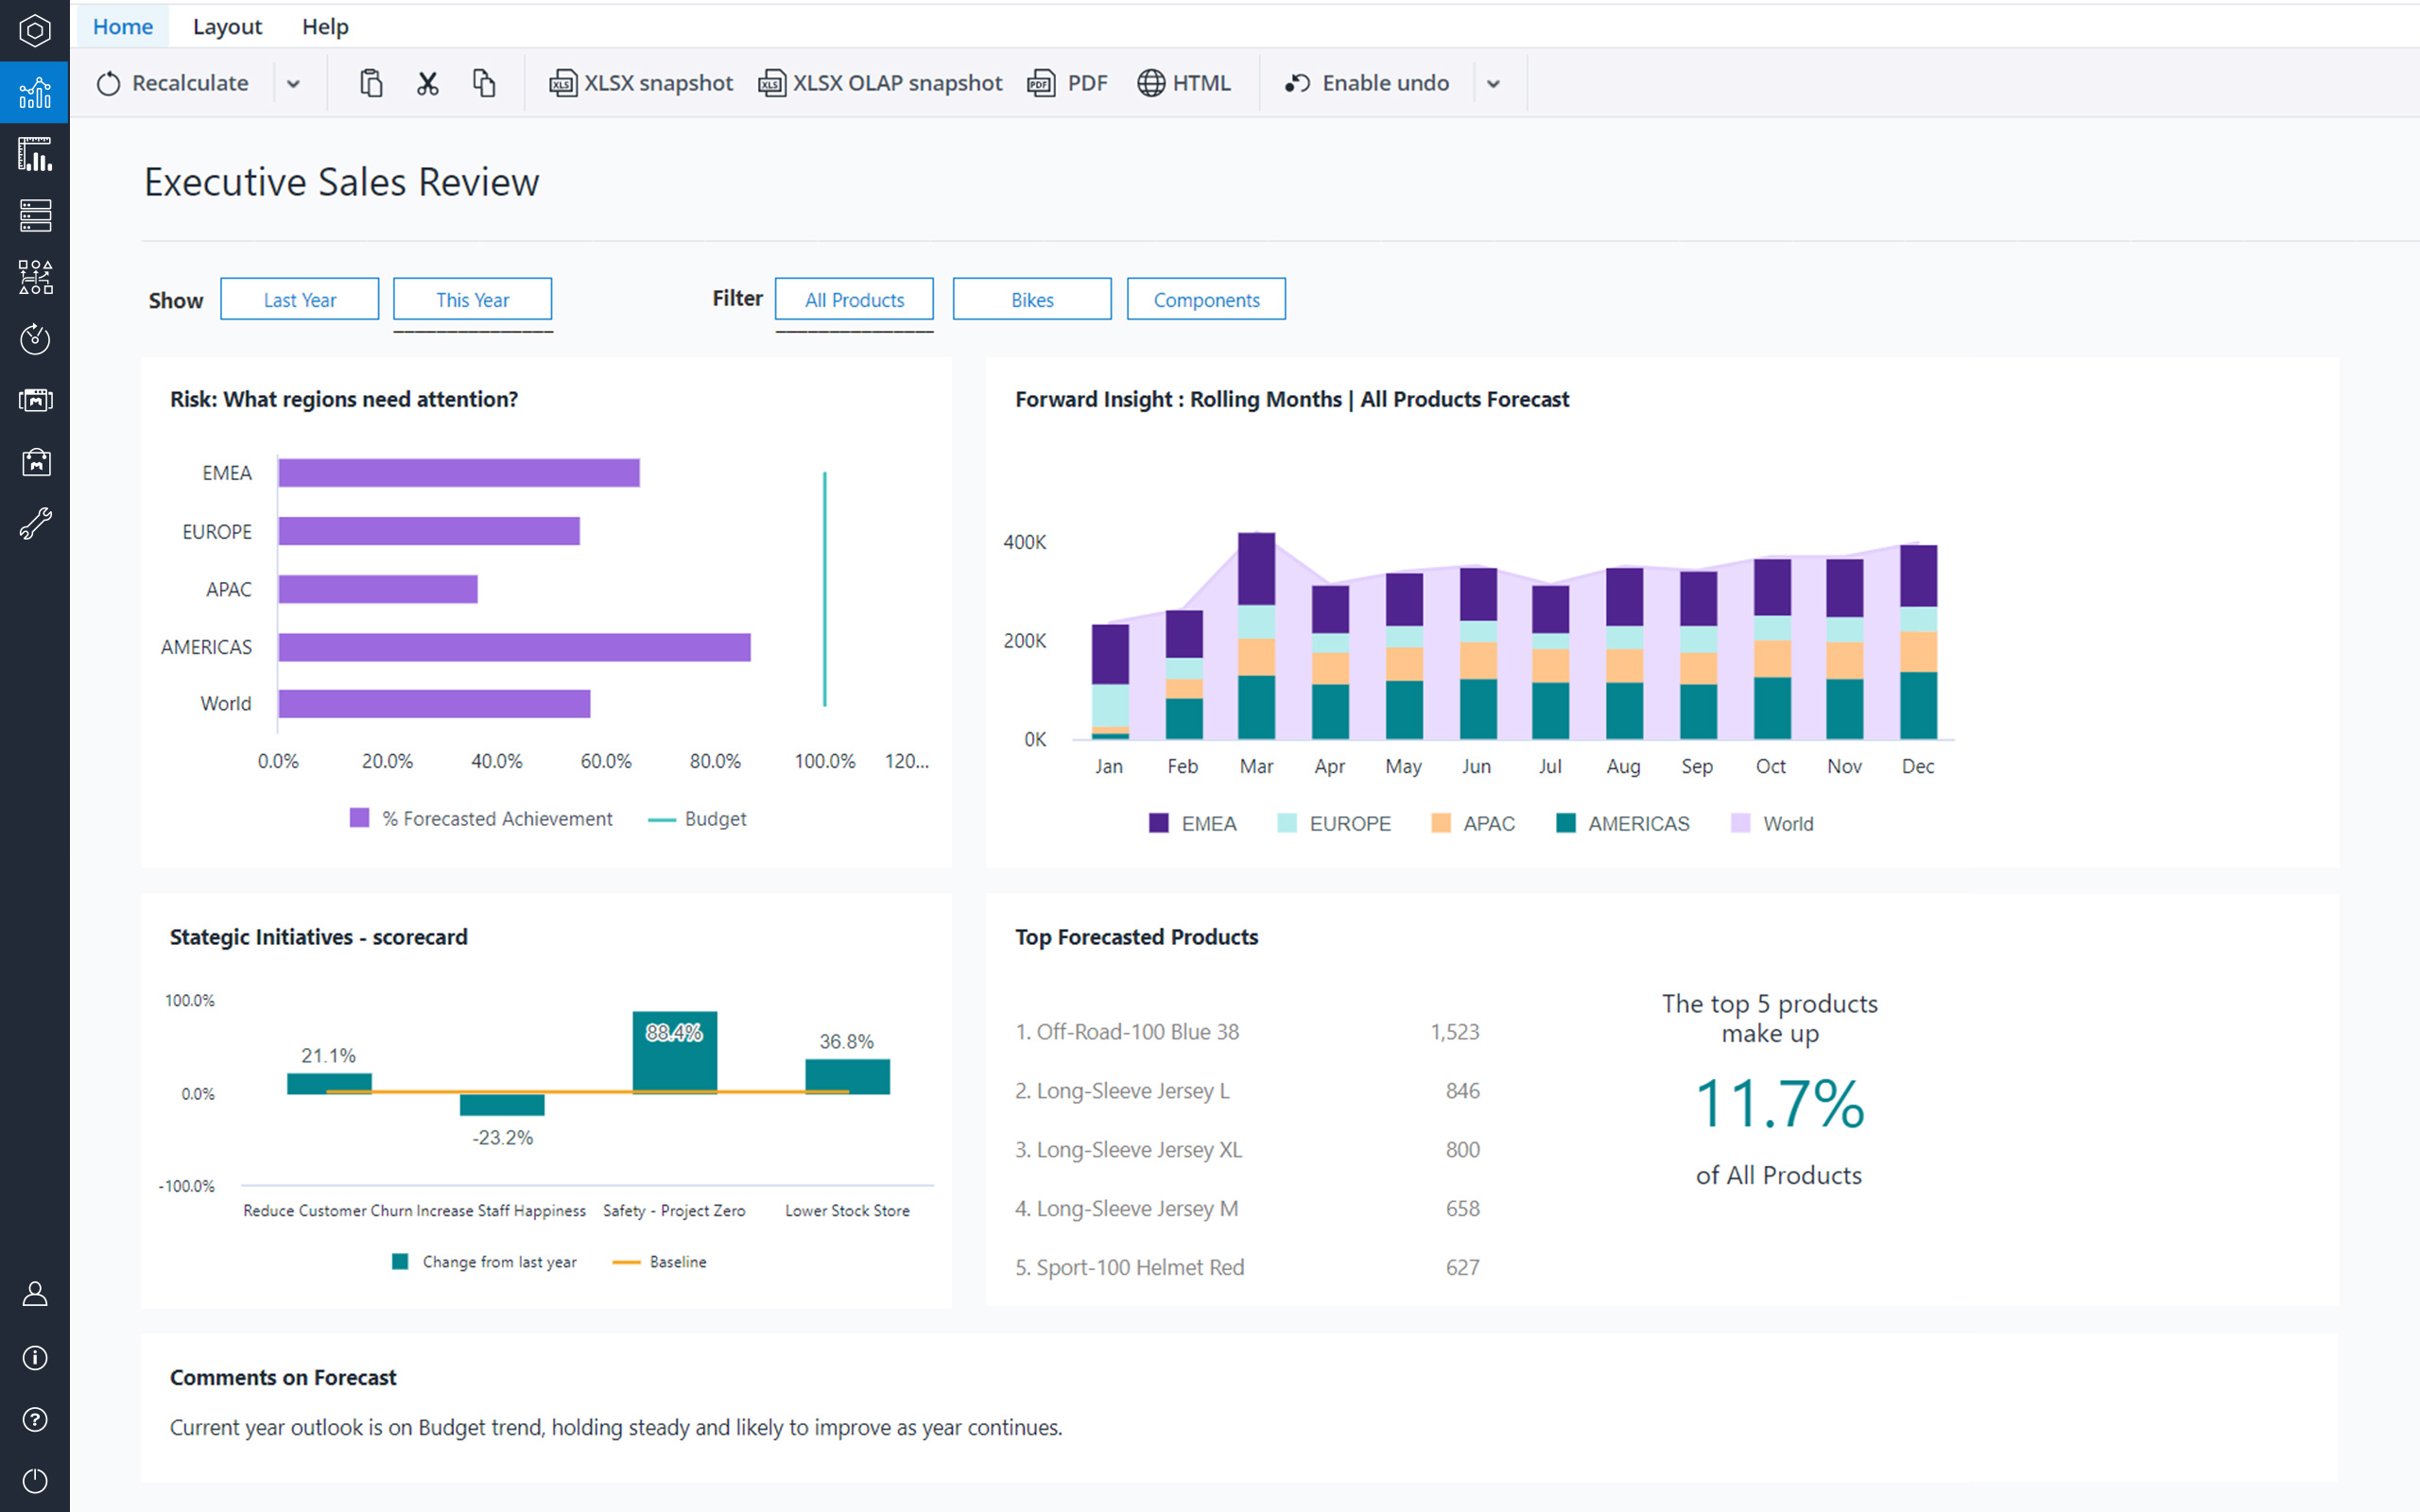
Jedox is a Business Intelligence and Corporate Performance Management solution. According to the vendor, their solution’s unified planning, analysis and reporting empowers decision makers from finance, sales, purchasing and marketing. Additionally, the vendor says this solution helps business users work smarter, streamline business collaboration, and make insight-based decisions with confidence. The vendor also says 1,900 organizations in 127 countries are using Jedox for real-time planning…
We can easily recommend Google Charts to any company that needs a way to visually represent their data. Another great thing about Google Charts is that it is free to use and does not require any membership fees. Although it requires a skilled used to be able to use the charts, the results are great and can be beneficial to any company who is looking to make better decisions.
Best suited for financial consolidation and / or as a highly customized and compact EPM / BI solution (up to 100 CCU) with individual workflows, planning and reporting functionalities, with moderate number of users (no restrictions for any industry, all industries are covered well). It also has advanced reporting & data analysis requirements and provides an integration and reporting layer of imported data from different external systems (via ETL). It can help with migrating your legacy Excel-based business models to the Web. It is not well suited for Enterprise BI applications with expecting >500 CCU (users at the same time working with the system) - this may cause serious performance issues, as all data is kept in RAM. Jedox is also less suited for applications with heavy document management requirements (document management is not an out of the box functionality in Jedox and rather requires custom development through custom widgets etc.).
they're free with Google suite and they have backing in terms of powerful Google apps which can be plugged in to perform multiple actions like using Google sheets to import raw data into Google Charts
they're the most simple app to use when it comes to creating charts and visual dashboards
ease of customization
ease of using custom APIs from developers side to help make any types of charts and dashboards you want
A de minimis incentive was given to thank the reviewer for their time. The incentive was not used to bias or drive a particular response, nor was the incentive contingent on a positive endorsement. More Info
A de minimis incentive was given to thank the reviewer for their time. The incentive was not used to bias or drive a particular response, nor was the incentive contingent on a positive endorsement. More Info
I would like a couple more introductory videos or a live chat option for when you run into an issue. I think this is a Google-wide problem, not only linked to Google Charts.
I have run into some issues with the Dynamic Data but also admittedly could potentially dive in deeper and investigate.
It would be great if Google Charts made it possible to integrate Google Chat into the platform.
A de minimis incentive was given to thank the reviewer for their time. The incentive was not used to bias or drive a particular response, nor was the incentive contingent on a positive endorsement. More Info
Diversity. Jedox can be applied to many different use cases from small to large deployments and from budgeting to enterprise class BI solutions. But rarely is one tool able to fulfill all of these requirements in one organisation. This value proposition can be complicated for prospective users.
Awareness. Jedox punches above its weight in capability and scalability, but not enough people have heard about it and therefore procurement processes can be drawn out as a result.
Google Charts is a good product. It's widely supported with deep documentation and a large community. But for me, it wasn't customizable enough. When we started with simple charts, it was great, but as we got deeper and more complex, our needs outgrew the library. If I was going forward, I would choose a more barebones library with more freedom and extensibility.
A de minimis incentive was given to thank the reviewer for their time. The incentive was not used to bias or drive a particular response, nor was the incentive contingent on a positive endorsement. More Info
Google Charts is about as easy to use as the rest of their applications. The UI is very well thought out, allowing you to add what you need, and customize it to your exact liking. The default theme is actually really nice, which helps as most of the time, customizing is not needed.
A de minimis incentive was given to thank the reviewer for their time. The incentive was not used to bias or drive a particular response, nor was the incentive contingent on a positive endorsement. More Info
To me Jedox deserves 10/10 because it is a consistent one-in-all platform with a modern look and feel. It is intuitive to use and allows you to make intuitive applications integrating traditional business intelligence with performance management functionality. It certainly has a short learning curve, especially for those that are familiar with MS Excel. An example: I've lost count but Jedox it is available in more than 25 languages. Another: Jedox does not require programming skills... it is developed to be used by the business.
Jedox has very few bugs. Reports are available through an Excel add-in, the web and/or mobile device (IOS/Android). In my opinion, availability also means high performance, not having to wait for the system to give you the required reports, analysis, dashboards instantly.
As a free tool with massively powerful, infinitely customisable charts that can be dynamically updated - Google Charts is my favourite data visualisation tool. However, my hatred of JavaScript does jade my view on it. This is the price of the tool though, and I'm glad it's available for me.
A de minimis incentive was given to thank the reviewer for their time. The incentive was not used to bias or drive a particular response, nor was the incentive contingent on a positive endorsement. More Info
Jedox support in general is a professional and fast responding team. An easy-to-use ticketing system is in place. Bug-related questions are solved fast (responses come usually in a few hours after the question), but some questions / tickets, that are not Jedox-related bugs (for example some advanced questions about Jedox functionality), may be forwarded to Application Management team for further processing and then it may take several days or even weeks to get a response here -> there is room for improvement here.
The implementation of SSO, SAML Authentication, HTTPS, Server splitting (Frontend / Backend servers) could be more standardized and made more user friendly to set up (e.g. via setup guide). Otherwise the implementation of Jedox is quick and simple when compared to other similar technologies.
Google Charts stacks up better since it is free and does not have the constant pressure for cost overruns, add-ons, annual maintenance and implementation services. The speed of using Google Charts is quick, saving users potentially weeks in getting up and going. For the readers of websites with limited resources, the application shows up nicely is look and feel with charts. Great way of showing data visually.
A de minimis incentive was given to thank the reviewer for their time. The incentive was not used to bias or drive a particular response, nor was the incentive contingent on a positive endorsement. More Info
Calumo is similar product to Jedox. I have used it extensively in my previous role. It was a major contender when we evaluated a BI platform for NIDA. Calumo is a great product as well and it was a very close call. Where we found Jedox to be a better fit for NIDA was the ability to prepare dynamic reports with ease without the need to learn MDX which was used extensively by Calumo to make dynamic reports which expand or shrink based on the underlying data. Another major benefit we saw in Jedox was the whole ETL process could be managed within Jedox instead of doing it in SQL server which negates having a dedicated SQL specialist role when the scale expands.
A de minimis incentive was given to thank the reviewer for their time. The incentive was not used to bias or drive a particular response, nor was the incentive contingent on a positive endorsement. More Info
Scalability is often another word for speed. Given enough data, enough users or enough calculations, the tool becomes slower and slower. You will find that Jedox has a very high performance that can even be increased by the use of grafical cards. Other thaen that it does not only offer BI (looking back based on historical ERP data) but also allows you to look forward through integrated budgetting, planning, forecasting, workflow and collaboration. Not easy to find a tool that can support so much business functionality. So, also pretty scalable in that respect.
A de minimis incentive was given to thank the reviewer for their time. The incentive was not used to bias or drive a particular response, nor was the incentive contingent on a positive endorsement. More Info
Financial budgeting and Forecasting are done in a centralized fashion in Jedox now instead of a decentralized excel based approach. A lot of cost savings and improved reliability
Easy to use self-help Dashboards and detailed reports
A de minimis incentive was given to thank the reviewer for their time. The incentive was not used to bias or drive a particular response, nor was the incentive contingent on a positive endorsement. More Info