Chose Grafana Cloud
Datadog
| Product | Rating | Most Used By | Product Summary | Starting Price |
|---|---|---|---|---|
 Grafana Cloud | N/A | Grafana Cloud is a fully managed Observability Platform designed to aggregate, visualize, and analyze telemetry data across distributed architectures. The platform provides a unified environment for Metrics, Logs, Traces, and Continuous Profiling, utilizing the LGTM (Loki, Grafana, Tempo, Mimir) and Pyroscope stack to provide high-cardinality analysis of system state. | $8 per month up to 1 active user | |
 PingPlotter | N/A | PingPlotter is a graphical traceroute and ping tool that visualizes network performance in a way that makes identifying the source of problems quicker and easier for everyone from online gamers and video streamers to VoIP admins and IT pros. Features for remote deployment, network monitoring, scripting, and a web interface are included along with several additional capabilities. | $0 per user |
| Grafana Cloud | PingPlotter | |||||||||||||||
|---|---|---|---|---|---|---|---|---|---|---|---|---|---|---|---|---|
| Editions & Modules |
|
| ||||||||||||||
| Offerings |
| |||||||||||||||
| Entry-level Setup Fee | No setup fee | No setup fee | ||||||||||||||
| Additional Details | — | — | ||||||||||||||
| More Pricing Information | ||||||||||||||||
| Grafana Cloud | PingPlotter | |
|---|---|---|
| Considered Both Products | Grafana Cloud  ANurag Tamrakar Software Engineer - DevOps Chose Grafana Cloud Kibana and Foglight  Matthew Goodhall infastructure consultant Chose Grafana Cloud Grafana has a direct plugin to Icinga monitoring solution and allowed for easy configuration for us. At the time of implementation, other services did not have such an integration. As we already had a very customized and heavily introduced monitoring solution in place, we … |  PingPlotter  Chase Grimes Senior Technical Consultant Chose PingPlotter There program is unmatched for what it does, I wouldn't even recommend to myself trying another.  Martin Vandepas Hardware Engineer Chose PingPlotter Wireshark doesn't have this functionality and the commandline ping tool built into windows doesn't do plots.  Fraser Clark Network Engineer Chose PingPlotter I have tried a few free products and some paid ones but never really did what I wanted. I just needed a simple, always-on link monitor specifically with a traceroute element and this is what PingPlotter delivers. The others were either overly complex or too expensive, some just … |
| Grafana Cloud | PingPlotter | ||||||||||||||||||
|---|---|---|---|---|---|---|---|---|---|---|---|---|---|---|---|---|---|---|---|
| Network Performance Monitoring |
|
| Grafana Cloud | PingPlotter | |
|---|---|---|
| Small Businesses |  Amazon CloudWatch Score 7.7 out of 10 |  NinjaOne Score 9.0 out of 10 |
| Medium-sized Companies |  ManageEngine Site24x7 Score 10.0 out of 10 |  SolarWinds NetFlow Traffic Analyzer (NTA) Score 9.2 out of 10 |
| Enterprises | ManageEngine Site24x7 Score 10.0 out of 10 | SolarWinds NetFlow Traffic Analyzer (NTA) Score 9.2 out of 10 |
| All Alternatives | View all alternatives | View all alternatives |
| Grafana Cloud | PingPlotter | |
|---|---|---|
| Likelihood to Recommend | 9.4 (0 ratings) | 8.9 (0 ratings) |
| Usability | 9.6 (0 ratings) | 9.1 (0 ratings) |
| Support Rating | - (0 ratings) | 9.0 (0 ratings) |
| Grafana Cloud | PingPlotter | |
|---|---|---|
| Likelihood to Recommend |
|
|
| Pros |
|
|
| Cons |
|
Martin Vandepas Hardware Engineer |
| Usability |
|
|
| Support Rating | No answers on this topic |
Fraser Clark Network Engineer |
| Alternatives Considered |
|
|
| Return on Investment |
ANurag Tamrakar Software Engineer - DevOps |
|
| ScreenShots | PingPlotter Screenshots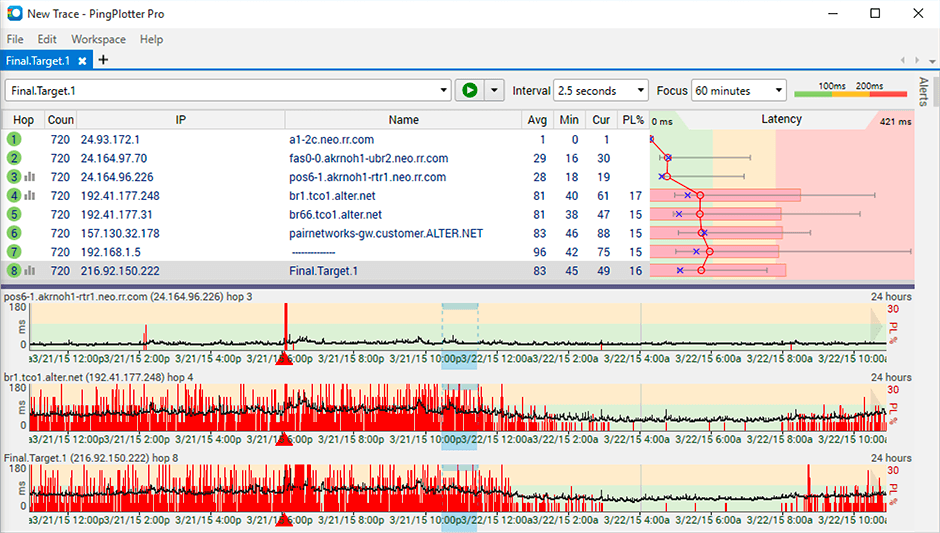   |