TrustRadius: an HG Insights company

Hashboard (discontinued) vs. Jama Analyze (Discontinued)

Save this comparison

Save this comparison

Add Product

Recommended Comparisons

    Overview
    ProductRatingMost Used ByProduct SummaryStarting Price

    Hashboard (discontinued)

    Score8 out of 10
    N/AHashboard (formerly Glean.io) was lightweight, business intelligence tool. It was acquired by Hex in 2025, and former users are encouraged to move to Hex.N/A

    Jama Analyze (Discontinued)

    Score8 out of 10
    Mid-Size Companies (51-1,000 employees)
    Jama Analyze (formerly called Notion) was a solution for quickly creating shareable, custom dashboards. However, the product is no longer available. Jama Software sunset the Analyze product in 2019. Some of the benefits of Jama Analyze included the ability to: Create custom metrics across all teams with data from any source with the intuitive metric builder. Experience self-serve BI with no coding and no IT to get started making custom dashboards.…

    $23

    per month

    Pricing
    Hashboard (discontinued)Jama Analyze (Discontinued)
    Editions & Modules
    No answers on this topic
    Starter Teams - 2 users
    $23
    per month
    Small Teams - 5 users
    $89
    per month
    Growing Teams - 10 users
    $179
    per month
    Growing Teams - 15 users
    $259
    per month
    Growing Teams - 20 users
    $339
    per month
    Offerings
    Pricing Offerings
    Hashboard (discontinued)Jama Analyze (Discontinued)
    Free Trial
    NoYes
    Free/Freemium Version
    NoNo
    Premium Consulting/Integration Services
    NoNo
    Entry-level Setup FeeNo setup feeNo setup fee
    Additional Details15% discount for yearly pricing.—
    More Pricing Information
    Features
    Hashboard (discontinued)Jama Analyze (Discontinued)
    BI Standard Reporting
    Comparison of BI Standard Reporting features of Hashboard (discontinued) and Jama Analyze (Discontinued)
    Feature
    Hashboard (discontinued)
    -
    Ratings
    Jama Analyze (Discontinued)
    9.3
    1 Ratings
    13% above category average
    Pixel Perfect reports00 Ratings9.01 Ratings
    Customizable dashboards00 Ratings10.01 Ratings
    Report Formatting Templates00 Ratings9.01 Ratings
    Ad-hoc Reporting
    Comparison of Ad-hoc Reporting features of Hashboard (discontinued) and Jama Analyze (Discontinued)
    Feature
    Hashboard (discontinued)
    -
    Ratings
    Jama Analyze (Discontinued)
    8.0
    1 Ratings
    0% below category average
    Report sharing and collaboration00 Ratings8.01 Ratings
    Report Output and Scheduling
    Comparison of Report Output and Scheduling features of Hashboard (discontinued) and Jama Analyze (Discontinued)
    Feature
    Hashboard (discontinued)
    -
    Ratings
    Jama Analyze (Discontinued)
    7.0
    1 Ratings
    16% below category average
    Publish to Web00 Ratings7.01 Ratings
    Report Versioning00 Ratings7.01 Ratings
    Data Discovery and Visualization
    Comparison of Data Discovery and Visualization features of Hashboard (discontinued) and Jama Analyze (Discontinued)
    Feature
    Hashboard (discontinued)
    -
    Ratings
    Jama Analyze (Discontinued)
    10.0
    1 Ratings
    22% above category average
    Pre-built visualization formats (heatmaps, scatter plots etc.)00 Ratings10.01 Ratings
    Access Control and Security
    Comparison of Access Control and Security features of Hashboard (discontinued) and Jama Analyze (Discontinued)
    Feature
    Hashboard (discontinued)
    -
    Ratings
    Jama Analyze (Discontinued)
    7.7
    1 Ratings
    10% below category average
    Multi-User Support (named login)00 Ratings8.01 Ratings
    Role-Based Security Model00 Ratings7.01 Ratings
    Multiple Access Permission Levels (Create, Read, Delete)00 Ratings8.01 Ratings
    Mobile Capabilities
    Comparison of Mobile Capabilities features of Hashboard (discontinued) and Jama Analyze (Discontinued)
    Feature
    Hashboard (discontinued)
    -
    Ratings
    Jama Analyze (Discontinued)
    6.5
    1 Ratings
    17% below category average
    Responsive Design for Web Access00 Ratings7.01 Ratings
    Dashboard / Report / Visualization Interactivity on Mobile00 Ratings6.01 Ratings
    Application Program Interfaces (APIs) / Embedding
    Comparison of Application Program Interfaces (APIs) / Embedding features of Hashboard (discontinued) and Jama Analyze (Discontinued)
    Feature
    Hashboard (discontinued)
    -
    Ratings
    Jama Analyze (Discontinued)
    6.0
    1 Ratings
    26% below category average
    REST API00 Ratings6.01 Ratings
    Best Alternatives
    Hashboard (discontinued)Jama Analyze (Discontinued)
    Small Businesses
    Cyfe
    Score4 out of 10
    Cyfe
    Score4 out of 10
    Medium-sized Companies
    Qlik Cloud Analytics (Qlik Sense)
    Score8.1 out of 10
    Qlik Cloud Analytics (Qlik Sense)
    Score8.1 out of 10
    Enterprises
    Jaspersoft Community Edition
    Score7 out of 10
    Jaspersoft Community Edition
    Score7 out of 10
    All AlternativesView all alternativesView all alternatives
    User Ratings
    Hashboard (discontinued)Jama Analyze (Discontinued)
    Likelihood to Recommend
    7.5
    (2 ratings)
    8.0
    (1 ratings)
    Data Sharing and Collaboration
    -
    (0 ratings)
    9.0
    (1 ratings)
    Data Sources
    -
    (0 ratings)
    8.0
    (1 ratings)
    User Testimonials
    Hashboard (discontinued)Jama Analyze (Discontinued)
    Likelihood to Recommend
    Discontinued Products
    Glean.io is exceptionally well for creating automation data visualisation dashboards. Exploring the data is again highly effective. Visualisations are easily customisable to best suit the requirements of the team. Collaborating and commenting around the dashboards is very smooth. If there are any changes in the system or any feature requests, the support team takes some time to respond
    Incentivized
    Read full review
    Jama Software
    The integration with JIRA is quite a handy tool to have. It allows for team progress to be easily tracked and visualized using the software while key metrics are brought to the forefront through the software's business intelligence. It makes presenting data and milestones achieved to non-technical management quite simple and can be extremely useful.
    Incentivized
    Read full review
    Pros
    Discontinued Products
    • Workflow is easy and clear due to clean and state of the art interface
    • Model creation is easy
    • Possibility for custom SQL code for database connection is very helpful
    Incentivized
    Read full review
    Jama Software
    • This allows us to keep track of our team's work by integrating with our product boards on JIRA.
    • It allows us to create visualized reports for our team's progress.
    • It allows us to gain insights about things that are going well in our product pipeline as well as potential areas of concern based on the data that is collected.
    Incentivized
    Read full review
    Cons
    Discontinued Products
    • Querying has to be done by users only. There can be ways to automate querying using templates
    • Not able to clearly check the query run time
    • The customer support team can be little more proactive while communicating any changes and resolving any queries
    Incentivized
    Read full review
    Jama Software
    • The service tends to be slow at times and working offline can be a pain.
    • It has a bit of a learning curve when you start out.
    • The price is quite high for the features it offers.
    Incentivized
    Read full review
    Alternatives Considered
    Discontinued Products
    For simple use cases, Glean.io is a lightweight alternative to SAP Analytics Cloud. Provisioning, testing, and documentation are easier and less intimidating in the Glean.io case. Thus, it is easy to explore without firing up the sales machinery of the big corporates. Thus, the process of looking into and testing it out was way more convenient. Further, the data ops features were new to use and seem to be unique with Glean.io.
    Incentivized
    Read full review
    Jama Software
    Jama Analyze, as well as Asana, connect with JIRA to visualize milestone tracking and team progress. While Asana is cheaper, Jama Analyze provides better reports and visual data. Google Data Studio, through a bit of tinkering from your software development team, can achieve similar results, however, the charts and graphs leave a bit to be desired in terms of design. In all, Jama Analyze is great if you have few users and don't need to go for the licensing option. Otherwise, there are definitely cheaper options available but you may have to sacrifice on performance and look-and-feel.
    Incentivized
    Read full review
    Return on Investment
    Discontinued Products
    • Optimised the DB management team by 30%
    • Reduce in data visualisation dashboards TAT by 50%
    • Increase in revenues and savings by 20%
    Incentivized
    Read full review
    Jama Software
    No answers on this topic
    ScreenShots

    Jama Analyze (Discontinued) Screenshots

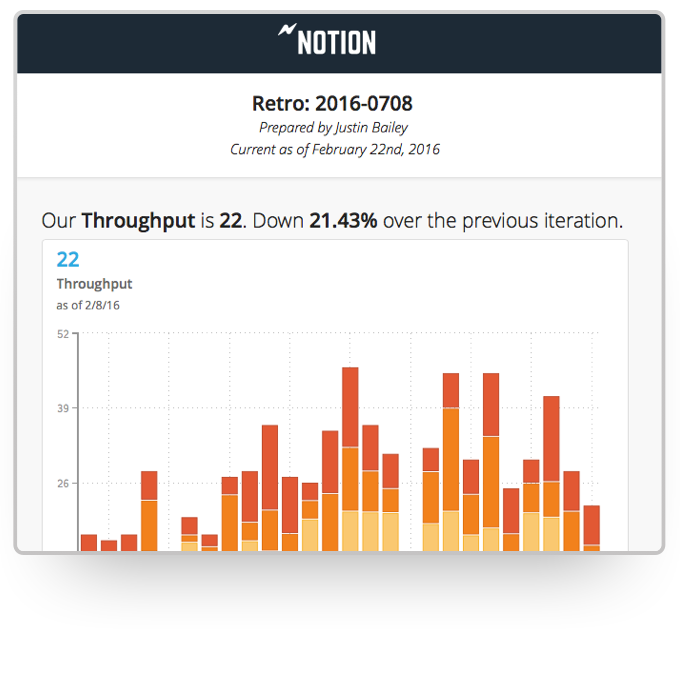
    Screenshot of An example of a Notion dashboard with custom team metrics, a variety of visualizations, and summaries of the data at the top of each card.Screenshot of The Notion directory is where metrics from all your data sources live, making it easy to compare and combine. Give your team a single source of truth for the metrics that matter most.Screenshot of You can also assign metric ownership to members of your team. They'll got automatic reminders to report the data.Screenshot of Build custom metrics and quickly change how they're visualized or the reporting interval.Screenshot of Every metric has built-in commenting to help you capture context around the data.Screenshot of One click reporting means it's easy to share important team or product performance data with key stakeholders.