IBM SPSS Modeler vs. Lightning Tools Data Viewer

Overview
ProductRatingMost Used ByProduct SummaryStarting Price
IBM SPSS Modeler
Score 7.8 out of 10
N/A
IBM SPSS Modeler is a visual data science and machine learning (ML) solution designed to help enterprises accelerate time to value by speeding up operational tasks for data scientists. Organizations can use it for data preparation and discovery, predictive analytics, model management and deployment, and ML to monetize data assets.
$499
per month
Lightning Tools Data Viewer
Score 9.1 out of 10
Mid-Size Companies (51-1,000 employees)
The Data Viewer provides data visualization in the form of reports or charts that can be created and customized to suit a business's needs. Silos of data exist in most organizations and yet contain valuable insights into how well the organization is performing and where action is needed. Those silos often include Microsoft Excel workbooks, Microsoft SQL Azure databases, On-Premises data sources accessible through OData or Business Connectivity Services and even SharePoint Lists. These data…
$1,250
per year per installation
Pricing
IBM SPSS ModelerLightning Tools Data Viewer
Editions & Modules
IBM SPSS Modeler Personal
4,670
per year
IBM SPSS Modeler Professional
7,000
per year
IBM SPSS Modeler Premium
11,600
per year
IBM SPSS Modeler Gold
contact IBM
per year
Data Viewer OnPrem
$1,000
per year Per installation, 1 x WFE
Data Viewer Online
$1,250
per year per installation
Data Viewer OnPrem Enterprise Edition
POA
per year Per installation, 4+ WFE
Data Viewer Online Enterprise Edition
POA
per year per installation
Offerings
Pricing Offerings
IBM SPSS ModelerLightning Tools Data Viewer
Free Trial
YesYes
Free/Freemium Version
NoNo
Premium Consulting/Integration Services
YesNo
Entry-level Setup FeeOptionalNo setup fee
Additional DetailsIBM SPSS Modeler Personal enables users to design and build predictive models right from the desktop. IBM SPSS Modeler Professional extends SPSS Modeler Personal with enterprise-scale in-database mining, SQL pushback, collaboration and deployment, champion/challenger, A/B testing, and more. IBM SPSS Modeler Premium extends SPSS Modeler Professional by including unstructured data analysis with integrated, natural language text and entity and social network analytics. IBM SPSS Modeler Gold extends SPSS Modeler Premium with the ability to build and deploy predictive models directly into the business process to aid in decision making. This is achieved with Decision Management which combines predictive analytics with rules, scoring, and optimization to deliver recommended actions at the point of impact.Prices stated are minimum per installation for "stock" products. Enterprise editions can be amended to suit business needs if deemed necessary, additional costs incurred and TBD. All packages include free technical support. Free upgrades available to latest versions of tool as they are released. (online version)
More Pricing Information
Community Pulse
IBM SPSS ModelerLightning Tools Data Viewer
Top Pros

No answers on this topic

Top Cons

No answers on this topic

Features
IBM SPSS ModelerLightning Tools Data Viewer
BI Standard Reporting
Comparison of BI Standard Reporting features of Product A and Product B
IBM SPSS Modeler
-
Ratings
Lightning Tools Data Viewer
9.1
1 Ratings
8% above category average
Customizable dashboards00 Ratings9.11 Ratings
Report Formatting Templates00 Ratings9.11 Ratings
Ad-hoc Reporting
Comparison of Ad-hoc Reporting features of Product A and Product B
IBM SPSS Modeler
-
Ratings
Lightning Tools Data Viewer
8.2
1 Ratings
2% above category average
Drill-down analysis00 Ratings6.41 Ratings
Formatting capabilities00 Ratings9.11 Ratings
Report sharing and collaboration00 Ratings9.11 Ratings
Data Discovery and Visualization
Comparison of Data Discovery and Visualization features of Product A and Product B
IBM SPSS Modeler
-
Ratings
Lightning Tools Data Viewer
3.6
1 Ratings
78% below category average
Pre-built visualization formats (heatmaps, scatter plots etc.)00 Ratings3.61 Ratings
Best Alternatives
IBM SPSS ModelerLightning Tools Data Viewer
Small Businesses
Saturn Cloud
Saturn Cloud
Score 9.1 out of 10
IBM SPSS Modeler
IBM SPSS Modeler
Score 7.8 out of 10
Medium-sized Companies
Mathematica
Mathematica
Score 8.2 out of 10
Mathematica
Mathematica
Score 8.2 out of 10
Enterprises
Posit
Posit
Score 9.1 out of 10
IBM SPSS Modeler
IBM SPSS Modeler
Score 7.8 out of 10
All AlternativesView all alternativesView all alternatives
User Ratings
IBM SPSS ModelerLightning Tools Data Viewer
Likelihood to Recommend
10.0
(6 ratings)
9.1
(1 ratings)
Support Rating
10.0
(1 ratings)
-
(0 ratings)
User Testimonials
IBM SPSS ModelerLightning Tools Data Viewer
Likelihood to Recommend
IBM
Fast NLP analytics are very easy in SPSS Modeler because there is a built-in interface for classifying concepts and themes and several pre-built models to match the incoming text source. The visualizations all match and help present NLP information without substantial coding, typically required for word clouds and such. SPSS Modeler is good at attaining results faster in general, and the visual nature of the code makes a good tool to have in the data science team's repository. For younger data scientists, and those just interested, it is a good tool to allow for exploring data science techniques.
Read full review
Lightning Tools
Lightning Tools Data Viewer is well suited for re-surfacing data and customizing its look and feel.
Read full review
Pros
IBM
  • Combine text and data
  • Provide facilities for all phases of the data mining process.
  • Use a node and stream paradigm to easily and quickly create models.
Read full review
Lightning Tools
  • Shows Lists created on different sites to be seen and controlled on another site in a Tenant
  • Allows selection of layouts and coloring way beyond what other programs do.
  • Easy to learn and very functional.
Read full review
Cons
IBM
  • Has very old style graphs, with lots of limitations.
  • Some advanced statistical functions cannot be done through the menu.
  • The data connectivity is not that extensive.
  • It's an expensive tool.
Read full review
Lightning Tools
  • Data Viewer has a graph feature that is old school flat design. We loved the In House real 3D graph Lightning Tools program.
Read full review
Support Rating
IBM
The online support board is helpful and the free add ons are incredibly appreciated.
Read full review
Lightning Tools
No answers on this topic
Alternatives Considered
IBM
When it comes to investigation and descriptive we have found SPSS Statistics to be the tool of choice, but when it comes to projects with large and several datasets SPSS Modeler has been picked from our customers.
Read full review
Lightning Tools
Lightning Tools Data Viewer is much easier and more powerful than Infowise similar viewer in their lineup. In this case, we use Data Viewer over the one offered by Infowise.
Read full review
Return on Investment
IBM
  • Positive - Ease of decision making and reduction in product life cycle time.
  • Positive - Gives entirely new perspective with the help of right team. Helps expanding the portfolio.
  • Negative - Needs to have good understanding about mathematical modelling, of which talent is rare and expensive. Hence, increase the costs for R&D and manpower.
Read full review
Lightning Tools
  • It allows us to do things that would take a great deal more time to duplicate in SharePoint
  • It cuts down on ugly looking built in SP list layouts
  • Users find it easy to access, thus this product is more productive
Read full review
ScreenShots

IBM SPSS Modeler Screenshots

Screenshot of Use a single run to test multiple modeling methods, compare results and select which model to deploy. Quickly choose the best performing algorithm based on model performance.Screenshot of Explore geographic data, such as latitude and longitude, postal codes and addresses. Combine it with current and historical data for better insights and predictive accuracy.Screenshot of Capture key concepts, themes, sentiments and trends by analyzing unstructured text data. Uncover insights in web activity, blog content, customer feedback, emails and social media comments.Screenshot of Use R, Python, Spark, Hadoop and other open source technologies to amplify the power of your analytics. Extend and complement these technologies for more advanced analytics while you keep control.

Lightning Tools Data Viewer Screenshots
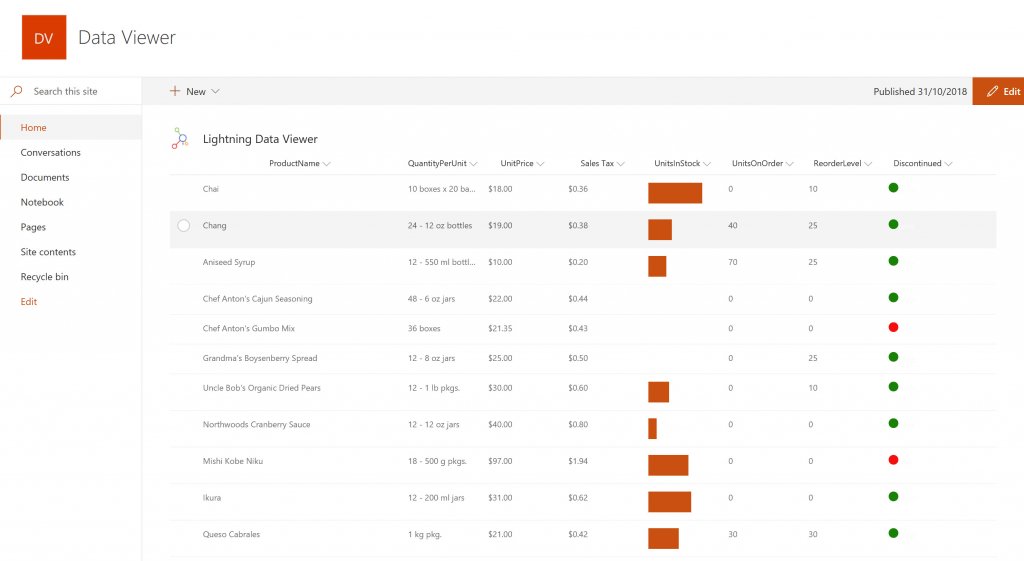
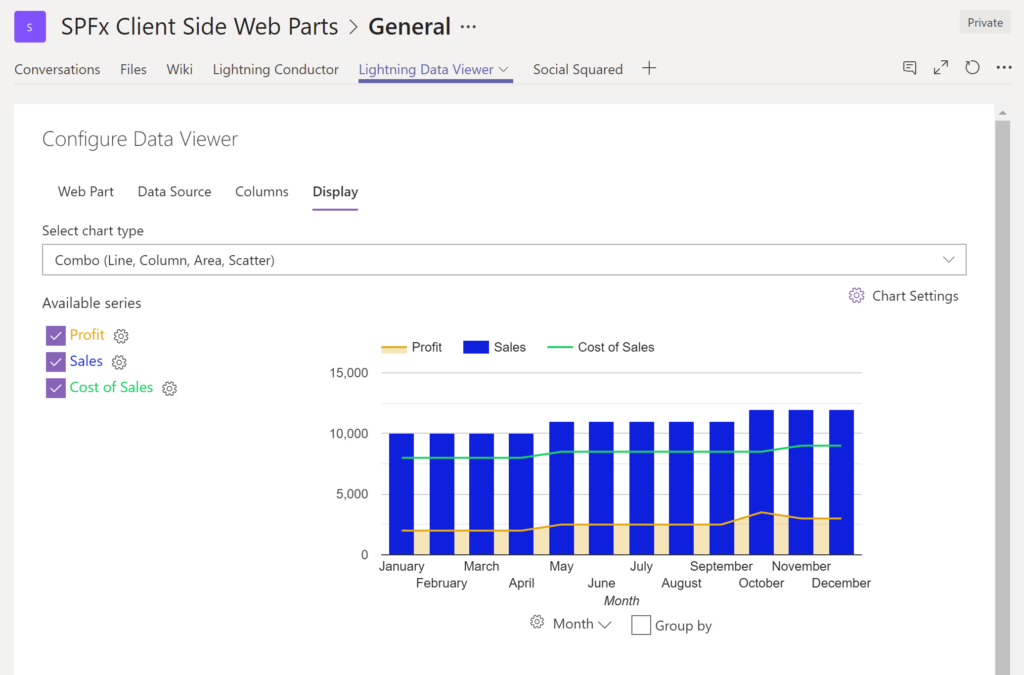
Screenshot of DISPLAYING EXTERNAL DATA WITHIN SHAREPOINT OR MICROSOFT TEAMS
The Data Viewer Client Side Web Part can be configured by Business Users within a few minutes to display Line of Business Data from Data Sources such as Excel,  SQL Azure, Business Connectivity Services, OData and SharePoint Lists.  Connections to an organizations data such as Customer Relationship Management Systems, Accounting Systems, or Custom Databases can be connected, giving business users a live up-to-date view of business information within the context of their SharePoint Team Sites or Microsoft Teams Tabs.Screenshot of HIGHLIGHTING KEY BUSINESS DATA (NO CODE)
Conditional formatting can be used to highlight key business data. Overdue Tasks, Low Stock, Currency Exchange Rates, Sales Revenue are examples of data to highlight visually allowing for a quick reaction time. Key Financial Indicators and Key Performance Indicators can be configured with a simple dialog and no need to write any code. Choose colours, icons or data bars to highlight key data.Screenshot of SELECTING AND STYLING ICONS
Icons can be chosen as part of the conditional formatting to make data stand out. The Office 365 Fabric icons can be selected and styled and applied to cell values. Pepper pots, Smileys, Envelopes and more icons are available. There are hundreds of options to choose from to highlight data that needs to be acted upon.Screenshot of DATA VIEWER CAN BE A GRID OF DATA OR A CHART IN SHAREPOINT OR MICROSOFT TEAMS
The Data Viewer can be used within Microsoft SharePoint Modern Sites or Microsoft Teams Tabs as a Grid of Data with styling or as a Chart which can be configured. The Charting Feature allows for Pie, Donut, Column, Line, Area, and Scatter Charts which can all be configured and displayed in 2D or 3D.Screenshot of TREEMAPS
summary information can be displayed within a TreeMap next to the detail. Users will be able to see trends, and how the business is performing  using the TreeMap view of data.Screenshot of CHARTS AND GAUGES
The Data Viewer is used to represent data in multiple ways using Gauges, TreeMaps, Multiple Series Charts, and Pie Charts.