iCharts vs. Tableau Public
iCharts vs. Tableau Public
| Product | Rating | Most Used By | Product Summary | Starting Price |
|---|---|---|---|---|
 iCharts | Mid-Size Companies (51-1,000 employees) | iCharts is a Business Intelligence and Analytics solution for NetSuite. With this solution, users can transform their NetSuite data into interactive, real-time analytics without leaving their NetSuite dashboard. iCharts includes drag-and-drop chart creation and best-practice templates. The vendor’s value proposition is that iCharts accelerates an organization’s analytics strategy by empowering their team with the critical data-driven tools they need. | $10,000 per installation | |
 Tableau Public | N/A | Tableau Public is a free edition of the Desktop product. With this edition, data can only be published to the Tableau public website and does not allow work to be saved or exported locally. | $0 per month |
| iCharts | Tableau Public | |||||||||||||||
|---|---|---|---|---|---|---|---|---|---|---|---|---|---|---|---|---|
| Editions & Modules |
| No answers on this topic | ||||||||||||||
| Offerings |
| |||||||||||||||
| Entry-level Setup Fee | $3,000 per installation | No setup fee | ||||||||||||||
| Additional Details | Based on number of NetSuite licenses | — | ||||||||||||||
| More Pricing Information | ||||||||||||||||
| iCharts | Tableau Public |
|---|
| iCharts | Tableau Public | ||||||||||||||||||
|---|---|---|---|---|---|---|---|---|---|---|---|---|---|---|---|---|---|---|---|
| BI Standard Reporting |
| ||||||||||||||||||
| Ad-hoc Reporting |
| ||||||||||||||||||
| Report Output and Scheduling |
| ||||||||||||||||||
| Data Discovery and Visualization |
| ||||||||||||||||||
| Access Control and Security |
| ||||||||||||||||||
| Mobile Capabilities |
|
| iCharts | Tableau Public | |
|---|---|---|
| Small Businesses |  Yellowfin Score 8.7 out of 10 |  Supermetrics Score 9.7 out of 10 |
| Medium-sized Companies |  Reveal Score 10.0 out of 10 | Supermetrics Score 9.7 out of 10 |
| Enterprises |  Kyvos Semantic Layer Score 9.5 out of 10 |  IBM Analytics Engine Score 7.2 out of 10 |
| All Alternatives | View all alternatives | View all alternatives |
| iCharts | Tableau Public | |
|---|---|---|
| Likelihood to Recommend | 8.0 (2 ratings) | 8.5 (14 ratings) |
| Likelihood to Renew | - (0 ratings) | 9.1 (2 ratings) |
| Usability | - (0 ratings) | 10.0 (5 ratings) |
| Support Rating | - (0 ratings) | 9.6 (6 ratings) |
| Online Training | - (0 ratings) | 9.0 (1 ratings) |
| Implementation Rating | - (0 ratings) | 9.1 (2 ratings) |
| iCharts | Tableau Public | |
|---|---|---|
| Likelihood to Recommend | iCharts, Inc.
| Tableau
|
| Pros | iCharts, Inc.
| Tableau
 Leah Jakaitis Senior Data Analyst |
| Cons | iCharts, Inc.
| Tableau
 Steven Bohlender Executive Vice President |
| Likelihood to Renew | iCharts, Inc. No answers on this topic | Tableau
 Bonnie Holub Honeywell Endowed Chair in Global Technology Management |
| Usability | iCharts, Inc. No answers on this topic | Tableau |
| Support Rating | iCharts, Inc. No answers on this topic | Tableau
|
| Online Training | iCharts, Inc. No answers on this topic | Tableau
Bonnie Holub Honeywell Endowed Chair in Global Technology Management |
| Implementation Rating | iCharts, Inc. No answers on this topic | Tableau
Steven Bohlender Executive Vice President |
| Alternatives Considered | iCharts, Inc.
| Tableau
|
| Return on Investment | iCharts, Inc. No answers on this topic | Tableau
 Christopher Penn Chief Data Scientist |
| ScreenShots | iCharts Screenshots 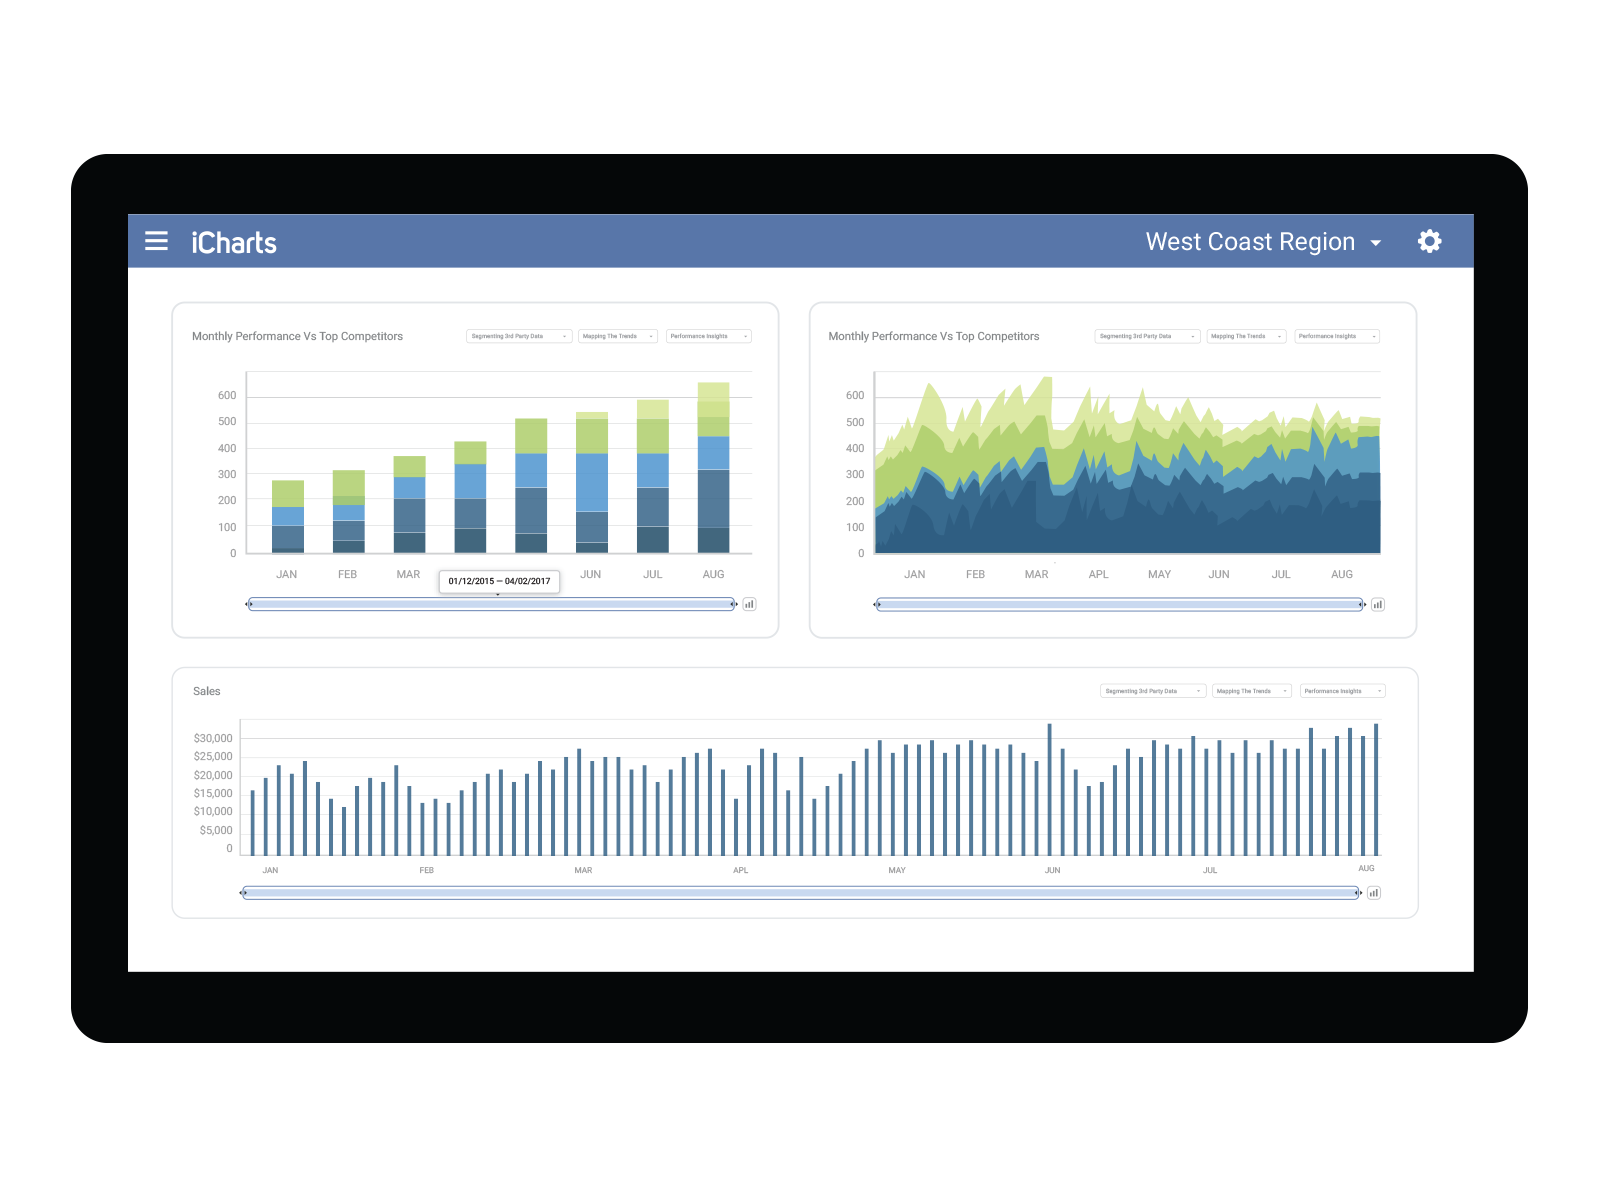 |