IDERA SQL Diagnostic Manager vs. Talend Data Fabric
IDERA SQL Diagnostic Manager vs. Talend Data Fabric
| Product | Rating | Most Used By | Product Summary | Starting Price |
|---|---|---|---|---|
 IDERA SQL Diagnostic Manager | N/A | SQL Diagnostic Manager for Microsoft SQL Server helps database administrators to find and fix Microsoft SQL Server performance problems in physical, virtual, and cloud environments. Unlike its competition, it provides effective scalability, advanced SQL query analysis and optimization, prescriptive analysis with corrective SQL scripts, powerful automated alert responses, broad PowerShell integration, complete customization, and extensive support for current and legacy Microsoft SQL Server and… | $1,996 per instance with first year maintenance included | |
 Talend Data Fabric | N/A | The Talend Data Fabric helps organizations to achieve and maintain complete, trustworthy, and uncompromised data, so that they can stay in control, mitigate risk, and drive value. | N/A |
| IDERA SQL Diagnostic Manager | Talend Data Fabric | |||||||||||||||
|---|---|---|---|---|---|---|---|---|---|---|---|---|---|---|---|---|
| Editions & Modules |
| No answers on this topic | ||||||||||||||
| Offerings |
| |||||||||||||||
| Entry-level Setup Fee | No setup fee | No setup fee | ||||||||||||||
| Additional Details | — | — | ||||||||||||||
| More Pricing Information | ||||||||||||||||
| IDERA SQL Diagnostic Manager | Talend Data Fabric |
|---|
| IDERA SQL Diagnostic Manager | Talend Data Fabric | ||||||||||||||||||
|---|---|---|---|---|---|---|---|---|---|---|---|---|---|---|---|---|---|---|---|
| SQL Performance Monitoring |
|
| IDERA SQL Diagnostic Manager | Talend Data Fabric | |
|---|---|---|
| Small Businesses | No answers on this topic | No answers on this topic |
| Medium-sized Companies |  Redgate Monitor Score 8.0 out of 10 | No answers on this topic |
| Enterprises | Redgate Monitor Score 8.0 out of 10 |  Oracle GoldenGate Score 8.7 out of 10 |
| All Alternatives | View all alternatives | View all alternatives |
| IDERA SQL Diagnostic Manager | Talend Data Fabric | |
|---|---|---|
| Likelihood to Recommend | 9.0 (8 ratings) | 9.6 (7 ratings) |
| Likelihood to Renew | - (0 ratings) | 8.0 (1 ratings) |
| Usability | - (0 ratings) | 7.0 (1 ratings) |
| Support Rating | - (0 ratings) | 10.0 (1 ratings) |
| IDERA SQL Diagnostic Manager | Talend Data Fabric | |
|---|---|---|
| Likelihood to Recommend | Idera, Inc.
|  Qlik
|
| Pros | Idera, Inc.
 Greg Goss SQL Database and Business Intelligence Manager | Qlik
 Ankit Goyal Technical Consultant |
| Cons | Idera, Inc.
 Steven Gockley, MBA, MCSA DBA / Sr. Data Analyst | Qlik
 Majd Izadian (majd.izadian@zendeux.com) Managing Partner & CEO - Big Data, MDM, Data Quality |
| Likelihood to Renew | Idera, Inc. No answers on this topic | Qlik
Majd Izadian (majd.izadian@zendeux.com) Managing Partner & CEO - Big Data, MDM, Data Quality |
| Usability | Idera, Inc. No answers on this topic | Qlik
 Charlotte Byrne Brown Robotic Process Automation Manager |
| Support Rating | Idera, Inc. No answers on this topic | Qlik
Charlotte Byrne Brown Robotic Process Automation Manager |
| Alternatives Considered | Idera, Inc.
 José Javier Dominguez Reina Jefe de Proyecto | Qlik
 Victor Cáceres Database Administrator (DBA) |
| Return on Investment | Idera, Inc.
| Qlik
|
| ScreenShots | IDERA SQL Diagnostic Manager Screenshots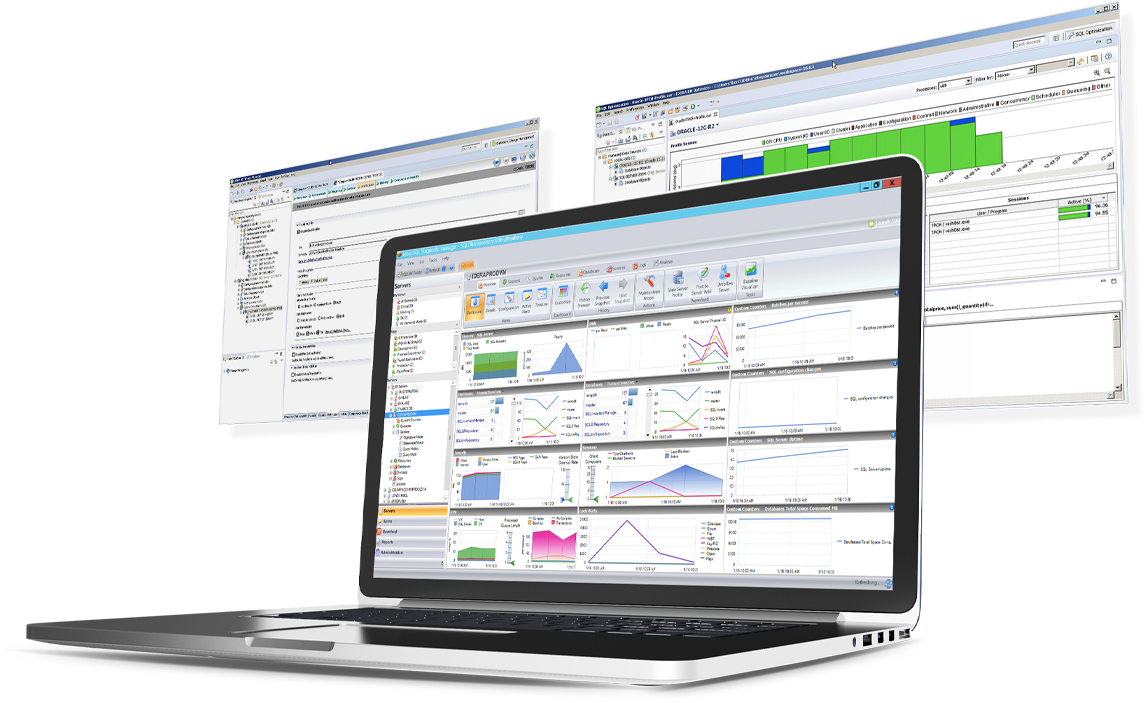 |