TrustRadius: an HG Insights company

Save this comparison

Save this comparison

Add Product

Recommended Comparisons

    Overview
    ProductRatingMost Used ByProduct SummaryStarting Price

    Izenda

    Score10 out of 10
    Small Businesses (1-50 employees)
    Izenda is a business intelligence software offering from Izenda.N/A

    Plotly Chart Studio

    Score8 out of 10
    N/APlotly headquartered in Montreal offers Chart Studio, a data visualization tool with an open source and free cloud editions, as well as enterprise editions deployable on-cloud or on-premise. The vendor describes Chart Studio as a sophisticated editor for creating D3.js and WebGL charts.

    $99

    per month

    Pricing
    IzendaPlotly Chart Studio
    Editions & Modules
    No answers on this topic
    Private Hosting
    $99.00
    per month
    Offerings
    Pricing Offerings
    IzendaPlotly Chart Studio
    Free Trial
    YesNo
    Free/Freemium Version
    NoNo
    Premium Consulting/Integration Services
    YesNo
    Entry-level Setup FeeNo setup feeNo setup fee
    Additional DetailsNo per user or core fees, unlimited use licensing for production and non-production instances.—
    More Pricing Information
    Features
    IzendaPlotly Chart Studio
    BI Standard Reporting
    Comparison of BI Standard Reporting features of Izenda and Plotly Chart Studio
    Feature
    Izenda
    9.3
    2 Ratings
    13% above category average
    Plotly Chart Studio
    8.0
    1 Ratings
    1% below category average
    Pixel Perfect reports9.02 Ratings8.01 Ratings
    Customizable dashboards10.02 Ratings00 Ratings
    Report Formatting Templates9.02 Ratings00 Ratings
    Ad-hoc Reporting
    Comparison of Ad-hoc Reporting features of Izenda and Plotly Chart Studio
    Feature
    Izenda
    9.3
    2 Ratings
    15% above category average
    Plotly Chart Studio
    9.0
    1 Ratings
    14% above category average
    Drill-down analysis9.02 Ratings00 Ratings
    Formatting capabilities10.02 Ratings00 Ratings
    Report sharing and collaboration9.02 Ratings00 Ratings
    Integration with R or other statistical packages00 Ratings9.01 Ratings
    Report Output and Scheduling
    Comparison of Report Output and Scheduling features of Izenda and Plotly Chart Studio
    Feature
    Izenda
    8.8
    2 Ratings
    7% above category average
    Plotly Chart Studio
    -
    Ratings
    Publish to Web9.02 Ratings00 Ratings
    Publish to PDF9.02 Ratings00 Ratings
    Report Versioning9.02 Ratings00 Ratings
    Report Delivery Scheduling8.02 Ratings00 Ratings
    Data Discovery and Visualization
    Comparison of Data Discovery and Visualization features of Izenda and Plotly Chart Studio
    Feature
    Izenda
    9.0
    2 Ratings
    12% above category average
    Plotly Chart Studio
    8.5
    1 Ratings
    9% above category average
    Pre-built visualization formats (heatmaps, scatter plots etc.)10.02 Ratings9.01 Ratings
    Location Analytics / Geographic Visualization8.02 Ratings8.01 Ratings
    Predictive Analytics9.02 Ratings00 Ratings
    Access Control and Security
    Comparison of Access Control and Security features of Izenda and Plotly Chart Studio
    Feature
    Izenda
    9.0
    2 Ratings
    6% above category average
    Plotly Chart Studio
    -
    Ratings
    Multi-User Support (named login)8.02 Ratings00 Ratings
    Role-Based Security Model9.02 Ratings00 Ratings
    Multiple Access Permission Levels (Create, Read, Delete)10.02 Ratings00 Ratings
    Mobile Capabilities
    Comparison of Mobile Capabilities features of Izenda and Plotly Chart Studio
    Feature
    Izenda
    10.0
    2 Ratings
    25% above category average
    Plotly Chart Studio
    -
    Ratings
    Responsive Design for Web Access10.02 Ratings00 Ratings
    Dashboard / Report / Visualization Interactivity on Mobile10.02 Ratings00 Ratings
    Best Alternatives
    IzendaPlotly Chart Studio
    Small Businesses
    Cyfe
    Score4 out of 10
    Chartio (discontinued)
    Score7.5 out of 10
    Medium-sized Companies
    Qlik Cloud Analytics (Qlik Sense)
    Score8.1 out of 10
    Jet Reports
    Score9.5 out of 10
    Enterprises
    Jaspersoft Community Edition
    Score7 out of 10
    Kibana
    Score8.4 out of 10
    All AlternativesView all alternativesView all alternatives
    User Ratings
    IzendaPlotly Chart Studio
    Likelihood to Recommend
    10.0
    (2 ratings)
    8.0
    (2 ratings)
    Usability
    8.0
    (1 ratings)
    -
    (0 ratings)
    Support Rating
    9.0
    (1 ratings)
    -
    (0 ratings)
    Data Sharing and Collaboration
    8.0
    (1 ratings)
    -
    (0 ratings)
    Data Sources
    7.0
    (1 ratings)
    -
    (0 ratings)
    User Testimonials
    IzendaPlotly Chart Studio
    Likelihood to Recommend
    Izenda
    With Izenda, we can offer our trusted users dashboards, generated custom reports, and ad-hoc reporting, right within our own operation. Integrating the Izenda tool directly into our usage meant that we were suitable to use a small corridor of Izenda as core functionality while reserving the more advanced sections of Izenda for guests willing to pay redundancy for the licensing.
    Read full review
    Plotly
    [Plotly Chart Studio is] a great tool to make visualizations on a web based portal. For python developers, it can ease of some burden of writing code again and again for the same thing and also refreshing visualizations on old scripts when data changes. All in all, a simple yet effective tool for your report generation and visualization needs[.]
    Incentivized
    Read full review
    Pros
    Izenda
    • User and tenant management is excellent. It is very simple to implement and easy to manage.
    • The configurability and customizability are excellent. We have access to all aspects of the system and have rebranded and configured single sign on. The users really like it.
    • Reports and visualizations work. There's lots of flexibility and users enjoy creating reports themselves.
    Incentivized
    Read full review
    Plotly
    • Connects to almost every kind of data source like SQL, Excel, MS Access, flat files and more.
    • Charts get saved to the repository and are re-used by multiple users.
    • No need of manual intervention in order to refresh the charts every time the data gets changed.
    Incentivized
    Read full review
    Cons
    Izenda
    • It would be superb if power users were ready to input a SQL statement to create a knowledge set.
    • The data source selection view while creating a replacement report.
    Read full review
    Plotly
    • Lack of customer support
    • Sometimes fails to visualize extremely large datasets ( probably also due to computer resource constraints)
    Incentivized
    Read full review
    Usability
    Izenda
    With the help of Izenda, we are able to build a mature foundation that users can quickly customize to their needs. Once permissions are layered in, we can simply use the same report and only show fields a specific user has access to.
    Read full review
    Plotly
    No answers on this topic
    Support Rating
    Izenda
    Izenda always provides great support to their users.
    Read full review
    Plotly
    No answers on this topic
    Alternatives Considered
    Izenda
    We compared to other end user tools like Qlik, Tableau and Power BI. These tools are very refined but not positioned for OEM/Embedded use cases. The closest we came was logi and Birst and the price and business model of Izenda was much more appealing
    Incentivized
    Read full review
    Plotly
    Incentivized
    Read full review
    Return on Investment
    Izenda
    • One of the best user interfaces.
    • Even a non-tech person can use it.
    Read full review
    Plotly
    • Improvement in productivity as charts can be shared with teams and feedback can be collected, consolidated and incorporated in the design and charts.
    • Charts are aligned with the organization theme and colors and one doesn't need to put in effort every time to do that.
    • No upfront capital expenditure and minimum user criteria helps the organization to keep the costs down.
    Incentivized
    Read full review
    ScreenShots

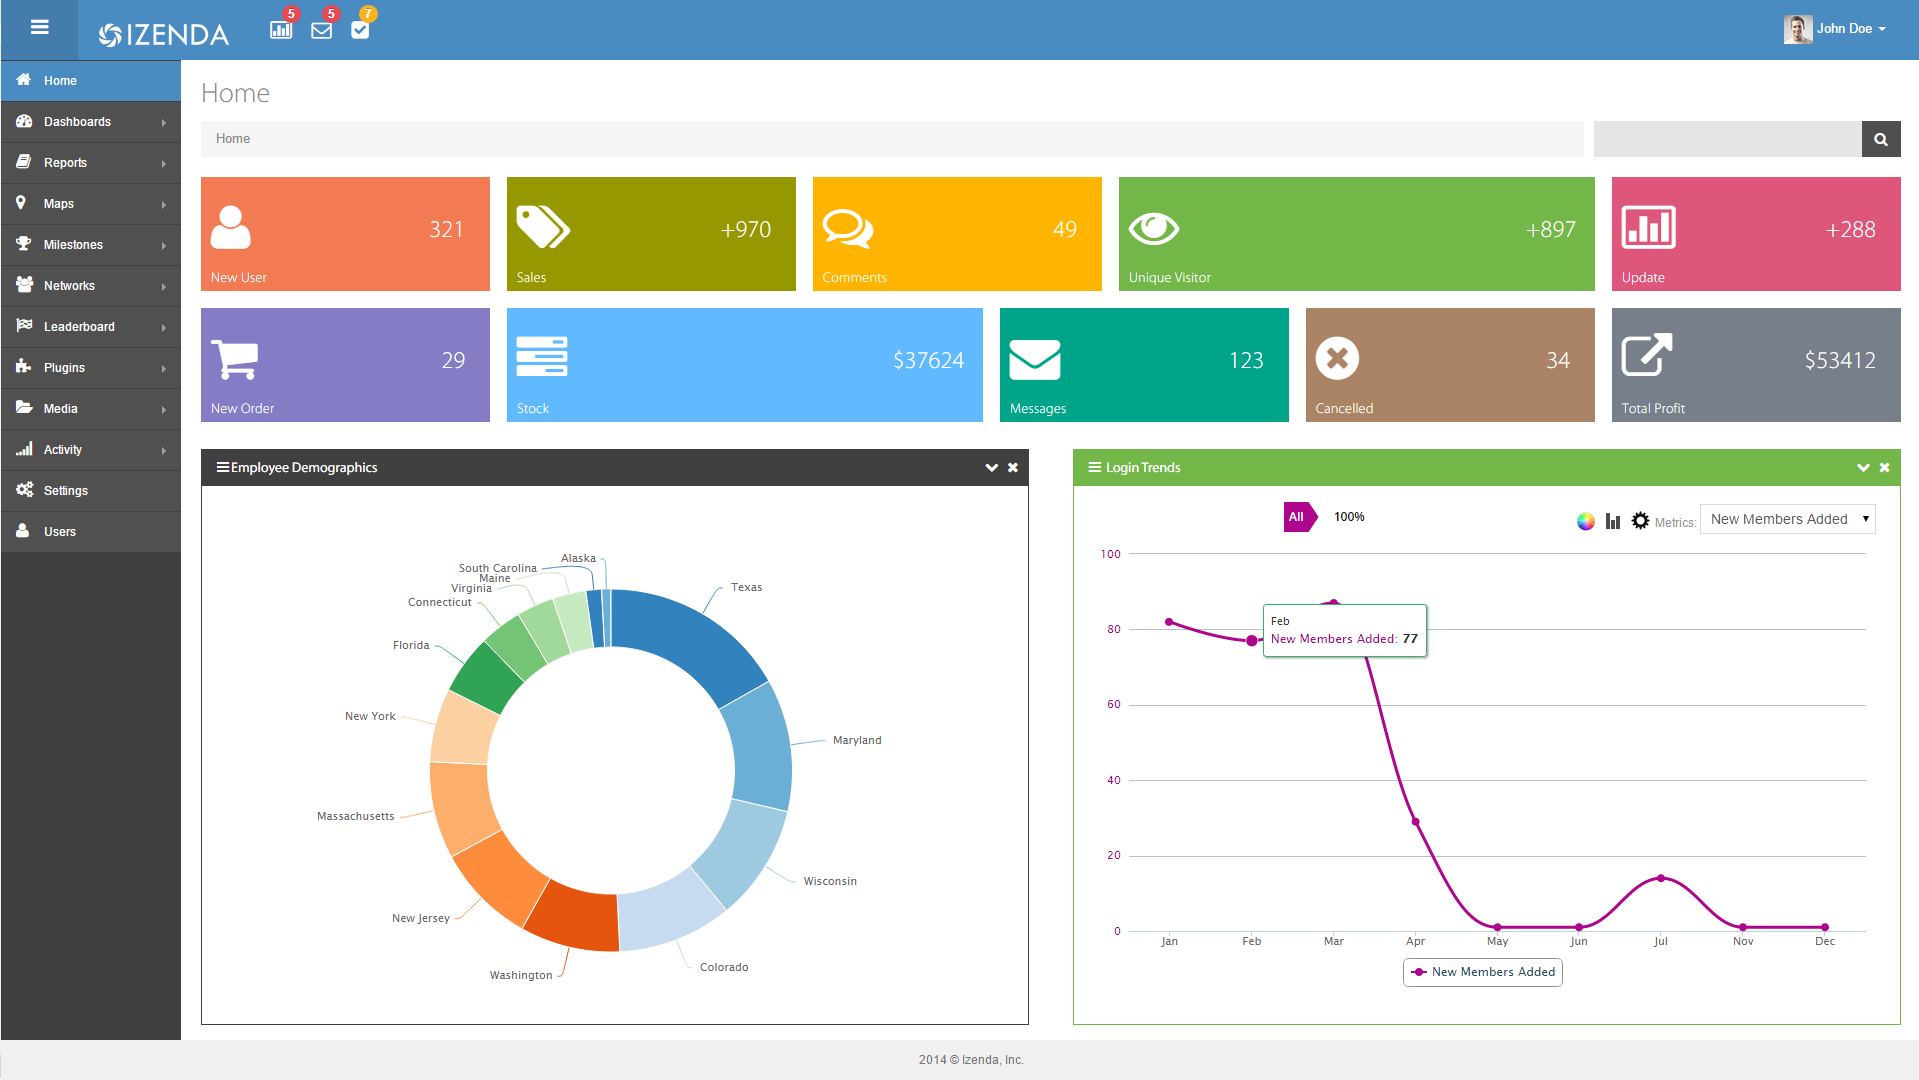
    Izenda Screenshots

    Screenshot of Example of white label integration that inherits an application's look and feel.Screenshot of Report Designer with data field query capabilities.Screenshot of Visualizations on a dashboard.Screenshot of Another example of a modern dashboard.